. 2023 Jan 10;15(2):350.
doi: 10.3390/nu15020350.

Novel Therapeutic Potentials of Taxifolin for Obesity-Induced Hepatic Steatosis, Fibrogenesis, and Tumorigenesis

Affiliations

Novel Therapeutic Potentials of Taxifolin for Obesity-Induced Hepatic Steatosis, Fibrogenesis, and Tumorigenesis

Takayuki Inoue et al. Nutrients. .

Abstract

The molecular pathogenesis of nonalcoholic steatohepatitis (NASH) includes a complex interaction of metabolic stress and inflammatory stimuli. Considering the therapeutic goals of NASH, it is important to determine whether the treatment can prevent the progression from NASH to hepatocellular carcinoma. Taxifolin, also known as dihydroquercetin, is a natural bioactive flavonoid with antioxidant and anti-inflammatory properties commonly found in various foods and health supplement products. In this study, we demonstrated that Taxifolin treatment markedly prevented the development of hepatic steatosis, chronic inflammation, and liver fibrosis in a murine model of NASH. Its mechanisms include a direct action on hepatocytes to inhibit lipid accumulation. Taxifolin also increased brown adipose tissue activity and suppressed body weight gain through at least two distinct pathways: direct action on brown adipocytes and indirect action via fibroblast growth factor 21 production in the liver. Notably, the Taxifolin treatment after NASH development could effectively prevent the development of liver tumors. Collectively, this study provides evidence that Taxifolin shows pleiotropic effects for the treatment of the NASH continuum. Our data also provide insight into the novel mechanisms of action of Taxifolin, which has been widely used as a health supplement with high safety.

Keywords: Taxifolin; antioxidant; brown adipocytes; fibroblast growth factor-21; inflammation; nonalcoholic steatohepatitis (NASH); obesity.


Conflict of interest statement

The authors declare no conflict of interest. The funding agencies had no role in the design of the study; in the collection, analyses, or interpretation of data; in the writing of the manuscript; or in the decision to publish the results. Seaknit Biotechnology Co., Ltd., donated; Department of Metabolic Syndrome and Nutritional Science, Research Institute of Environmental Medicine, Nagoya University.

Figures

Figure 1
Figure 1
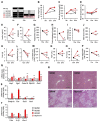
The preventive effects of Taxifolin on obesity and metabolic derangements in diet-induced obese mice. (A) Experimental protocol: male C57BL/6J mice were divided into the following 4 groups—SD group with a standard diet, HD group with a high-fat diet, TX-L group with a high-fat diet containing 0.05% (wt/wt) of Taxifolin, and TX-H group with a high-fat diet containing 3% (wt/wt) of Taxifolin. n = 6 in each group. (B) Growth curve; (C) tissue weights; (D) rectal temperature; (EG) blood glucose levels (E), serum insulin concentrations (F), and homeostasis model assessment of insulin resistance (HOMA-IR) under fasting conditions (G); (H,I) intraperitoneal glucose tolerance test (injection of 1.0 g/kg of glucose) after 12 weeks of high-fat diet feeding: (H) blood glucose levels; (I) area under the curve (AUC) values for the blood glucose concentrations during the glucose tolerance test; (JM) serum concentrations of malondialdehyde (MDA), triglyceride, total cholesterol, and nonesterified fatty acid (NEFA). Values are presented as the means ± SEM; significant differences: * p < 0.05 and ** p < 0.01 vs. HD.
Figure 2
Figure 2
Preventive effects of Taxifolin on hepatic steatosis in diet-induced obese mice. White square: SD; black square: HD; dark-green square: TX-L; light-green square: TX-H. n = 6 in each group. (A) Serum concentrations of AST and ALT after 12 weeks of HD feeding; (B,C) hepatic triglyceride and MDA contents; (D) hematoxylin and eosin (HE) staining of the liver. Insets: gross appearance of the livers. Scale bars: 100 µm. (E,F) Expression levels of genes related to lipogenesis (Srebp1c, Fas, Scd1, and Acc1) and inflammation (Tnfα, Il1b, and Emr1 (F4/80)) in the liver; (G,H) immunoblot analysis of the protein expression levels related to lipogenesis (FAS, SCD-1, and ACC) and inflammation (TNFα) in the liver. β-actin was used as a loading control. Values are presented as the means ± SEM; n = 6; significant differences: ** p < 0.01 vs. HD.
Figure 3
Figure 3
Involvement of Fgf21 in Taxifolin-mediated anti-obesity effects. (AC) Male C57BL/6J mice were divided into the following 4 groups: white square, SD; black square, HD; dark-green square, TX-L; light-green square, TX-H. n = 6 in each group. (A) Expression levels of genes related to brown adipocyte activation (Ucp1, Pgc1, Prdm16, Zfp516, and Dio2) in interscapular brown adipose tissue of the C57BL/6J mice fed an HD with or without Taxifolin for 12 weeks. (B) Expression levels of Fgf21 and Il6 mRNAs in the liver. (C) Serum Fgf21 concentrations after 12 weeks of HD feeding with or without Taxifolin. Mean ± SEM; n = 6; * p < 0.05 and ** p < 0.01 vs. HD. (DH) Male C57BL/6J mice (wild-type, WT) and Fgf21-deficient mice (Fgf21-KO) were divided into the following 5 groups: white square, WT/SD; black square, WT/HD; gray square, TX/H; dark-green square, Fgf21-KO/HD; light-green square, Fgf21-KO/HD-TX-H. n = 6 in each group. (D) Experimental protocol: Fgf21-deificient and wild-type mice were fed an HD with or without Taxifolin for 6 weeks; (E) growth curve; (F) food intake; (G) rectal temperature; (H) tissue weights: liver, liver-to-body weight ratio, epididymal fat, subcutaneous fat, and interscapular brown adipose tissue. Values are presented as the means; n = 5–6; significant differences: * p < 0.05 and ** p < 0.01.
Figure 4
Figure 4
Direct action of Taxifolin on brown adipocytes: (A) experimental protocol: human iPS cell-derived brown adipocytes (hiPSCdBAs) were differentiated and then treated with Taxifolin at 100 μM for 48 h; (B) expression levels of genes related to brown adipocyte markers (UCP1, PRDM16, EVA1, and ELOVL3); (C) expression levels of FGF21 and IL6 mRNAs in the hiPSCdBAs. Values are presented as the means ± SEM; n = 3; significant differences: ** p < 0.05 vs. hiPSCdBAs without Taxifolin treatment.
Figure 5
Figure 5
Therapeutic effects of Taxifolin on hepatic steatosis in diet-induced obese mice. (A) Experimental protocol: after being fed an HD for 12 weeks, C57BL/6J mice were divided into the following 3 groups and then fed the respective diets for an additional 12 weeks—HD/SD group with an SD, HD/HD group with an HD, and HD/TX-H group with an HD containing 3% (wt/wt) Taxifolin. The mice were also fed an HD for 12 weeks as the pretreatment HD group and an SD for 24 weeks as the control SD/SD group. n = 6 in each group. (BD) Time course of body weight (B), fasting blood glucose levels (C), and rectal temperature (D). E-P: Metabolic parameters and tissue weights of the HD, HD/SD, HD/HD, and HD/TX-H groups. Serum concentrations of insulin (E), triglyceride (G), total cholesterol (H), NEFA (I), MDA (J), AST (N), and ALT (O). (F) HOMA-IR. Liver (K) and epididymal fat (L) tissue weights. Hepatic MDA (M) and triglyceride (P) contents. (QT) Four groups: white square, SD/SD; gray square, HD/SD; dark-red square, TX-L; light-red square: TX-H. (Q) Expression levels of genes related to brown adipocyte markers (Ucp1, Pgc1, Prdm16, Zfp516, and Dio2) in the interscapular brown adipose tissue. (R) HE staining of the liver. Scale bars: 200 µm. (S,T) Expression levels of genes related to lipogenesis (Srebp1c, Fas, Scd1, and Acc1) and inflammation (Tnfα, Il1b, and Emr1 (F4/80)) in the liver. Values are presented as the means ± SEM; n = 6; significant differences: * p < 0.05 and ** p < 0.01 vs. HD/HD; # p < 0.05 vs. HD.
Figure 6
Figure 6
Direct action of Taxifolin on hepatocytes. (A) Experimental protocol: HepG2 cells were treated with Taxifolin (0.01 and 10 µM) for 24 h in the presence of palmitate (400 µM). (B) Cell viability after treatment with Taxifolin (1, 10, 50, and 100 µM and 1 mM) for 24 h. (C,D) Representative image of Oil Red O staining (C) and its quantitative evaluation measuring the absorbance at 540 nm (D). HepG2 cells were treated with vehicle (a), palmitate 400 µM (b), and palmitate with 0.01 µM (c) or 10 µM (d) Taxifolin for 24 h. Scale bars: 100 µm. E and F: Expression levels of SREBP1 (E) and FAS (F) mRNAs in the HepG2 cells. Values are presented as the means ± SEM; n = 3; significant differences: ** p < 0.01 vs. palmitate.
Figure 7
Figure 7
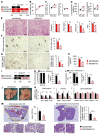
Preventive effects of Taxifolin on the development of NASH in a mouse model. (A) Experimental protocol: genetically obese melanocotin-4 receptor (Mc4r)-deficient mice on a WD with or without 3% Taxifolin for 20 weeks (MC/WD or MC/WD-TX, respectively). Wild-type mice on a standard diet for 20 weeks (WT/SD) were used as a control. (B) Growth curve: C-I 3 groups–white square, WT/SD; black square, MC/WD; light-red square, MC/WD-TX. (C) Liver and epididymal fat weights. (D) Hepatic triglyceride and total cholesterol contents. (E) HE staining of the liver. Histological analysis using the nonalcoholic fatty liver disease (NAFLD) activity score (NAS) system. (F) F4/80 immunostaining. The arrows indicate the crown-like structures (CLS). (G) Sirius red staining. (H) Hydroxyproline contents of the liver. (I) Expression levels of genes related to inflammation (Emr1, Itgax, and Tnfα), fibrosis (Tgfb1, Timp1, and Col1a1), and lipid metabolism (Ppara, Cpt1a, Acox, Srebp1, and Fas). Scale bars: 100 µm. Values are presented as the means ± SEM; n = 11–12; significant differences: * p < 0.05 and ** p < 0.01.
Figure 8
Figure 8
Therapeutic effects of Taxifolin on the progression of NASH in a mouse model. (A) Experimental protocol: the Mc4r-deficient mice were on a WD for 16 weeks to develop NASH and then treated with or without 3% Taxifolin for an additional 8 weeks (MC/WD/WD or MC/WD/TX, respectively). (B) Growth curve; (C) liver and epididymal fat weights; (D) hepatic triglyceride and total cholesterol contents. (EH) Two groups: dark-red square, MC/WD/WD; light-red square, MC/WD/WD-TX. (E) HE staining of the liver. Histological analysis using the NAS. Scale bars: 100 µm. (F) F4/80 immunostaining of the liver. The arrows indicate the CLS. (G) Immunostaining for collagen type III of the liver. (H) Hydroxyproline contents of the liver. Scale bars: 100 µm; n = 10–11; * p < 0.05 and ** p < 0.01. (I) experimental protocol: the Mc4r-deficient mice were fed a WD for 20 weeks to develop NASH and then treated with or without 3% Taxifolin for an additional 30 weeks (MC/WD/WD or MC/WD/TX, respectively). (J) Representative image of the gross appearance of the livers. (KM) Two groups: black square, MC/WD/WD; light-red square, MC/WD/WD-TX. (K,L) Incidence and multiplicity of foci (K) and tumors (L) in the liver. (M) Representative images of the HE staining of the macroscopic tumoral (left) and nontumoral (right) lesions. The areas defined by yellow and red lines indicate a grossly detectable tumor and an HCC-like lesion that can only be detected by histological examination, respectively. a–c: A higher magnification view of the HCC-like lesion (a), background tumor (b), and dysplastic nodule (c). (N): Expression levels of genes related to inflammation (Emr1, Itgax, and Tnfα), fibrosis (Tgfb1, Timp1, and Col1a1), and lipid metabolism (Pparα, Cpt1a, Acox, Srebp1, and Fas) in nontumorous lesions of the liver. Values are presented as the means ± SEM; n = 13 and 12, for MC/WD/WD and MC/WD/TX, respectively; significant differences: ** p < 0.01.

References

    1. Vuppalanchi R., Noureddin M., Alkhouri N., Sanyal A.J. Therapeutic pipeline in nonalcoholic steatohepatitis. Nat. Rev. Gastroenterol. Hepatol. 2021;18:373–392. doi: 10.1038/s41575-020-00408-y. - DOI - PubMed
    1. Tilg H., Moschen A.R. Evolution of inflammation in nonalcoholic fatty liver disease. The multiple parallel hits hypothesis. Hepatology. 2010;52:1836–1846. doi: 10.1002/hep.24001. - DOI - PubMed
    1. Itoh M., Suganami T., Nakagawa N., Tanaka M., Yamamoto Y., Kamei Y., Terai S., Sakaida I., Ogawa Y. Melanocortin 4 receptor-deficient mice as a novel mouse model of nonalcoholic steatohepatitis. Am. J. Pathol. 2011;79:2454–2463. doi: 10.1016/j.ajpath.2011.07.014. - DOI - PMC - PubMed
    1. Yoshioka N., Tanaka M., Ochi K., Watanabe A., Ono K., Sawada M., Ogi T., Itoh M., Ito A., Shiraki Y., et al. The sodium-glucose cotransporter-2 inhibitor Tofogliflozin prevents the progression of nonalcoholic steatohepatitis-associated liver tumors in a novel murine model. Biomed. Pharmacother. 2021;140:111738. doi: 10.1016/j.biopha.2021.111738. - DOI - PubMed
    1. Kawakubo M., Tanaka M., Ochi K., Watanabe A., Saka-Tanaka M., Kanamori Y., Yoshioka N., Yamashita S., Goto M., Itoh M., et al. Dipeptidyl peptidase-4 inhibition prevents nonalcoholic steatohepatitis-associated liver fibrosis and tumor development in mice independently of its anti-diabetic effects. Sci. Rep. 2020;10:983. doi: 10.1038/s41598-020-57935-6. - DOI - PMC - PubMed