. 2023 Jan 10;12(1):118.
doi: 10.3390/pathogens12010118.

A Synthetic Polymicrobial Community Biofilm Model Demonstrates Spatial Partitioning, Tolerance to Antimicrobial Treatment, Reduced Metabolism, and Small Colony Variants Typical of Chronic Wound Biofilms

Affiliations

A Synthetic Polymicrobial Community Biofilm Model Demonstrates Spatial Partitioning, Tolerance to Antimicrobial Treatment, Reduced Metabolism, and Small Colony Variants Typical of Chronic Wound Biofilms

Ammara Khalid et al. Pathogens. .

Abstract

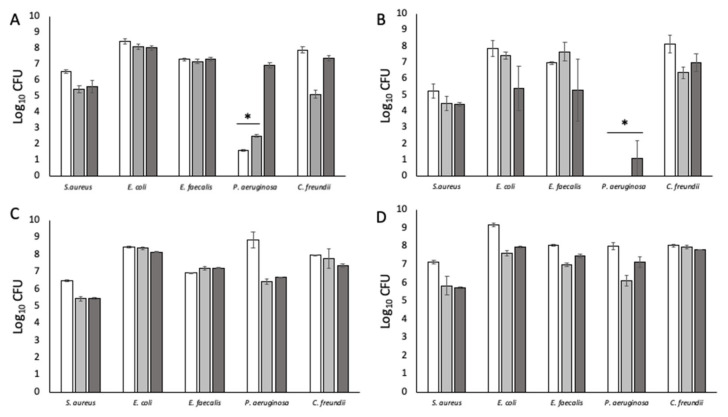
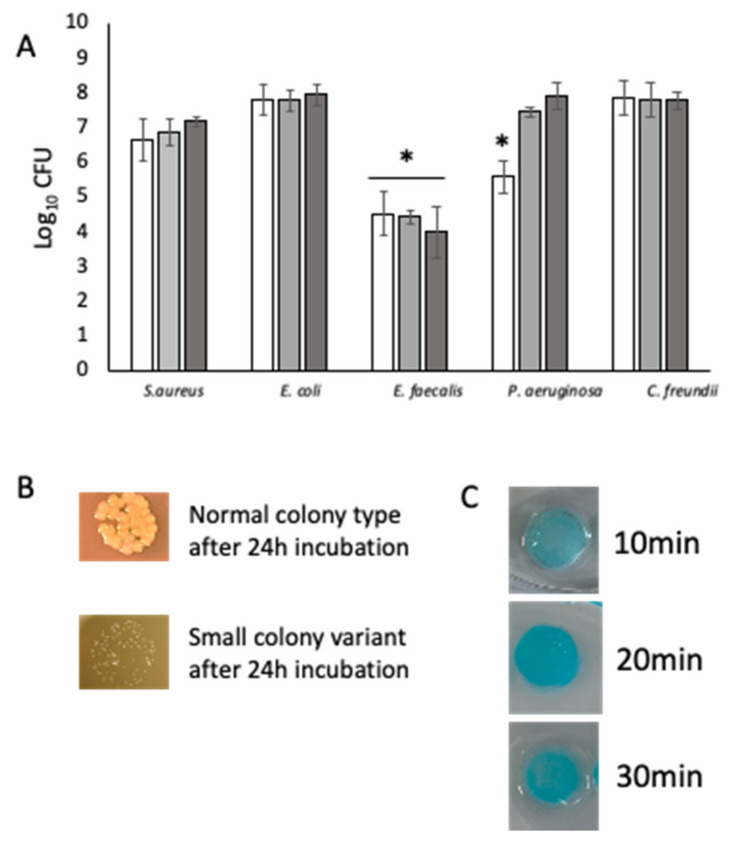
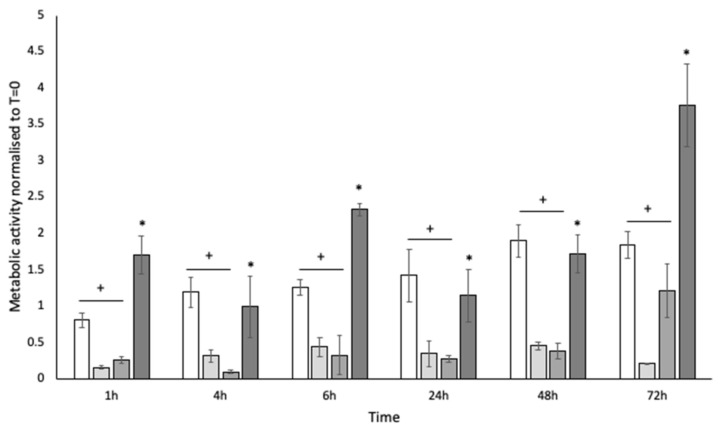
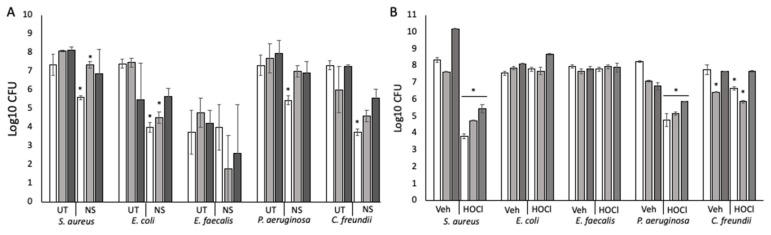
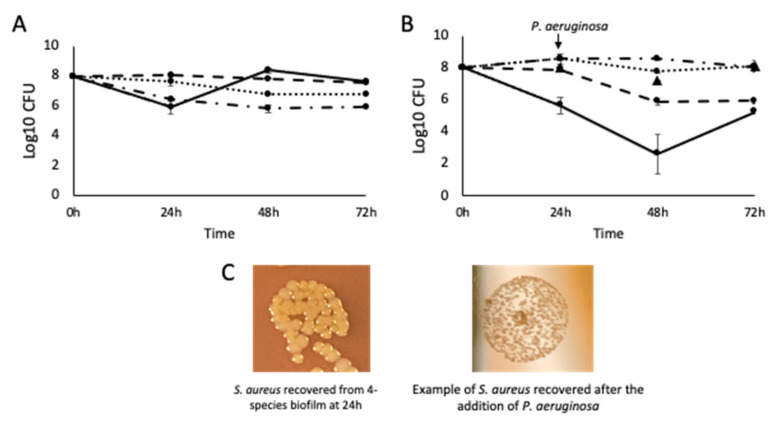
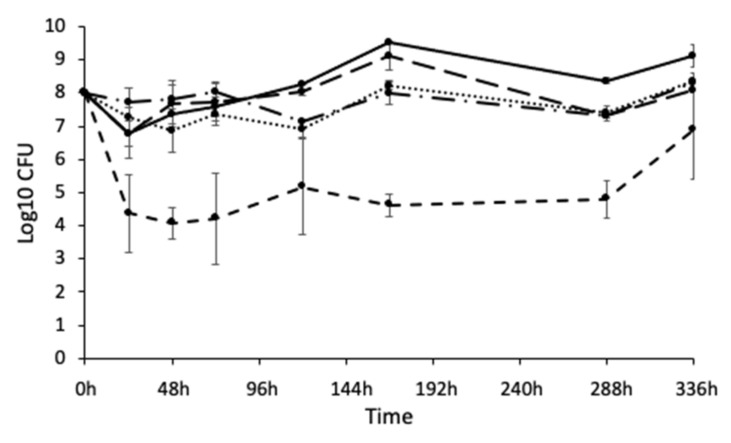
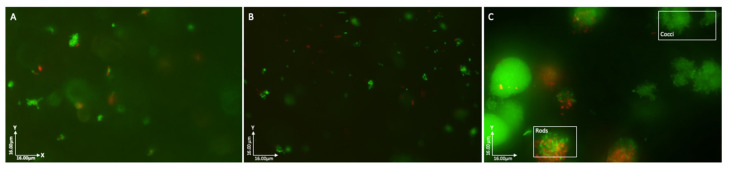
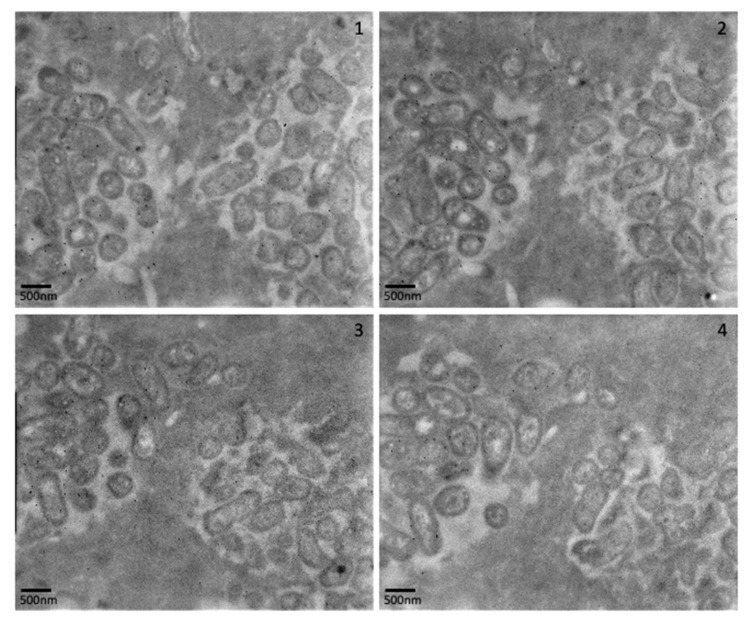
Understanding chronic wound infection is key for successful treatment and requires accurate laboratory models. We describe a modified biofilm flow device that effectively mimics the chronic wound environment, including simulated wound fluid, a collagen-based 3D biofilm matrix, and a five-species mixture of clinically relevant bacteria (Pseudomonas aeruginosa, Staphylococcus aureus, Escherichia coli, Enterococcus faecalis, and Citrobacter freundii). Mixed biofilms were cultured for between 3 and 14 days with consistent numbers of bacteria that exhibited reduced metabolic activity, which increased with a high dose of glucose. S. aureus was recovered from biofilms as a small colony variant, but as a normal colony variant if P. aeruginosa was excluded from the system. Bacteria within the biofilm did not co-aggregate but formed discrete, species-specific clusters. Biofilms demonstrated differential tolerance to the topical antimicrobials Neosporin and HOCl, consistent with protection due to the biofilm lifestyle. The characteristics exhibited within this model match those of real-world wound biofilms, reflecting the clinical scenario and yielding a powerful in vitro tool that is versatile, inexpensive, and pivotal for understanding chronic wound infection.

Keywords: antimicrobial; polymicrobial; wound infection.


Conflict of interest statement

L.I.R. is a consultant at Briotech Incorporated. The authors declare no other conflict of interest.

Figures

Figure 1
Figure 1
Numbers of bacteria recovered from alginate matrices under different experimental conditions. (A) Bacteria inoculated into alginate and recovered by dissolving with 20 mM EDTA. (B) Bacteria embedded in alginate and recovered by dissolving with 20 mM EDTA. (C) Bacteria injected into alginate and recovered by homogenising. (D) Bacteria embedded in alginate and recovered by homogenising. White bars: 24 h; grey bars: 48 h; dark grey bars 72 h. (*) Indicates statistically significant differences (p < 0.05) in bacterial count. n = 9.
Figure 2
Figure 2
Five-species biofilms cultured for 72 h under flow conditions. (A) Each of the five species recovered from homogenised biofilms at 24 h, 48 h, and 72 h. n = 9. (B) S. aureus was recovered as small colony variants following co-culture in the biofilm model. Top: example of S. aureus normal colony type; bottom: example of S. aureus SCV recovered from the biofilm model. (C) Diffusion of methylene blue through the agarose–collagen matrix assessed at 10 min, 20 min, and 30 min demonstrate nutrient permeation for embedded bacteria under flow. (*) Indicates statistically significant differences (p < 0.05) in bacterial count. White bars: 24 h; grey bars: 48 h; dark grey bars 72 h. (*) Indicates statistically significant differences (p < 0.05) in bacterial count.
Figure 3
Figure 3
Metabolic activity of whole homogenised biofilms assessed by the reduction of resazurin at 1 h, 4 h, 6 h, 24 h, 48 h, and 72 h. White bars: planktonic culture; pale grey bars: standard SWF (no glucose); mid-grey bars 10 mg mL−1 glucose; dark grey bars: 20 mg mL−1 glucose. (+) Indicates a statistically significant reduction in metabolic activity compared to planktonic culture; (*) indicates a statistically significant increase in metabolic activity compared to the no-glucose control and 20 mg mL−1 glucose. n = 6.
Figure 4
Figure 4
Treatment of biofilms with a topical antibiotic and a topical antiseptic. (A) Biofilms treated with Neosporin for 72 h. UT: untreated biofilm; NS: Neosporin-treated biofilm. (B) Biofilms treated with HOCl gel or a vehicle control (NaCl) gel. Veh: biofilms treated with the vehicle control; HOCl: HOCl-treated biofilms. White bars: 24 h post-treatment; mid-grey bars: 48 h post-treatment; dark grey bars: 72 h post-treatment. (*) Indicates statistically significant differences (p < 0.05) in bacterial count. n = 9.
Figure 5
Figure 5
The effect of P. aeruginosa on the growth characteristics of S. aureus and E. faecalis. (A) Four-species biofilm excluding P. aeruginosa. n = 9. (B) Four-species biofilms with the addition of P. aeruginosa at 24 h. n = 9 (PA: Log10 CFU at 48 h and 72 h, indicated by black triangles) (C) The change in morphotype of S. aureus after the introduction of P. aeruginosa to the biofilm at 24 h. S. aureus: solid line; E. coli: dotted line; E. faecalis: short dashes; P. aeruginosa: long dashes; C. freundii: dots and dashes.
Figure 6
Figure 6
Five-species biofilm cultured at 33 °C under flow for 336 h (14 days). The population remained relatively stable over time, with E. faecalis consistently the least numerous. n = 9. S. aureus: solid line; E. coli: dotted line; E. faecalis: short dashes; P. aeruginosa: long dashes; C. freundii: dots and dashes.
Figure 7
Figure 7
Fluorescent microscopy of biofilms stained with LIVE/DEADTM (SYTO9 and PI). (A) 24 h biofilm; (B) 48 h biofilm; (C) 72 h biofilm. Images show predominantly viable bacteria arranged in discrete aggregates comprised of bacteria with similar cell morphologies (rod or coccus).
Figure 8
Figure 8
Transmission electron microscopy of biofilm sections (top–bottom: 1–4) with gold-labelled antibodies specific to E. coli (15 nm) and P. aeruginosa (10 nm). In each image, E. coli is seen in aggregates on the left of the images, and P. aeruginosa is seen in aggregates on the right of the images.
Figure 9
Figure 9
Transmission electron microscopy of mixed biofilms (at 72 h) labelled with E. coli-specific gold-labelled antibodies. (A) An aggregate of E. coli is visible on the right of the image with a channel/track close by. (B) Channel/track through the collagen–agarose matrix stained with E. coli-specific gold-labelled antibodies. White arrows highlight striations that may signify the direction of movement.

References

    1. Omar A., Wright J., Schultz G., Burrell R., Nadworny P. Microbial Biofilms and Chronic Wounds. Microorganisms. 2017;5:9. doi: 10.3390/microorganisms5010009. - DOI - PMC - PubMed
    1. Guest J.F., Vowden K., Vowden P. The Health Economic Burden That Acute and Chronic Wounds Impose on an Average Clinical Commissioning Group/Health Board in the UK. J. Wound Care. 2017;26:292–303. doi: 10.12968/jowc.2017.26.6.292. - DOI - PubMed
    1. Bowler P.G., Duerden B.I., Armstrong D.G. Wound Microbiology and Associated Approaches to Wound Management. Clin. Microbiol. Rev. 2001;14:26. doi: 10.1128/CMR.14.2.244-269.2001. - DOI - PMC - PubMed
    1. Fazli M., Bjarnsholt T., Kirketerp-Møller K., Jørgensen B., Andersen A.S., Krogfelt K.A., Givskov M., Tolker-Nielsen T. Nonrandom Distribution of Pseudomonas Aeruginosa and Staphylococcus Aureus in Chronic Wounds. J. Clin. Microbiol. 2009;47:4084–4089. doi: 10.1128/JCM.01395-09. - DOI - PMC - PubMed
    1. Hinchliffe R.J., Valk G.D., Apelqvist J., Armstrong D.G., Bakker K., Game F.L., Hartemann-Heurtier A., Löndahl M., Price P.E., van Houtum W.H., et al. A Systematic Review of the Effectiveness of Interventions to Enhance the Healing of Chronic Ulcers of the Foot in Diabetes. Diabetes Metab. Res. Rev. 2008;24:S119–S144. doi: 10.1002/dmrr.825. - DOI - PubMed

LinkOut - more resources