. 2023 Jan 5;15(1):195.
doi: 10.3390/pharmaceutics15010195.

A Mechanistic Pharmacodynamic Modeling Framework for the Assessment and Optimization of Proteolysis Targeting Chimeras (PROTACs)

Affiliations

A Mechanistic Pharmacodynamic Modeling Framework for the Assessment and Optimization of Proteolysis Targeting Chimeras (PROTACs)

Robin Thomas Ulrich Haid et al. Pharmaceutics. .

Abstract

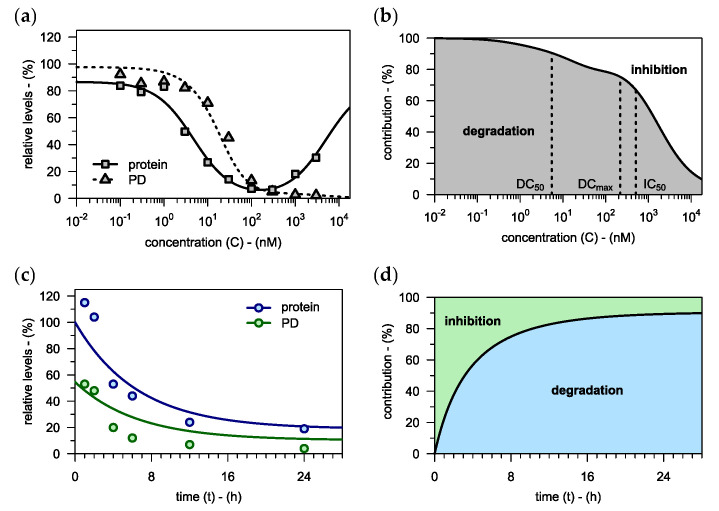
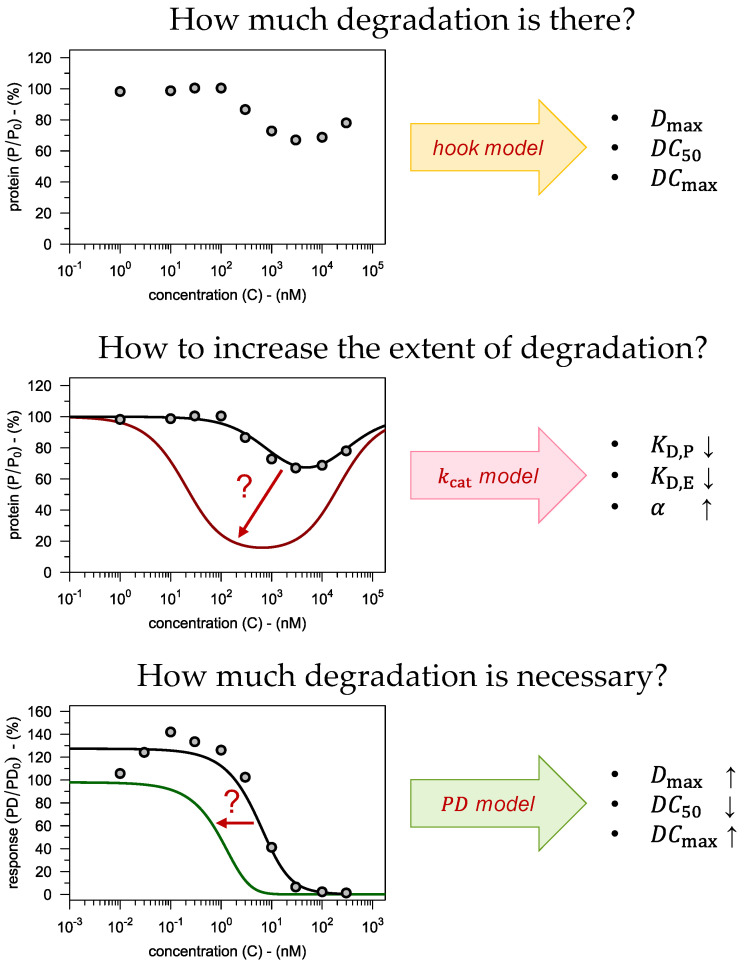
The field of targeted protein degradation is growing exponentially. Yet, there is an unmet need for pharmacokinetic/pharmacodynamic models that provide mechanistic insights, while also being practically useful in a drug discovery setting. Therefore, we have developed a comprehensive modeling framework which can be applied to experimental data from routine projects to: (1) assess PROTACs based on accurate degradation metrics, (2) guide compound optimization of the most critical parameters, and (3) link degradation to downstream pharmacodynamic effects. The presented framework contains a number of first-time features: (1) a mechanistic model to fit the hook effect in the PROTAC concentration-degradation profile, (2) quantification of the role of target occupancy in the PROTAC mechanism of action and (3) deconvolution of the effects of target degradation and target inhibition by PROTACs on the overall pharmacodynamic response. To illustrate applicability and to build confidence, we have employed these three models to analyze exemplary data on various compounds from different projects and targets. The presented framework allows researchers to tailor their experimental work and to arrive at a better understanding of their results, ultimately leading to more successful PROTAC discovery. While the focus here lies on in vitro pharmacology experiments, key implications for in vivo studies are also discussed.

Keywords: PK/PD; PROTAC; event-driven pharmacology; experimental design; hook effect; model-informed drug discovery; proteolysis targeting chimera; targeted protein degradation; translational pharmacology.


Conflict of interest statement

R.T.U.H. and A.R. are employees of and have ownership interest in Bayer AG. The company had no role in the design of the study; in the collection, analyses, or interpretation of data; in the writing of the manuscript, and in the decision to publish the results.

Figures

Figure 1
Figure 1
The concept of the four pillars of translational pharmacology is applied to PROTACs. First, the PROTAC has to get access to its site of action. Next, it must bind to both the target protein as well as the targeted E3 ligase to form a ternary complex. That ternary complex must then mark the target protein for degradation by the proteasome. Finally, degradation of the target protein together with inhibition of what activity remains must translate to the relevant downstream effect.
Figure 2
Figure 2
The pharmacodynamic modeling framework for PROTAC assessment and characterization consists of three models. (1) The kcat model links the biochemical parameters which govern target engagement to target degradation. (2) The hook model relates target degradation to PROTAC concentrations and incubation time. (3) The PD model integrates two mechanisms of target modulation, i.e., target degradation and target inhibition, and translates them to a downstream pharmacodynamic readout.
Figure 3
Figure 3
(a) Relative levels of target protein are plotted against PROTAC concentration in media (i.e., concentration-degradation profile). For comparison, both the hook model presented here as well as the conventional Emax model are fitted to the data (see Figures S1 and S2 for further examples). When fitting the Emax model, only concentrations below the concentration of maximal degradation were considered. (b) A total of 17 concentration-degradation profiles were described using both the hook model and the Emax model. The resulting estimates for the maximal extent of degradation (Dmax) are plotted against the respective experimentally observed values. Experimental data (a,b) taken from Zorba et al. [21]. (c) The hook model is applied to reversible covalent (Cpd. α) and irreversible covalent PROTACs (Cpd. β). Data taken from Gabizon et al. [22]. (d) Protein levels after 6 h of incubation as well as levels after 24 h are plotted against the concentration of the non-covalent PROTAC Cpd. Y. The extended hook model (Equation (14)) is fitted to the concentration-degradation data from the 6 h time point, which then allows to predict degradation after 24 h. The experimental observations for the 24 h time point confirm that prediction. Data taken from Mares et al. [23].
Figure 4
Figure 4
(a) The rate constant of PROTAC-catalyzed protein degradation is fitted to the concentration-degradation profile observed for the lead compound (Cpd. A) in Ramos cells (kcat=4.6 h1). This is the only parameter in this figure that was derived by model fitting. Subsequently, the model is used to predict, what binding affinities would give the orange profile. The optimized compound (Cpd. I), which features the binding affinities suggested by the model (see Table S1), exhibits the desired concentration-degradation profile. (b) Based on the kcat value from Cpd. A and the biochemical input data (Tables S1 and S2), the maximal extent of degradation (Dmax) is predicted for different compounds in different cell types. These predictions are plotted against the estimates for Dmax obtained by characterizing the respective experimental concentration-degradation profiles with the hook model (see Figure 3b). There is good agreement between the predicted and the observed values, as indicated by Pearson’s correlation coefficient (ρ=0.97). (c) The time-course of degradation in Ramos cells following incubation with Cpd. G (C=100 nM) is predicted using the kcat value from Cpd. A. (d) The maximal extent of degradation (Dmax) observed for the nine compounds from before is plotted against the respective target engagement (TE) values calculated using Equation (3). Equation (15) predicts a hyperbolic relationship (TE501%). Experimental data (ad) taken from Zorba et al. [21].
Figure 5
Figure 5
(a) The PD model is fitted to data on the downstream pharmacodynamic response (TNF-alpha levels) in the presence of various concentrations of the lead compound (Cpd. X). This analysis yields the target protein levels of half-maximal pharmacodynamic response (P50=87%) and an empirical hill coefficient (n=7). Subsequently, a target profile is defined for a potential follow-up compound (Cpd. Y). (b) Target protein levels (RIPK2) are plotted against drug concentration. The PD model is used to predict the target concentration-degradation profile for the follow-up compound from before (Cpd. Y). (c) The downstream pharmacodynamic response (TNF-alpha levels) is plotted against the concentration of the corresponding non-degrading (nd) control compounds. (d) The observed TNF-alpha response is plotted against the corresponding RIPK2 levels for both compounds. The dashed line shows the fitted PD model from before, but this time explicitly neglecting inhibition (I=0). Experimental data (ad) taken from Mares et al. [23].
Figure 6
Figure 6
(a) Target protein levels and the downstream pharmacodynamic response are plotted against drug concentration for an in-house PROTAC (see Figure S3 for two more examples). The hook model is used to assess degradation, which is then used to fit the PD model (fitted to all three compounds simultaneously). As predicted by the model (see Appendix D for derivation), there is no hook effect present on the level of the downstream pharmacodynamic response. (b) The relative contributions of target degradation and target inhibition to the overall pharmacodynamic effect are plotted against PROTAC concentration. At higher drug concentrations, inhibition becomes the dominant driver of pharmacodynamic effects, thus compensating for the hook effect in protein levels. (c) Target protein levels and the downstream pharmacodynamic response are plotted against incubation time for an in-house PROTAC which was applied at a constant concentration of C=100 nM. The time-course of degradation is predicted using the extended hook model (Equation (14)). Based on this prediction and considering the compound’s inhibitory potency, the PD model is used to also predict the time-course of the pharmacodynamic response. Both predictions are in good agreement with the observed data. (d) The relative contributions of target degradation and target inhibition to the overall pharmacodynamic effect are plotted against incubation time. Initially, the downstream pharmacodynamic effect is dominated by inhibition, but over time, degradation becomes more important.
Figure 7
Figure 7
Our modeling framework can be used to address three major questions, each associated with one of the pillars of translational pharmacology (see Figure 1 and Figure 2 for color coding). The hook model is fitted to the concentration-degradation profile yielding three parameters which can be used to assess PROTACs as degraders. The kcat model allows to predict what binding affinities are necessary to achieve the desired degradation, thereby giving rational guidance to lead optimization efforts. The PD model translates protein degradation to a defined biomarker response. This is particularly useful when it comes to identifying a target value for protein degradation.

References

    1. Li K., Crews C.M. PROTACs: Past, Present and Future. Chem. Soc. Rev. 2022;51:5214–5236. doi: 10.1039/D2CS00193D. - DOI - PMC - PubMed
    1. Lai A.C., Crews C.M. Induced Protein Degradation: An Emerging Drug Discovery Paradigm. Nat. Rev. Drug Discov. 2017;16:101–114. doi: 10.1038/nrd.2016.211. - DOI - PMC - PubMed
    1. Luh L.M., Scheib U., Juenemann K., Wortmann L., Brands M., Cromm P.M. Prey for the Proteasome: Targeted Protein Degradation—A Medicinal Chemist’s Perspective. Angew. Chem. Int. Ed. Engl. 2020;59:15448–15466. doi: 10.1002/anie.202004310. - DOI - PMC - PubMed
    1. Xiao M., Zhao J., Wang Q., Liu J., Ma L. Recent Advances of Degradation Technologies Based on PROTAC Mechanism. Biomolecules. 2022;12:1257. doi: 10.3390/biom12091257. - DOI - PMC - PubMed
    1. Békés M., Langley D.R., Crews C.M. PROTAC Targeted Protein Degraders: The Past is Prologue. Nat. Rev. Drug Discov. 2022;21:181–200. doi: 10.1038/s41573-021-00371-6. - DOI - PMC - PubMed

LinkOut - more resources