. 2023 Jan 10;12(2):318.
doi: 10.3390/plants12020318.

Research Trends, Biases, and Gaps in Phytochemicals as Insecticides: Literature Survey and Meta-Analysis

Affiliations

Research Trends, Biases, and Gaps in Phytochemicals as Insecticides: Literature Survey and Meta-Analysis

Lara J Collares et al. Plants (Basel). .

Abstract

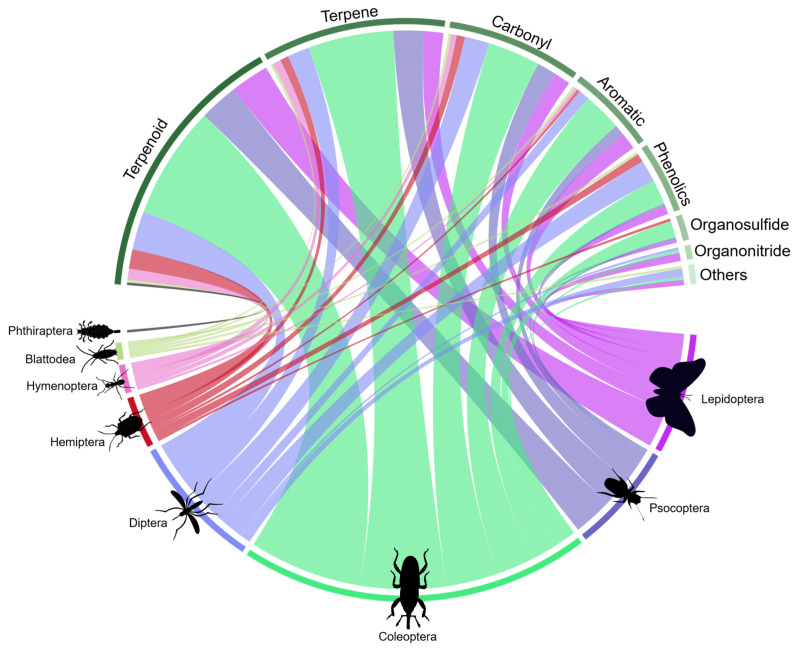
A 76-year literature survey and meta-analyses were carried out to recognize the trends, biases, and knowledge gaps of studies focusing on major groups of compounds of botanical origin, or phytochemicals, as insecticides. The survey found that the main phytochemicals prospected as insecticides belong to the following major chemical groups: terpenoids, terpenes, and carbonyl, all of which were tested, mainly against beetles (Coleoptera), caterpillars (i.e., larvae of Lepidoptera), and mosquitoes and other flies (i.e., Diptera). These studies are burgeoning at an exponential rate, with an evident focus on mortality endpoint estimates, but they are also neglecting sublethal assessments. China and India in Asia, as well as Brazil in the Americas, were responsible for most studies. The majority of the papers used stored grain insects as experimental models, which limits the applicability and representativeness of the findings. As a result, the main modes of exposure tested were fumigation and contact, which leads to the prevalence of estimates of lethal concentration in these studies. Therefore, a broader range of insect species deserves testing, with suitable modes of exposure identifying and characterizing the main molecules responsible for the insecticidal activity, which is seldom performed. Attention to these needs will circumvent current biases and allow the recognition of the main patterns of association between the origin and structure of phytochemicals and their insecticidal effects.

Keywords: arthropods; bioinsecticides; botanical insecticides; insect pest management; natural products; pest control.


Conflict of interest statement

The authors declare no conflict of interest.

Figures

Figure 1
Figure 1
Flowchart diagram describing the steps of filtering data from scientific papers obtained from the systematic literature survey review that used the Web of Science database (1945–April 2021).
Figure 2
Figure 2
(a) Maps and bar plots identifying the geographic distribution of the first author of published articles. (b) Number of works produced by authors from each continent. (c) Bubble chart map indicating the number of substances studied by region. (d) Number of times that substances of botanical origin were studied by authors from each continent.
Figure 3
Figure 3
Scatterplot of number of articles with the chemical group published per year. The circle size is proportional to the number of articles published per year with each class of phytochemicals, and the circle color darkens with the largest overall number of articles published on each phytochemical.
Figure 4
Figure 4
Interaction between the diversity of plant families and insect orders studied from the bibliographic survey of articles on insecticidal phytochemicals. The thickness of the bar and line under each plant family and insect order connecting them corresponds to the relative number of articles dealing with the said insect groups and molecules derived from plant groups; the thicker the bar and line, the larger the number of studies. (Number of papers = 138. However, there are repeated measures, since a paper may contain more than one insect order and/or botanical family; therefore, n = 162).
Figure 5
Figure 5
Interaction between the diversity of insecticidal groups of phytochemicals and the orders of insects tested based on the literature survey. The thickness of the bar and line under each chemical group and insect order connecting them corresponds to the relative number of articles dealing with the said insect groups and chemical groups; the thicker the bar and line, the larger the number of studies. (Number of papers = 138. However, there are repeated measures, since a paper may contain more than one insect order and/or chemical groups; therefore, n = 284).
Figure 6
Figure 6
Types of exposure route present in the experiments of the analyzed articles. (Number of papers = 138; however, there are repeated measures, since a paper may contain more than one exposure route or substances. Therefore, n = 178 and n = 1121 for (a) and (b), respectively).
Figure 7
Figure 7
Forest plot summarizing the binary meta-analysis evaluating the existence or not of sublethal assessment in articles on the insecticidal activity of phytochemicals. The meta-analysis is divided into phytochemical groups and insect orders (subgroups). The proportion is denoted by colored boxes and the 95% CIs are the horizontal lines. The overall trends are represented by a colored diamond, where the diamond width corresponds to 95% CI bounds. The vertical dashed line shows the overall estimated effect resulting from all studies. The p-values for the heterogeneity test are indicated (number of papers = 138).
Figure 8
Figure 8
Forest plot summarizing the quantitative meta-analysis comparing the LC50s, as toxicity endpoints, in papers assessing the insecticidal activity of phytochemicals. The meta-analysis is divided into modes of exposure and phytochemical group. Concentrations (ppm) were transformed by natural logarithm. The average LC50s are denoted by boxes (horizontal lines), and the box size refers to the number of populations reported for the phytochemical group; the 95% CIs are represented by horizontal lines. The combined LC50 estimate for overall trends is represented by a diamond, where the diamond width corresponds to 95% CI bounds. The vertical dashed line shows the overall estimated effect resulting from all species. The p-values for the heterogeneity test are indicated (number of papers = 84).
Figure 9
Figure 9
Forest plot summarizing the quantitative meta-analysis comparing the LD50s, as toxicity endpoints, in papers assessing the insecticidal activity of phytochemicals. The meta-analysis is divided into modes of exposure and phytochemical group. Doses (ppm) were transformed by natural logarithm. The average LD50s are denoted by boxes (horizontal lines), and the box size refers to the number of populations reported for the phytochemical group; the 95% CIs are represented by horizontal lines. The combined LD50 estimates for overall trends is represented by a diamond, where the diamond width corresponds to 95% CI bounds. The vertical dashed line shows the overall estimated effect resulting from all species. The p-values for the heterogeneity test are indicated (number of papers = 12).

References

    1. Hairston N.G., Smith F.E., Slobodkin L.B. Community Structure, Population Control, and Competition. Am. Nat. 1960;94:421–425. doi: 10.1086/282146. - DOI
    1. Murdoch W.W. Community Structure, Population Control, and Competition-A Critique. Am. Nat. 1966;100:219–226. doi: 10.1086/282415. - DOI
    1. Power M.E. Top-Down and Bottom-Up Forces in Food Webs: Do Plants Have. Ecology. 1992;73:733–746. doi: 10.2307/1940153. - DOI
    1. Wilkinson D.M., Sherratt T.N. Why Is the World Green? The Interactions of Top–down and Bottom–up Processes in Terrestrial Vegetation Ecology. Plant Ecol. Divers. 2016;9:127–140. doi: 10.1080/17550874.2016.1178353. - DOI
    1. Sharma G., Malthankar P.A., Mathur V. Insect-Plant Interactions: A Multilayered Relationship. Ann. Entomol. Soc. Am. 2021;114:1–16. doi: 10.1093/aesa/saaa032. - DOI