. 2023 Jan 15;12(2):401.
doi: 10.3390/plants12020401.

Protein Changes in Shade and Sun Haberlea rhodopensis Leaves during Dehydration at Optimal and Low Temperatures

Affiliations

Protein Changes in Shade and Sun Haberlea rhodopensis Leaves during Dehydration at Optimal and Low Temperatures

Gergana Mihailova et al. Plants (Basel). .

Abstract

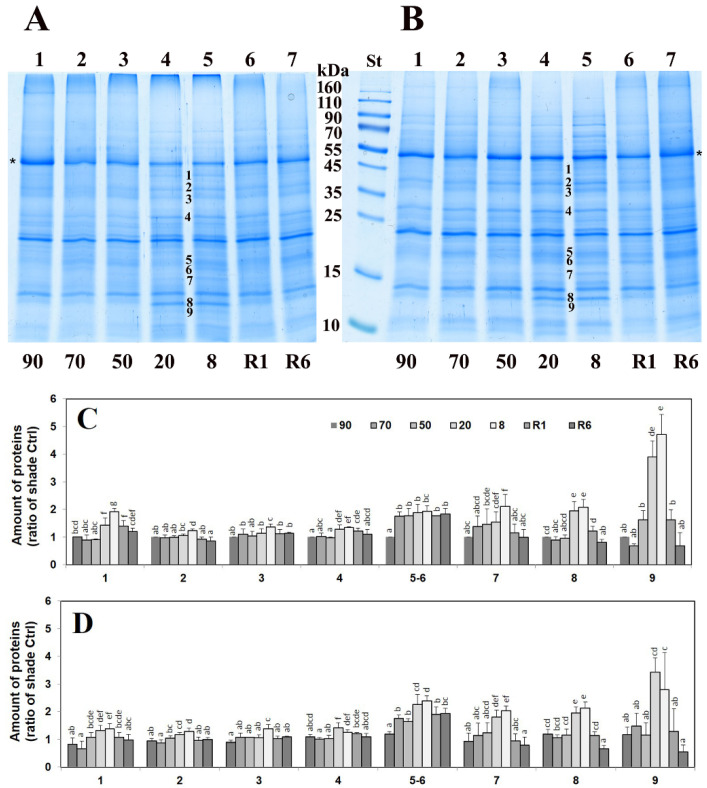
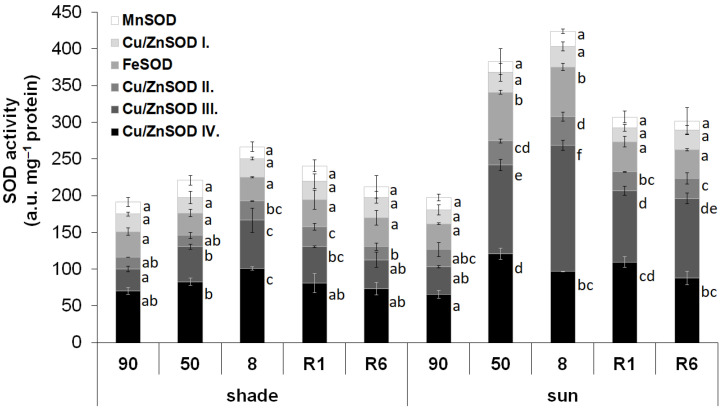
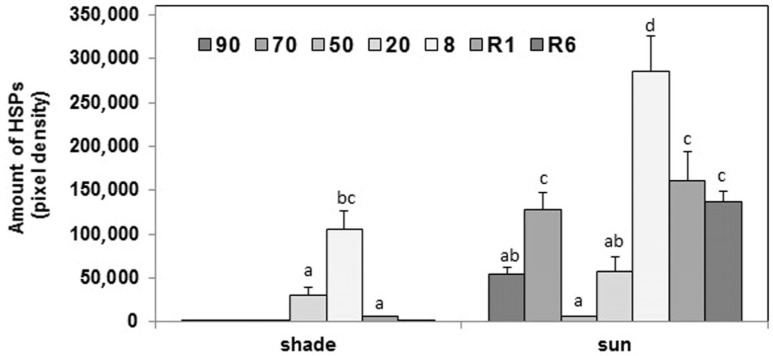
Haberlea rhodopensis is a unique resurrection plant of high phenotypic plasticity, colonizing both shady habitats and sun-exposed rock clefts. H. rhodopensis also survives freezing winter temperatures in temperate climates. Although survival in conditions of desiccation and survival in conditions of frost share high morphological and physiological similarities, proteomic changes lying behind these mechanisms are hardly studied. Thus, we aimed to reveal ecotype-level and temperature-dependent variations in the protective mechanisms by applying both targeted and untargeted proteomic approaches. Drought-induced desiccation enhanced superoxide dismutase (SOD) activity, but FeSOD and Cu/ZnSOD-III were significantly better triggered in sun plants. Desiccation resulted in the accumulation of enzymes involved in carbohydrate/phenylpropanoid metabolism (enolase, triosephosphate isomerase, UDP-D-apiose/UDP-D-xylose synthase 2, 81E8-like cytochrome P450 monooxygenase) and protective proteins such as vicinal oxygen chelate metalloenzyme superfamily and early light-induced proteins, dehydrins, and small heat shock proteins, the latter two typically being found in the latest phases of dehydration and being more pronounced in sun plants. Although low temperature and drought stress-induced desiccation trigger similar responses, the natural variation of these responses in shade and sun plants calls for attention to the pre-conditioning/priming effects that have high importance both in the desiccation responses and successful stress recovery.

Keywords: LC-MS/MS; drought stress; frost-induced desiccation; proteomics; resurrection plants.


Conflict of interest statement

The authors declare no conflict of interest.

Figures

Figure 1
Figure 1
SDS PAGE pattern of total leaf polypeptides in H. rhodopensis shade (A) and sun (B) control plants (90% RWC), during dehydration (70, 50, 20, and 8% RWC) and after rehydration (1 and 6 days of rehydration; R1, RWC 50%, and R6, RWC 90%, respectively). (A,B) Coomassie Brilliant Blue-stained polypeptide patterns of controls (lanes 1), dehydrated leaves (lanes 2–5), and rehydrated ones (lanes 6 and 7). Approx. 10 μg protein was applied per lane. St: Fermentas Page Ruler Prestained Protein SM0671 (Thermo Fisher Scientific, Waltham, MA, USA) standards. (C,D) Changes in the amount of the elevating leaf polypeptides numbered in (A,B) (1–9) in shade (C) and sun (D) ecotypes of H. rhodopensis. The relative protein amounts (pixel density of the protein bands; arbitrary unit) of numbered bands were expressed as the percentage of summa pixel density of lanes; for better comparison, values of each protein were normalized so that control samples of shade ecotype (90% RWC) were chosen as 1. Values are given as mean ± SD (n = 3). Changes between shade and sun plants were statistically compared. Different letters within a graph indicate significant differences assessed by the Fisher LSD test (p ≤ 0.05) after performing multifactor ANOVA. Asterisks (*) on (A,B) show the position of Rubisco large subunit on the gels.
Figure 2
Figure 2
Stacked column plot of the activity of superoxide dismutase (SOD) isoenzymes in the leaves of shade and sun H. rhodopensis plants. Total SOD activity (represented by the total height of the columns) is divided into the activity of SOD isoenzymes based on native polyacrylamide gel electrophoresis. Activities were measured in controls (90% RWC) and during the stages of dehydration (50 and 8% RWC) and rehydration (1 and 6 days of rehydration; R1 and R6, respectively). To compare the differences within the corresponding isoenzyme activities, one-way ANOVAs were performed with Tukey–Kramer post hoc test on the SOD isoenzymes (p < 0.05; n = 5).
Figure 3
Figure 3
Changes in the leaf polypeptide patterns and in the density of dehydrin bands of H. rhodopensis shade (lanes 2–5) and sun plants (lanes 7–10) under drought stress. Polypeptide patterns of control (lanes 2, 4, 7, and 9, RWC 80–90%) and dried leaves (lanes 3, 5, 8, and 10, RWC 8%) either stained (lanes 2, 3, 7, and 8) or blotted against dehydrin (lanes 4 and 5) and sHSPs (lanes 9 and 10). Bands of increased intensity under the stress are numbered next to the Western blots. Lanes 1, 6, and 11: Fermentas Page Ruler Prestained Protein SM0671 (Thermo Fisher Scientific, Waltham, MA, USA) standards.
Figure 4
Figure 4
Changes in the density of leaf dehydrin bands 0 (A), 1 (B), and 5 (C) in the shade and sun H. rhodopensis plants in controls (90%), during dehydration (70, 50, 20, and 8% RWC) and after rehydration (1 and 6 days of rehydration; R1 and R6, respectively). Amounts of dehydrins were determined by Western blotting and normalized to the same total stained protein values in the lanes. For better comparison of the kinetics of changes in a given polypeptide in the shade and sun leaves, shade control values were chosen as 1. Values are given as mean ± SD (n = 4). Changes between shade and sun plants were statistically compared. Different letters within a graph indicate significant differences assessed by the Fisher LSD test (p ≤ 0.05) after performing multifactor ANOVA.
Figure 5
Figure 5
Changes in the relative amounts of total sHSPs in leaves of shade and sun H. rhodopensis plants during dehydration and rehydration. The relative amounts of the sHSP bands were determined based on Western blotting and normalized to the same total stained protein values in the lanes. Values are given as mean ± SD (n = 3). Changes between shade and sun plants were statistically compared. Different letters within a graph indicate significant differences assessed by the Fisher LSD test (p ≤ 0.05) after performing multifactor ANOVA.

Similar articles

Cited by

References

    1. Farrant J.M., Brandt W., Lindsey G. An overview of mechanisms of desiccation tolerance in selected angiosperm resurrection plants. Plant Stress. 2007;1:72–84. doi: 10.1002/9780470376881.ch3. - DOI
    1. Rakić T., Lazarević M., Jovanović Ž.S., Radović S., Siljak-Yakovlev S., Stevanović B., Stevanović V. Resurrection plants of the genus Ramonda: Prospective survival strategies-unlock further capacity of adaptation, or embark on the path of evolution? Front. Plant Sci. 2014;4:550. doi: 10.3389/fpls.2013.00550. - DOI - PMC - PubMed
    1. Georgieva K., Dagnon S., Gesheva E., Bojilov D., Mihailova G., Doncheva S. Antioxidant defense during desiccation of the resurrection plant Haberlea rhodopensis. Plant Physiol. Biochem. 2017;114:51–59. doi: 10.1016/j.plaphy.2017.02.021. - DOI - PubMed
    1. Gashi B., Babani F., Kongjika E. Chlorophyll fluorescence imaging of photosynthetic activity and pigment contents of the resurrection plants Ramonda serbica and Ramonda nathaliae during dehydration and rehydration. Physiol. Mol. Biol. Plants. 2013;19:333–341. doi: 10.1007/s12298-013-0175-5. - DOI - PMC - PubMed
    1. Fernández-Marín B., Nadal M., Gago J., Fernie A.R., López-Pozo M., Artetxe U., García-Plazaola J.I., Verhoeven A. Born to revive: Molecular and physiological mechanisms of double tolerance in a paleotropical and resurrection plant. New Phytol. 2020;226:741–759. doi: 10.1111/nph.16464. - DOI - PubMed

LinkOut - more resources