. 2023 Jan 13;23(2):939.
doi: 10.3390/s23020939.

Vocal Tract Resonance Detection at Low Frequencies: Improving Physical and Transducer Configurations

Affiliations

Vocal Tract Resonance Detection at Low Frequencies: Improving Physical and Transducer Configurations

Jithin Thilakan et al. Sensors (Basel). .

Abstract

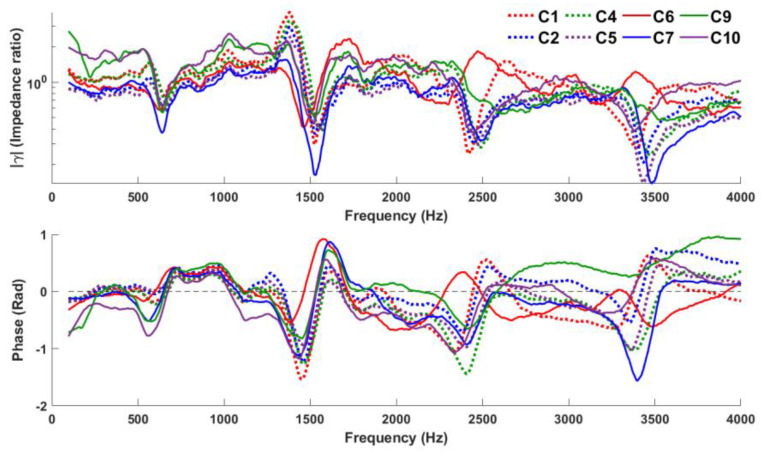
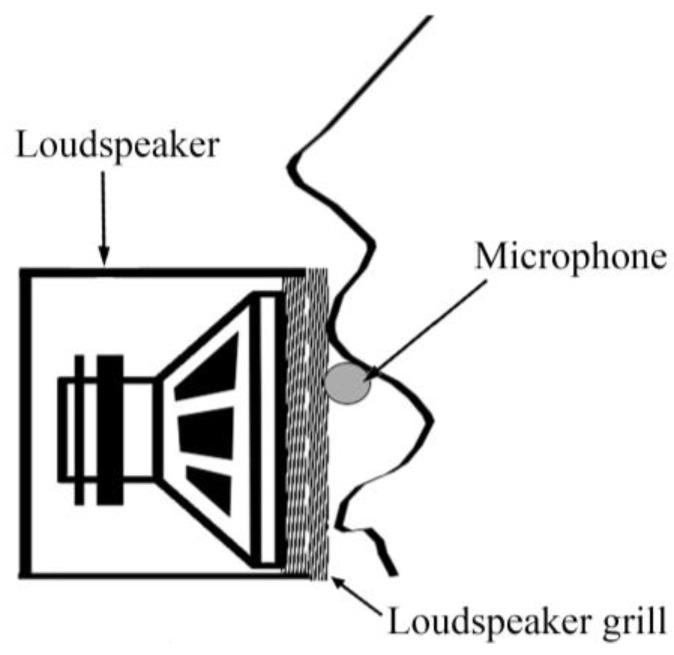
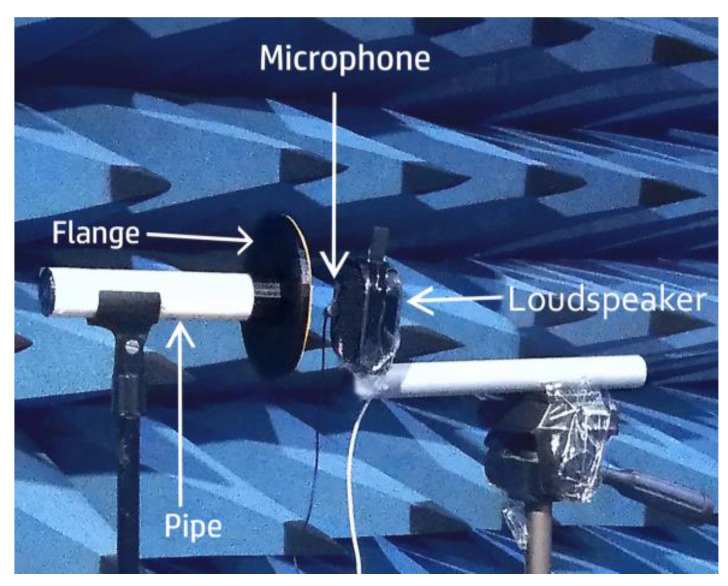
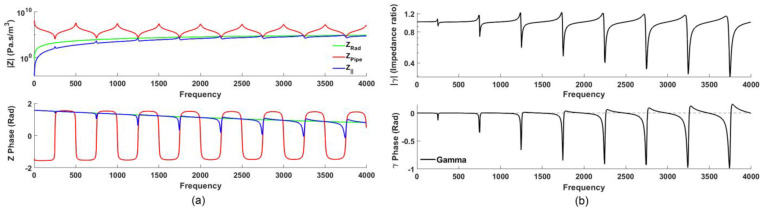
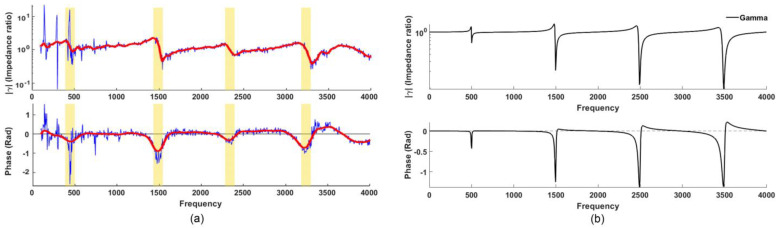
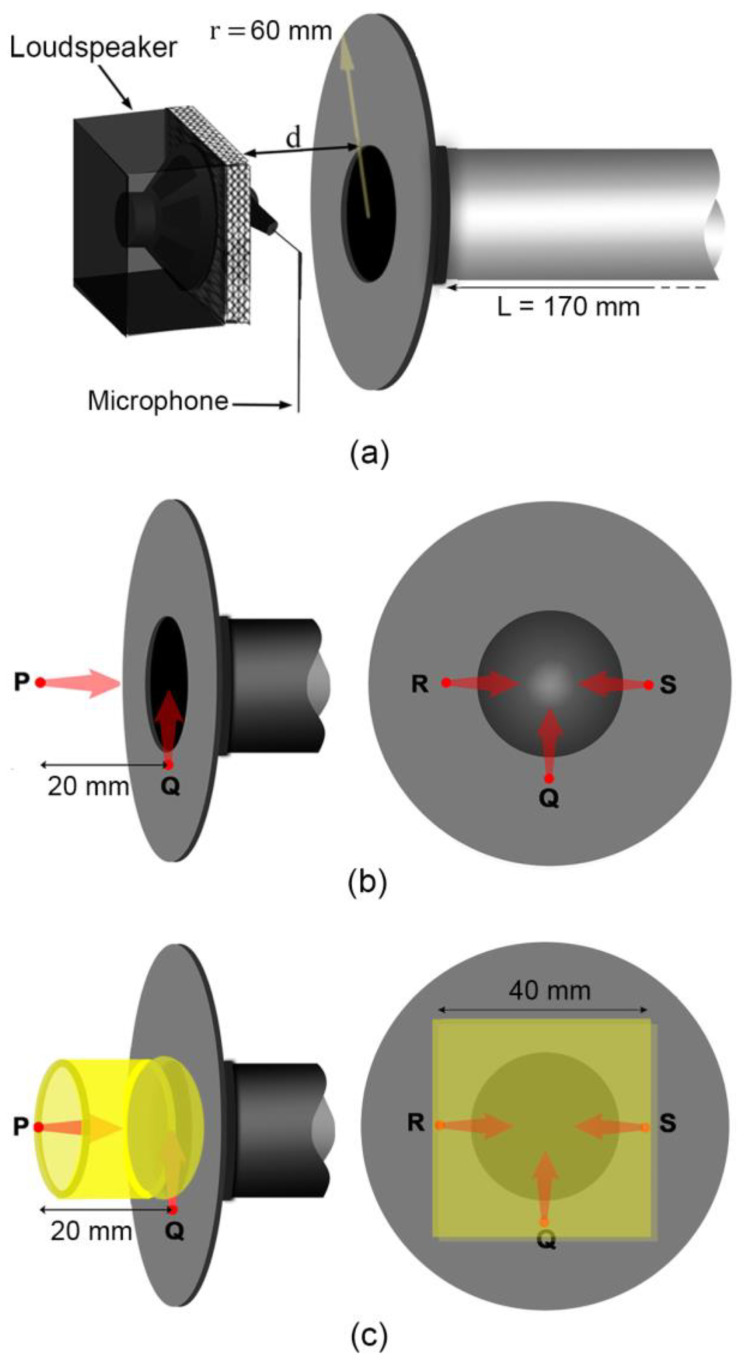
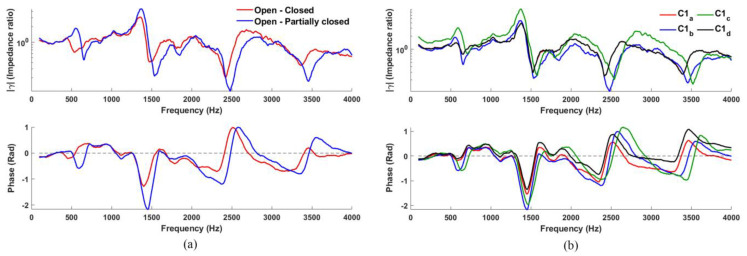
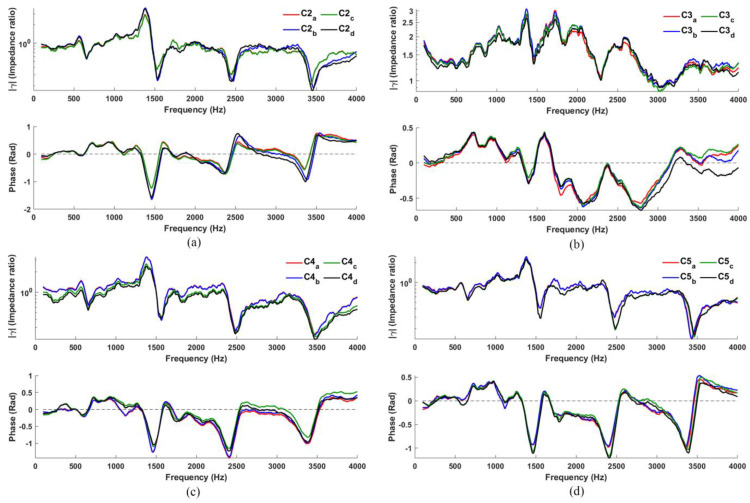
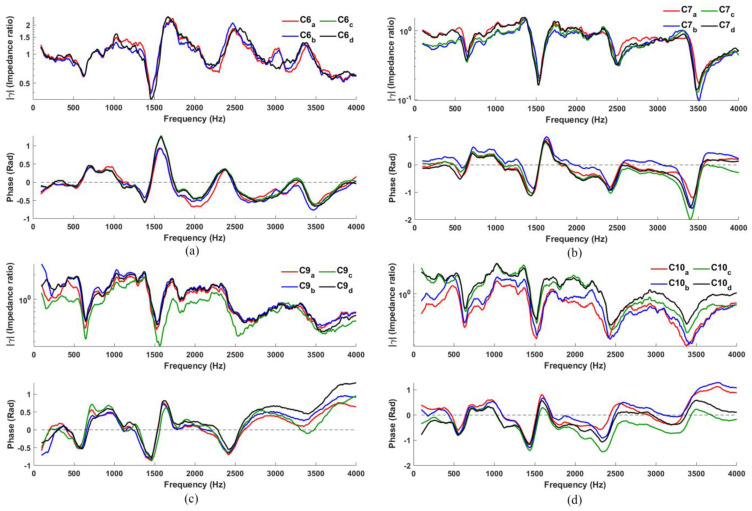
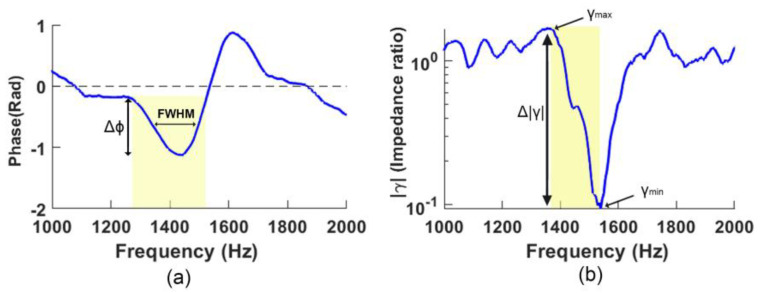
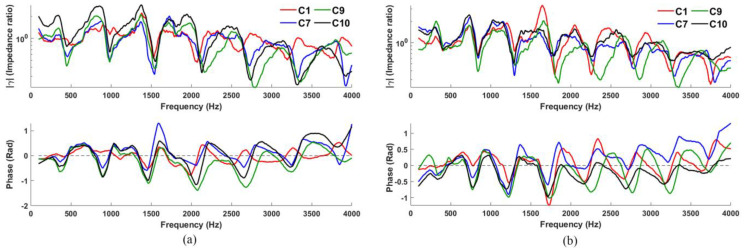
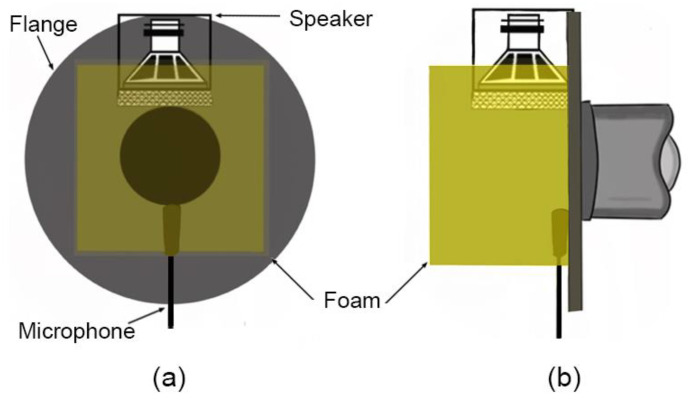
Broadband excitation introduced at the speaker's lips and the evaluation of its corresponding relative acoustic impedance spectrum allow for fast, accurate and non-invasive estimations of vocal tract resonances during speech and singing. However, due to radiation impedance interactions at the lips at low frequencies, it is challenging to make reliable measurements of resonances lower than 500 Hz due to poor signal to noise ratios, limiting investigations of the first vocal tract resonance using such a method. In this paper, various physical configurations which may optimize the acoustic coupling between transducers and the vocal tract are investigated and the practical arrangement which yields the optimal vocal tract resonance detection sensitivity at low frequencies is identified. To support the investigation, two quantitative analysis methods are proposed to facilitate comparison of the sensitivity and quality of resonances identified. Accordingly, the optimal configuration identified has better acoustic coupling and low-frequency response compared with existing arrangements and is shown to reliably detect resonances down to 350 Hz (and possibly lower), thereby allowing the first resonance of a wide range of vowel articulations to be estimated with confidence.

Keywords: acoustic impedance; acoustic transducer; vocal tract resonance.


Conflict of interest statement

The authors declare no conflict of interest.

Figures

Figure 7
Figure 7
Comparison of eight configurations (C1 to C10, excluding C3 and C8).
Figure A1
Figure A1
Schematic showing the microphone and loudspeaker configuration during a human subject measurement.
Figure A2
Figure A2
Schematic of the experimental setup.
Figure 1
Figure 1
(a) Impedance (analytical model) for a theoretical baffled open-closed cylinder with a length of 340 mm and a radius of 13 mm: magnitude (upper), and phase (lower) spectra plotted for open-close ZPipe (red), ZRad (green) and Z|| (blue); (b) γ (ratio of Z|| to ZRad) spectrum (black), magnitude (upper) and phase (lower). The “notches” (magnitude) and “dips” (phase) indicate resonances in ZPipe [9].
Figure 2
Figure 2
(a) Experimental γ(f) measured while phonating the neutral vowel /ə/ (in the target word “herd”), magnitude (above), and phase (below). Blue line shows the raw measurement, while the red line shows the smoothed with Savitsky–Golay algorithm [14] and interpolated spectra (having removed harmonics of the voice), revealing vocal tract resonances as “notches” (magnitude spectrum) and “dips” (phase spectrum), indicated by yellow vertical bands; (b) corresponding analytical γ(f) spectra modeled for an ideal baffled open-closed cylinder with a length of 170 mm; the “notches” and “dips” correspond closely in frequency and general structure with the experimental spectra in (a).
Figure 3
Figure 3
(a) Schematic showing default configuration of loudspeaker and microphone used to make gamma measurements (C1); (b) P, Q, R, and S indicate the locations and orientations of the loudspeaker and microphone in C1 to C5; (c) for C6 to C10, similar P, Q, R and S, but now with acoustic foam applied (indicated in yellow): C6, C7, and C8 utilize a hollow cylindrical foam (left) while C9 and C10 have a foam ‘cap’ filling in the space between the transducers and flange (right).
Figure 4
Figure 4
(a) Measurement of configuration 1 for “glottis” completely and partially closed; (b) four typical γ(f) measurements made on a 170 mm pipe using configuration 1, magnitude above and phase below; resonances are indicated in both magnitude and phase plots at approximately 590, 1450, 2370, and 3350 Hz with less than 2% disagreement.
Figure 5
Figure 5
Typical γ(f) measured using configuration: (a) C2; (b) C3; (c) C4; (d) C5.
Figure 6
Figure 6
Typical γ(f) measured using configuration: (a) C6; (b) C7; (c) C9; (d) C10.
Figure 8
Figure 8
Example of quantifying a resonance based on the R2 from measurement C7 in Figure 7: (a) PQV = Δϕ /FWHM; (b) GMMR = γ Local Maximum/γ Local Minimum.
Figure 9
Figure 9
Comparison between C1, C7, C9, and C10 for a pipe length of (a) 283 and (b) 340 mm.
Figure 10
Figure 10
Schematic of configuration 9: (a) plane view; (b) side view.

References

    1. Epps J., Smith J.R., Wolfe J. A novel instrument to measure acoustic resonances of the vocal tract during phonation. Meas. Sci. Technol. 1997;8:1112–1121. doi: 10.1088/0957-0233/8/10/012. - DOI
    1. Joliveau E., Smith J., Wolfe J. Vocal tract resonances in singing: The soprano voice. J. Acoust. Soc. Am. 2004;116:2434–2439. doi: 10.1121/1.1791717. - DOI - PubMed
    1. Garnier M., Henrich N., Smith J., Wolfe J. Vocal tract adjustments in the high soprano range. J. Acoust. Soc. Am. 2010;127:3771–3780. doi: 10.1121/1.3419907. - DOI - PubMed
    1. Donaldson T., Wang D., Smith J., Wolfe J. Vocal tract resonances: A preliminary study of sex differences for young Australians. Acoust. Aust. 2003;31:95–98.
    1. Swerdlin Y., Smith J., Wolfe J. The effect of whisper and creak vocal mechanisms on vocal tract resonances. J. Acoust. Soc. Am. 2010;127:2590–2598. doi: 10.1121/1.3316288. - DOI - PubMed

LinkOut - more resources