. 2022 Dec 21;15(1):31.
doi: 10.3390/v15010031.

Cis-Allosteric Regulation of HIV-1 Reverse Transcriptase by Integrase

Affiliations

Cis-Allosteric Regulation of HIV-1 Reverse Transcriptase by Integrase

Takao Masuda et al. Viruses. .

Abstract

Reverse transcriptase (RT) and integrase (IN) are encoded tandemly in the pol genes of retroviruses. We reported recently that HIV-1 RT and IN need to be supplied as the pol precursor intermediates, in which RT and IN are in fusion form (RTIN) to exert efficient reverse transcription in the context of HIV-1 replication. The mechanism underlying RTIN's effect, however, remains to be elucidated. In this study, we examined the effect of IN fusion on RT during reverse transcription by an in vitro cell-free assay, using recombinant HIV-1 RTIN (rRTIN). We found that, compared to recombinant RT (rRT), rRTIN generated significantly higher cDNAs under physiological concentrations of dNTPs (less than 10 μM), suggesting increased affinity of RTIN to dNTPs. Importantly, the cleavage of RTIN with HIV-1 protease reduced cDNA levels at a low dose of dNTPs. Similarly, sensitivities against RT inhibitors were significantly altered in RTIN form. Finally, analysis of molecular dynamics simulations of RT and RTIN suggested that IN can influence the structural dynamics of the RT active center and the inhibitor binding pockets in cis. Thus, we demonstrated, for the first time, the cis-allosteric regulatory roles of IN in RT structure and enzymatic activity.

Keywords: HIV-1; deoxyribonucleoside triphosphates; integrase; integration; molecular dynamics; pol; protease; reverse transcriptase.


Conflict of interest statement

The authors declare no conflict of interest.

Figures

Figure 1
Figure 1
Preparation of recombinant HIV-1 RTIN protein. (a) (His)6-tagged form of HIV-1 RTIN was expressed in E. coli Rosetta (DE3) by incubation with 0.1 mM IPTG for 20 hrs at 18 °C. (His)6-tagged RTIN in the soluble fraction was purified through a Ni-affinity column. The (His)6-tag was then removed by treatment with HRV3C protease followed by glutathione-sepharose column chromatography to remove the HRV3C. The flow-through fraction was then subjected to cation exchange chromatography. Fractions eluted by 1×SP buffer [20 mM HEPES-NaOH (pH 7.0), 0.1 mM EDTA, 0.01% TritonX-100, 10% glycerol, and 1 mM DTT] containing 250–500 mM NaCl were pooled. The purified recombinant RTIN (rRTIN) was concentrated through a concentrator spin column with a filtration cutoff of 50 kDa (MCW50) and stored in 1×SP buffer containing 300 mM NaCl at −80 °C. (b). Purified rRTIN with (+) or without (−) HIV-1 protease treatment was subjected to Western blot analysis using an anti-RT (left) or anti-IN (right) antibody.
Figure 2
Figure 2
In vitro RT assay using rRTIN. (a) rRTIN was subjected to in vitro reverse transcription assay as described previously [22]. cDNAs of minus strong stop (−sscDNA), strand-transfer of -sscDNA (1st strand-transfer) products, and plus strong stop (+sscDNA), generated by RNA-dependent DNA polymerase (RDDP), RNase H and DNA-dependent DNA polymerase (DDDP) activities, are schematically depicted. (b). At 30, 60, or 120 min after reaction, the levels of cDNA intermediates were determined by using the primer set for the R/u5, U3/u5, or U3/pbs region to monitor RDDP, RNaseH and DDDP activities. Each value shown is a copy number of a cDNA in 1 μL of the reaction mixture at each time point.
Figure 3
Figure 3
Impact of IN fusion on affinity of RT with vRNA. (a) An in vitro reverse transcription assay was performed in the presence of different doses of vRNA (0.1, 1, 10, 100 ng). The R/u5 copy number generated during 60 min incubation was measured and the value at each dose was plotted as a relative velocity to the reaction of rRTIN with 100 ng of vRNA as 1.0. The value at each vRNA dose is shown as means ± SD (n = 3). (b) Km for vRNA was estimated by calculating velocity at vRNA (100 ng/reaction) as the maximum velocity in the assay condition. Student’s t analysis showed no significant differences between RTIN and RTp66 (ns, p > 0.05). (c) The efficiency of the 1st strand-transfer was determined by calculating the relative (%) amount of the U3/u5 to that of each R/u5 product (% of [U3/u5]/[R/u5]) in the reaction with 100 ng vRNA). d. The efficiency of the +sscDNA synthesis was determined by calculating the relative (%) amount of the U3/pbs to that of each U3/u5 product (% of [U3/pbs]/[U3/u5]) in the reaction with 100 ng vRNA. (c,d) Student’s t analysis showed no significant differences (ns) between RTIN and RTp66 (n = 3, p > 0.05).
Figure 4
Figure 4
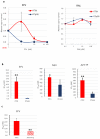
Impact of IN fusion on affinity of RT to dNTPs. (a) A reaction was performed in the presence of different doses of dNTPs (0.1, 1, 10, 100 μM) with a fixed vRNA dose (100 ng/reaction) and RTIN or RTs. The R/u5 copy number generated during 60 min incubation was measured, and the value at each dose was plotted as a velocity relative to the reaction with 100 μM of dNTPs as 1.0. The value at each dNTP dose is shown as means ± SD (n = 3). (b) The Km for dNTPs was estimated by calculating velocity at 100 μM dNTPs as the maximum velocity in the assay condition. The Km value of each protein is indicated on the top of each bar. Student’s t analysis showed significant differences between RTIN and either RTp66 or RTp66/p51 (** p > 0.01, n = 4). (c) Effect of protease cleavage of RTIN. rRTIN with or without digestion with HIV-1 protease was subjected to reaction, and data are plotted as described for a. (d) The Km for dNTPs was estimated by calculating velocity at 100 μM dNTPs as the maximum of velocity in the assay condition. The Km value of each protein is indicated on the top of each bar. Student’s t analysis showed significant differences between rRTIN with and without protease treatment (** p > 0.01, n = 4).
Figure 5
Figure 5
Effect of IN fusion on sensitivity to RT inhibitors. (a) An in vitro reverse transcription assay was performed in the presence of different concentrations of efavirenz (EFV) or raltegravir (RAL). Levels of R/u5 products were measured and are shown as values relative to the level with solvent (DMSO) only as 1.0. (b) The effective concentration 50 (EC50) of EFV, nevirapine (NEV), or 3‘-Azido-2′,3‘-dideoxythymidine-5′-triphosphate (AZT-TP) for RTIN or RTp66 was determined by calculating the drug concentration to inhibit 50% of RDDP activity relative to control. Student’s t analysis showed significant differences between rRTIN and RTp66 (** p > 0.01, * p > 0.05, n = 3). (c) The effect of cleavage by HIV-1 protease on the EFV sensitivity of RTIN was examined as described in a. The EC50 of EFV for rRTIN with or without pretreatment with HIV-1 protease is shown. Student’s t analysis showed that rRTIN had significant effect on EC50 by pretreatment with HIV-1 protease (** p > 0.01, n = 3).
Figure 6
Figure 6
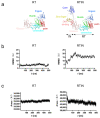
MD simulations of RT and RTIN proteins of the HIV-1NL4-3 clone. The amino acid sequence of the RTIN portion of the Pol region of the HIV-1NL4-3 molecular clone [24] was used to construct an RTIN model by the AlphaFold2 program [23]. The obtained RTIN model gave a per-residue confidence score (pLDDT) of 83.3, in the “Confident” range [23]. An RT model was constructed with the RT domain of the RTIN model by deleting the IN domain using MOE (Chemical Computing Group, Montreal, Quebec, Canada). The RT and RTIN models were subjected to MD simulations using modules in Amber 16 [32] as described previously [28,29,31]. (a) Initial models of RT and RTIN fusion protein before MD simulations. (b) Structural dynamics of RT and RTIN fusion protein during MD simulations. RMSDs between the structure of the initial model and those at given time points of MD simulation were used to monitor the overall structural changes during simulations. (c) Analysis of areas of exposed surfaces of RT and RTIN in solution during MD simulations.
Figure 7
Figure 7
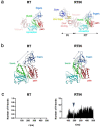
Effects of IN fusion on conformation of RT protein. Structures obtained from the MD simulations in Figure 6 were used to characterize impacts of RTIN fusion on RT. (a) Comparison between overall structures of RT and RTIN fusion protein at 500 ns of MD simulations. (b) Enlarged view of active center of RT in RT and RTIN fusion protein at 500 ns of MD simulations. (c) Numbers of hydrogen bonds formed between the thumb and fingers subdomains of RT during 500 ns of MD simulations. The trajectory files during 500 ns of MD simulations were used to calculate the number of hydrogen bonds between the fingers and thumb subdomains in the RT region using the cpptraj module in AmberTools 16 [32].
Figure 8
Figure 8
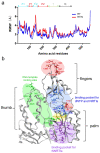
Effects of IN fusion on fluctuations of RT protein. RMSF values, which indicate the atomic fluctuations of the main chains of individual amino acids during MD simulations, were calculated using 50,000 snapshots in the equilibrium states during the last 100 ns of MD simulations using the cpptraj module in AmberTools 16, a trajectory analysis tool [32]. (a) Distributions of RMSF in RT. Numbers on the horizontal axes indicate positions in the mature RT of HIV-1 NL4-3 (GenBank accession no. AAK08484) [24]. P1 and P2, palm subdomain; F1 and F2, fingers subdomain; T, thumb subdomain; C, connection subdomain. (b) Overall view of RT active center. The red shaded areas indicate regions where RMSF increases to above 1.4 Å by IN fusion. Light yellow; YMDD motif of polymerase active center [45,48]. Light blue; region involved in dNTP binding [45]. Light green; region of RNA template binding [45]. Light purple; region of NNRTI resistance [45].

Similar articles

Cited by

References

    1. Hu W.-S., Hughes S.H. HIV-1 Reverse Transcription. Cold Spring Harb. Perspect. Med. 2012;2:a006882. doi: 10.1101/cshperspect.a006882. - DOI - PMC - PubMed
    1. Brown P.O. Integration. In: Coffin J.M., Hughes S.H., Varmus H.E., editors. Retroviruses. Cold Spring Harbor Laboratory Press; Long Island, NY, USA: 1997. pp. 161–203. - PubMed
    1. Stevenson M., Stanwick T., Dempsey M., Lamonica C. HIV-1 replication is controlled at the level of T cell activation and proviral integration. EMBO J. 1990;9:1551–1560. doi: 10.1002/j.1460-2075.1990.tb08274.x. - DOI - PMC - PubMed
    1. Tsurutani N., Kubo M., Maeda Y., Ohashi T., Yamamoto N., Kannagi M., Masuda T. Identification of Critical Amino Acid Residues in Human Immunodeficiency Virus Type 1 IN Required for Efficient Proviral DNA Formation at Steps prior to Integration in Dividing and Nondividing Cells. J. Virol. 2000;74:4795–4806. doi: 10.1128/jvi.74.10.4795-4806.2000. - DOI - PMC - PubMed
    1. Goldstone D.C., Ennis-Adeniran V., Hedden J.J., Groom H.C.T., Rice G.I., Christodoulou E., Walker P.A., Kelly G., Haire L.F., Yap M.W., et al. HIV-1 restriction factor SAMHD1 is a deoxynucleoside triphosphate triphosphohydrolase. Nature. 2011;480:379–382. doi: 10.1038/nature10623. - DOI - PubMed

Publication types

MeSH terms

Substances

LinkOut - more resources