. 2022 Dec 23;15(1):43.
doi: 10.3390/v15010043.

Inactivation of Ebola Virus and SARS-CoV-2 in Cell Culture Supernatants and Cell Pellets by Gamma Irradiation

Affiliations

Inactivation of Ebola Virus and SARS-CoV-2 in Cell Culture Supernatants and Cell Pellets by Gamma Irradiation

RuthMabel Boytz et al. Viruses. .

Abstract

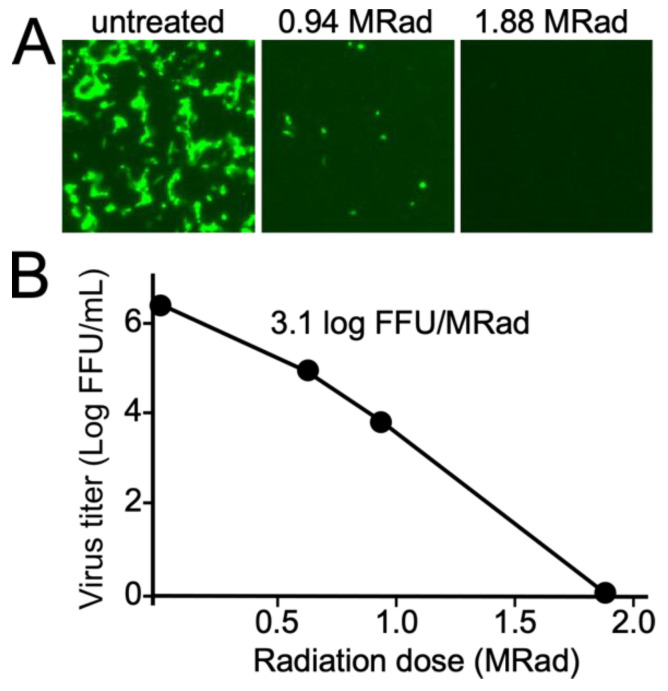
Viral pathogens with the potential to cause widespread disruption to human health and society continue to emerge or re-emerge around the world. Research on such viruses often involves high biocontainment laboratories (BSL3 or BSL4), but the development of diagnostics, vaccines and therapeutics often uses assays that are best performed at lower biocontainment. Reliable inactivation is necessary to allow removal of materials to these spaces and to ensure personnel safety. Here, we validate the use of gamma irradiation to inactivate culture supernatants and pellets of cells infected with a representative member of the Filovirus and Coronavirus families. We show that supernatants and cell pellets containing SARS-CoV-2 are readily inactivated with 1.9 MRad, while Ebola virus requires higher doses of 2.6 MRad for supernatants and 3.8 MRad for pellets. While these doses of radiation inactivate viruses, proinflammatory cytokines that are common markers of virus infection are still detected with low losses. The doses required for virus inactivation of supernatants are in line with previously reported values, but the inactivation of cell pellets has not been previously reported and enables new approaches for analysis of protein-based host responses to infection.

Keywords: Ebola virus; SARS-CoV-2; coronavirus; filovirus; inactivation; radiation treatment; sterilization.


Conflict of interest statement

The authors declare no conflict of interest. The funders had no role in the design of the study; in the collection, analyses, or interpretation of data; in the writing of the manuscript; or in the decision to publish the results.

Figures

Figure 1
Figure 1
Timing and detection of virus spread. Fluorescence and transmitted light images of EBOV and SARS-CoV-2 infected Vero E6 cells on indicated days after infection. Images were taken on the indicated days when green fluorescence or CPE was visible and compared to cells without virus. GFP (EBOV) or mNeonGreen (SARS-CoV-2) signals precede CPE for both viruses. For EBOV, GFP is strongly expressed on day 2. For SARS-CoV-2, the signal was fainter but clearly visible on day 3 together with CPE. For EBOV, CPE appeared later than SARS-CoV-2 being evident on day 7. At top left of brightfield images grading for CPE is given with − = none, + = low and ++ = high CPE. Scale bar is 500 mm with all images taken at the same magnification.
Figure 2
Figure 2
Schematic showing arrangement of tubes in gamma radiator and workflow. (A) Tubes containing virus infected cell lysates or culture supernatants containing virus were sealed in plastic bags containing 10% Microchem Plus and frozen on dry ice. The samples were placed in a cylindrical container which was placed on a rotating platform. Three radiation sources were present to provide even coverage of samples. (B) Schematic showing approach used. After tubes were irradiated with the desired dose, they were returned to the high containment laboratory and added to flasks of fresh cells. These were incubated for 7 days and then passed onto fresh cells or allowed to further incubate for up to 13 days.
Figure 3
Figure 3
Inactivation of SARS-CoV-2 by gamma radiation. Supernatants were collected from the primary culture flasks after 7 days post infection and used to inoculate fresh cells. Images were taken after an additional 7 days. For the 0.9 MRad dose, undiluted samples caused excessive cell death by day 7 and poor image quality. So, an image for culture medium diluted 1/200 is shown for this dose only with other samples being undiluted. Insets are 5× magnification of the parent image. At top left of brightfield images grading for CPE is given with − = none, + = low and ++ = high CPE. Scale bar is 500 mm with all images taken at the same magnification.
Figure 4
Figure 4
Inactivation of EBOV by gamma radiation. Images (bright field and fluorescence) were taken at the indicated times after irradiated material was used to inoculate flasks of fresh Vero cell monolayers and incubated for 13 days or passed onto fresh cells after 7 days as indicated. Both cell pellets and culture supernatants were evaluated for inactivation. Insets show isolated regions where infection was detected and are 5× magnification of the parent image. At top left of brightfield images grading for CPE is given with − = none, + = low and ++ = high CPE. Scale bar is 500 mm with all images taken at the same magnification.
Figure 5
Figure 5
Calculation of radiation dose:log kill relationship for Ebola virus. Samples were treated with the indicated levels of gamma radiation. The amount of viable virus remaining was calculated by titration of samples in 96-well plates. Foci expressing green fluorescent protein were counted and used to calculate the amount of virus in the sample. (A) Representative images of infected cells are shown after 2 d of incubation on Vero cells. (B) Plot of amount of viable virus present vs. radiation dose. The indicated dose:virus kill relationship was determined by fitting a line equation of y = mx + c to the indicated log virus titer vs. radiation dose data in Excel.
Figure 6
Figure 6
Measurement of cytokines after irradiation of medium. (A) A mixture of murine proinflammatory cytokines, produced from interaction of murine Tcon and Treg cells, was used to evaluate impact on cytokine detection (B) The amount of human IL-12p70 and IL-2 remaining in culture medium after irradiation. Samples were dosed at 1.9 (Dose 1) or 2.6 MRad (Dose 2). Amounts of the indicated cytokines were then measured using cytometric bead array assays. Replicates are indicated together with means and standard deviations. Circles are for untreated samples, triangles for 1.9 MRad and squares for 2.6 MRad dosed samples. * p < 0.05, ** p < 0.01, *** p < 0.001, **** p < 0.0001 using Student’s unpaired t-test to compare untreated to treated samples.

Similar articles

Cited by

References

    1. Jones K.E., Patel N.G., Levy M.A., Storeygard A., Balk D., Gittleman J.L., Daszak P. Global Trends in Emerging Infectious Diseases. Nature. 2008;451:990–993. doi: 10.1038/nature06536. - DOI - PMC - PubMed
    1. Morens D.M., Fauci A.S. Emerging Pandemic Diseases: How We Got to COVID-19. Cell. 2020;182:1077–1092. doi: 10.1016/j.cell.2020.08.021. - DOI - PMC - PubMed
    1. Capua I., Alexander D.J. Avian Influenza and Human Health. Acta Trop. 2002;83:1–6. doi: 10.1016/S0001-706X(02)00050-5. - DOI - PubMed
    1. Peters C.J. Emerging Infections: Lessons from the Viral Hemorrhagic Fevers. Trans. Am. Clin. Climatol. Assoc. 2006;117:189–196; discussion 196–197. - PMC - PubMed
    1. Lu R., Zhao X., Li J., Niu P., Yang B., Wu H., Wang W., Song H., Huang B., Zhu N., et al. Genomic Characterisation and Epidemiology of 2019 Novel Coronavirus: Implications for Virus Origins and Receptor Binding. Lancet Lond. Engl. 2020;395:565–574. doi: 10.1016/S0140-6736(20)30251-8. - DOI - PMC - PubMed

Publication types