

Insights into HIV-1 Transmission Dynamics Using Routinely Collected Data in the Mid-Atlantic United States
- PMID: 36680108
- PMCID: PMC9863702
- DOI: 10.3390/v15010068
Insights into HIV-1 Transmission Dynamics Using Routinely Collected Data in the Mid-Atlantic United States
Abstract
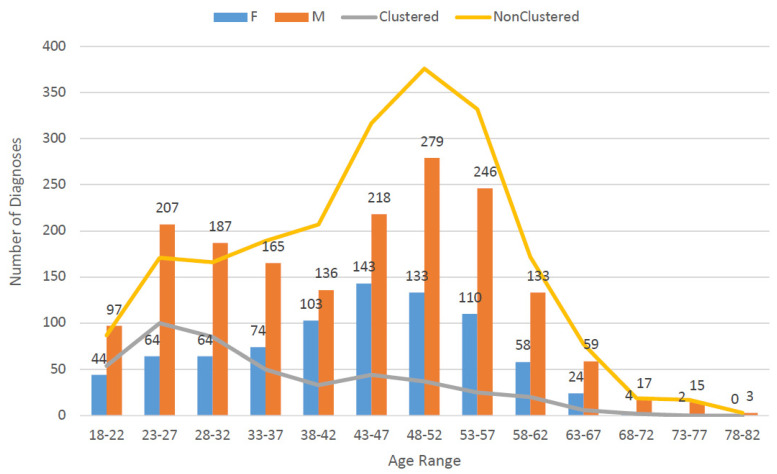
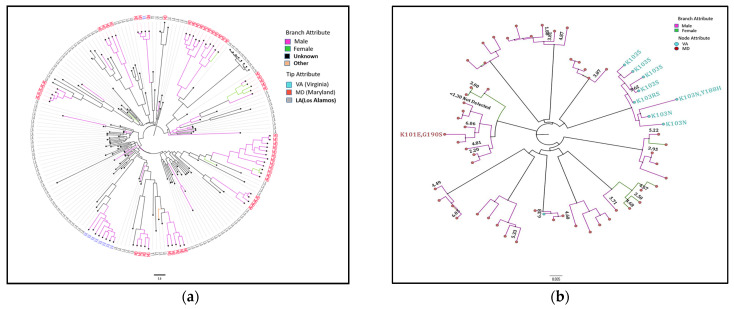
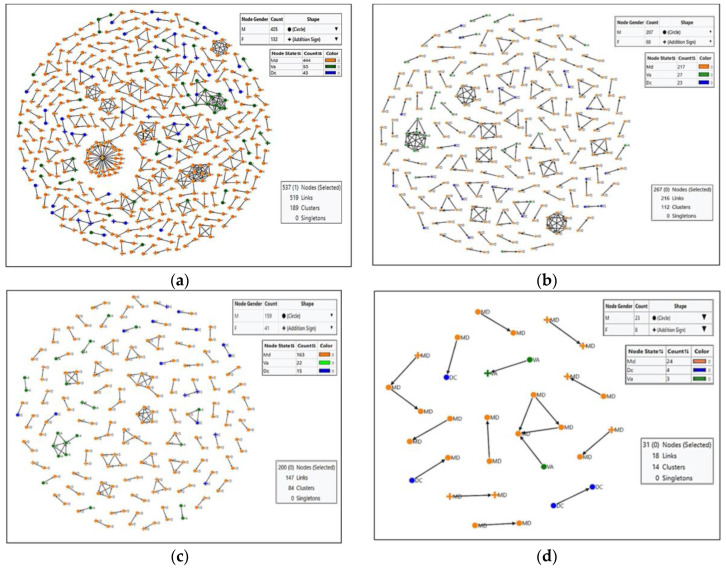
Background: Molecular epidemiological approaches provide opportunities to characterize HIV transmission dynamics. We analyzed HIV sequences and virus load (VL) results obtained during routine clinical care, and individual’s zip-code location to determine utility of this approach. Methods: HIV-1 pol sequences aligned using ClustalW were subtyped using REGA. A maximum likelihood (ML) tree was generated using IQTree. Transmission clusters with ≤3% genetic distance (GD) and ≥90% bootstrap support were identified using ClusterPicker. We conducted Bayesian analysis using BEAST to confirm transmission clusters. The proportion of nucleotides with ambiguity ≤0.5% was considered indicative of early infection. Descriptive statistics were applied to characterize clusters and group comparisons were performed using chi-square or t-test. Results: Among 2775 adults with data from 2014−2015, 2589 (93%) had subtype B HIV-1, mean age was 44 years (SD 12.7), 66.4% were male, and 25% had nucleotide ambiguity ≤0.5. There were 456 individuals in 193 clusters: 149 dyads, 32 triads, and 12 groups with ≥ four individuals per cluster. More commonly in clusters were males than females, 349 (76.5%) vs. 107 (23.5%), p < 0.0001; younger individuals, 35.3 years (SD 12.1) vs. 44.7 (SD 12.3), p < 0.0001; and those with early HIV-1 infection by nucleotide ambiguity, 202/456 (44.3%) vs. 442/2133 (20.7%), p < 0.0001. Members of 43/193 (22.3%) of clusters included individuals in different jurisdictions. Clusters ≥ four individuals were similarly found using BEAST. HIV-1 viral load (VL) ≥3.0 log10 c/mL was most common among individuals in clusters ≥ four, 18/21, (85.7%) compared to 137/208 (65.8%) in clusters sized 2−3, and 927/1169 (79.3%) who were not in a cluster (p < 0.0001). Discussion: HIV sequence data obtained for HIV clinical management provide insights into regional transmission dynamics. Our findings demonstrate the additional utility of HIV-1 VL data in combination with phylogenetic inferences as an enhanced contact tracing tool to direct HIV treatment and prevention services. Trans-jurisdictional approaches are needed to optimize efforts to end the HIV epidemic.
Keywords: HIV drug resistance; clinical and phylogenetic data combined; contact tracing tool; molecular epidemiology; phylogenetic analysis; regional transmission dynamics; transmission networks.
Conflict of interest statement
SK: Development of HIV educational materials with Integritas Communications, LLC; WAM and HWK are employees of and own stock in Quest Diagnostics. The other co-authors declare no conflict of interest.
Figures
References
-
- Office of Infectious Disease and HIV/AIDS Policy, HHS About Ending the HIV Epidemic in the U.S.: Priority Jurisdictions: Phase 1; Date Last Updated: 3 November 2020. [(accessed on 24 November 2021)]; Available online: https://www.hiv.gov/federal-response/ending-the-hiv-epidemic/jurisdictio....
-
- Centers for Disease Control and Prevention CDC Vital Signs. Ending the HIV Epidemic: HIV Treatment Is Prevention. [(accessed on 10 December 2021)];2019 Available online: https://www.cdc.gov/vitalsigns/end-hiv/pdf/vs-0318-end-hiv-H.pdf.
-
- Donnell D., Baeten J.M., Kiarie J., Thomas K.K., Stevens W., Cohen C.R., McIntyre J., Lingappa J.R., Celum C. Heterosexual HIV-1 transmission after initiation of antiretroviral therapy: A prospective cohort analysis. Lancet Lond Engl. 2010;375:2092–2098. doi: 10.1016/S0140-6736(10)60705-2. - DOI - PMC - PubMed
Publication types
MeSH terms
Grants and funding
LinkOut - more resources
Full Text Sources
Medical
