. 2022 Dec 29;15(1):95.
doi: 10.3390/v15010095.

The Cold-Adapted, Temperature-Sensitive SARS-CoV-2 Strain TS11 Is Attenuated in Syrian Hamsters and a Candidate Attenuated Vaccine

Affiliations

The Cold-Adapted, Temperature-Sensitive SARS-CoV-2 Strain TS11 Is Attenuated in Syrian Hamsters and a Candidate Attenuated Vaccine

Jiayu Xu et al. Viruses. .

Abstract

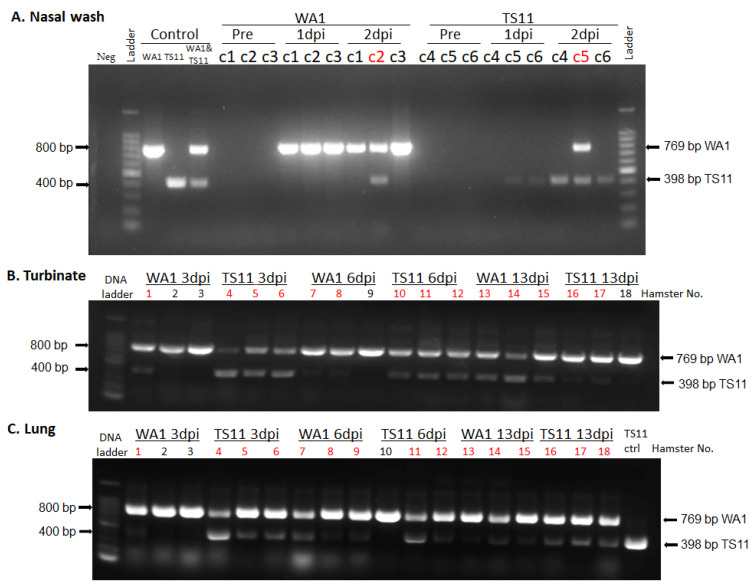
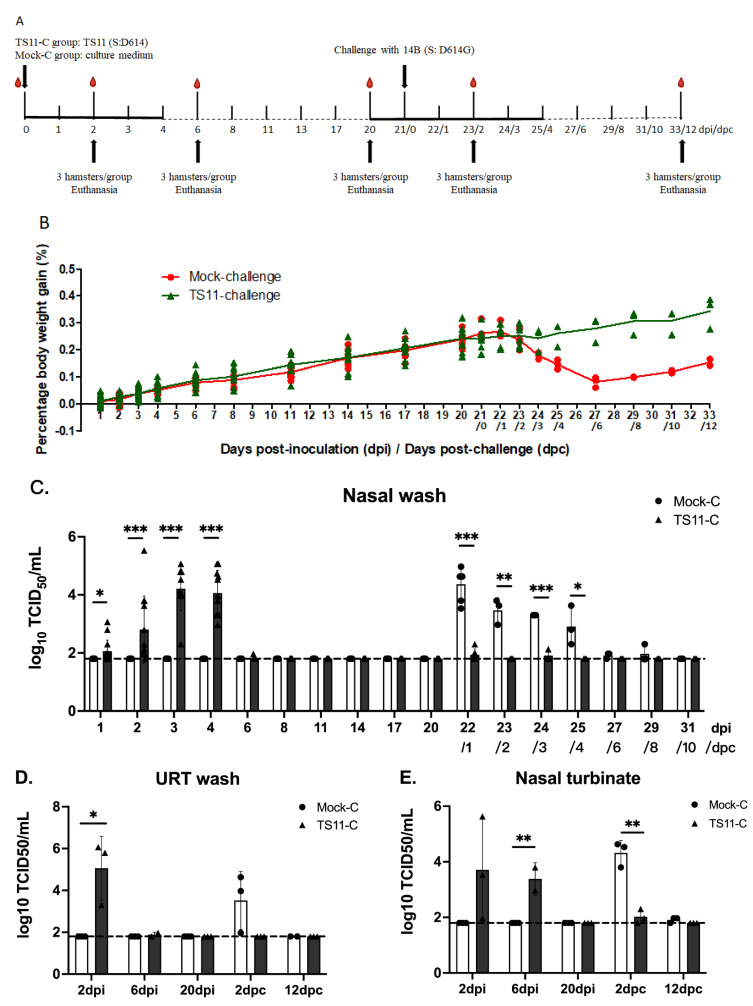
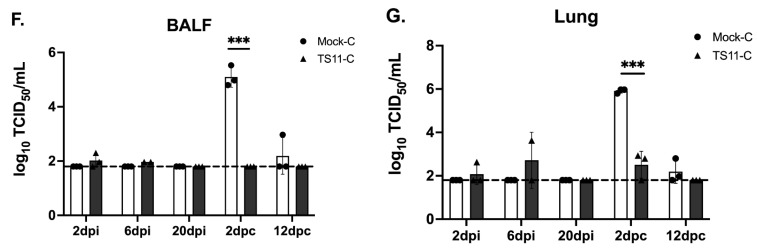
Live attenuated vaccines (LAVs) replicate in the respiratory/oral mucosa, mimic natural infection, and can induce mucosal and systemic immune responses to the full repertoire of SARS-CoV-2 structural/nonstructural proteins. Generally, LAVs produce broader and more durable protection than current COVID-19 vaccines. We generated a temperature-sensitive (TS) SARS-CoV-2 mutant TS11 via cold-adaptation of the WA1 strain in Vero E6 cells. TS11 replicated at >4 Log10-higher titers at 32 °C than at 39 °C. TS11 has multiple mutations, including those in nsp3, a 12-amino acid-deletion spanning the furin cleavage site of the S protein and a 371-nucleotide-deletion spanning the ORF7b-ORF8 genes. We tested the pathogenicity and protective efficacy of TS11 against challenge with a heterologous virulent SARS-CoV-2 D614G strain 14B in Syrian hamsters. Hamsters were randomly assigned to mock immunization-challenge (Mock-C) and TS11 immunization-challenge (TS11-C) groups. Like the mock group, TS11-vaccinated hamsters did not show any clinical signs and continuously gained body weight. TS11 replicated well in the nasal cavity but poorly in the lungs and caused only mild lesions in the lungs. After challenge, hamsters in the Mock-C group lost weight. In contrast, the animals in the TS11-C group continued gaining weight. The virus titers in the nasal turbinates and lungs of the TS11-C group were significantly lower than those in the Mock-C group, confirming the protective effects of TS11 immunization of hamsters. Histopathological examination demonstrated that animals in the Mock-C group had severe pulmonary lesions and large amounts of viral antigens in the lungs post-challenge; however, the TS11-C group had minimal pathological changes and few viral antigen-positive cells. In summary, the TS11 mutant was attenuated and induced protection against disease after a heterologous SARS-CoV-2 challenge in Syrian hamsters.

Keywords: COVID-19; SARS-CoV-2; Syrian hamster; cold-adaptation; coronavirus; temperature-sensitive; vaccine.


Conflict of interest statement

The authors declare no conflict of interest.

Figures

Figure 1
Figure 1
Generation of a cold-adapted/temperature-sensitive SARS-CoV-2-WA1 mutant (TS11). (A) Overview of the passaging history that generated the cold-adapted TS11 strain from SARS-CoV-2 WA1. (B) Representative images of the viral plaques formed by WA1 and TS11 cultured at different temperatures (32 °C, 37 °C and 39 °C): left panel shows plaque appearance by eye, and the right panel shows the plaques observed under a light microscope. (C) The diameter of plaques of WA1 and TS11 cultured at 32 °C, 37 °C and 39 °C. The diameter means of 20 plaques of TS11 and WA1 viruses were compared by Student’s t test (****, p < 0.001; ns, not significant). (D) The efficiency of plating (or plaque forming efficiency) of WA1 and TS11 virus stock at 32 °C, 37 °C and 39 °C.
Figure 2
Figure 2
Characterization of the SARS-CoV-2 TS11 in Vero E6 cells. Multi-step growth kinetics of SARS-CoV-2 WA1 (A) and SARS-CoV-2 TS11 (B) at 32 °C, 37 °C and 39 °C. Vero E6 cells were inoculated with SARS-CoV-2 WA1 and SARS-CoV-2 TS11 at a MOI of 0.01 at 32 °C, 37 °C or 39 °C. Infected cells were harvested at the indicated time points, and virus titers were determined by plaque assays. The ratio of relative viral E subgenomic (+) RNA level at 39 °C:32 °C (C). Vero E6 cells were infected with SARS-CoV-2 WA1 or TS11 at an MOI of 1.0 at 32 °C for 1 h. After removing the virus inoculum and washing cells, the plates were cultured at 32 °C or 39 °C for an additional 7 h. Total RNA was extracted from the infected cells, and the relative levels of SARS-CoV-2 E gene subgenomic (+) RNA were determined by reverse transcription followed by quantitative PCR using actin gene as an internal control. The data are presented as mean ± standard deviation of triplicates. At each time point, data were analyzed by one-way ANOVA followed by Dennett’s test by comparing data of each group with values at 32 °C (*, p < 0.05; **, p < 0.01; ***, p < 0.005; ****, p < 0.001).
Figure 3
Figure 3
SARS-CoV-2 TS11 did not cause disease in Syrian hamsters even during subsequent co-infection with WA1 strain. (A) Schematic procedure for the Syrian hamster study. Two groups of hamsters (n = 9 per group) were intranasally (i.n.) inoculated with 4 × 10⁴ PFU/hamster of SARS-CoV-2 WA1 or SARS-CoV-2 TS11. (B) Body weights were measured daily from 1–7 dpi followed by every two days. Nasal washes were collected daily from 1–7 dpi followed by every two days and infectious viral titers (C) and viral RNA titers (D) were determined by TCID50 assay and RT-qPCR targeting the RdRp gene, respectively. At 3 dpi, 6 dpi, and 13 dpi, 3 hamsters per group were euthanized and the infectious virus titers in the nasal turbinate (E), trachea (F), lung (G), and BALF (H) samples were assessed by the TCID50 assay. The dashed lines in C-H indicate the detection limit. The data were presented as mean ± standard deviations. At each time point, values of the TS11 and WA1 groups were compared by Student’s t test (*, p < 0.05; ns, not significant).
Figure 3
Figure 3
SARS-CoV-2 TS11 did not cause disease in Syrian hamsters even during subsequent co-infection with WA1 strain. (A) Schematic procedure for the Syrian hamster study. Two groups of hamsters (n = 9 per group) were intranasally (i.n.) inoculated with 4 × 10⁴ PFU/hamster of SARS-CoV-2 WA1 or SARS-CoV-2 TS11. (B) Body weights were measured daily from 1–7 dpi followed by every two days. Nasal washes were collected daily from 1–7 dpi followed by every two days and infectious viral titers (C) and viral RNA titers (D) were determined by TCID50 assay and RT-qPCR targeting the RdRp gene, respectively. At 3 dpi, 6 dpi, and 13 dpi, 3 hamsters per group were euthanized and the infectious virus titers in the nasal turbinate (E), trachea (F), lung (G), and BALF (H) samples were assessed by the TCID50 assay. The dashed lines in C-H indicate the detection limit. The data were presented as mean ± standard deviations. At each time point, values of the TS11 and WA1 groups were compared by Student’s t test (*, p < 0.05; ns, not significant).
Figure 4
Figure 4
The detection of TS11 and WA1 viral RNA in the nasal wash (A), nasal turbinate (B) and lung (C) samples of hamsters using the RT-PCR that differentiates between WA1 (769 bp) and TS11 (398 bp). WA1 RNA, TS11 RNA and the 1:1 mixture of WA1 and TS11 RNA based on infectious titers (WA1&TS11) were used as positive controls; water was used as a negative (Neg) control. C1–C6 indicate randomly selected one of the three hamsters in cage #1–cage #6. The red text indicate that the sample was positive for both TS11 and WA1.
Figure 5
Figure 5
SARS-CoV-2 TS11 was attenuated in hamsters and conferred complete protection post challenge with a virulent heterologous D614G strain 14B. (A) Schematic procedure for the Syrian hamster study. Two groups of hamsters (n = 15 per group) were intranasally (i.n.) inoculated with 8 × 10⁴ PFU/hamster of SARS-CoV-2 TS11 (for TS11-Challenge group) or culture medium (for Mock-challenge group). At 21 days post-inoculation (dpi), both groups of hamsters were challenged i.n. with a virulent heterologous D614G strain 14B (3 × 10⁵ TCID50 per hamster). (B) Body weights were measured daily from 1–4 dpi or days post challenge (dpc) followed by every 2–3 days. (C) Nasal washes were collected daily from 1–4 dpi/dpc followed by every 2–3 days and infectious viral titers were determined using Vero E6 cells. At 2 dpi, 6 dpi, 20 dpi, 23 dpi/2 dpc, and 33 dpi/12 dpc, 3 hamsters per group were euthanized. The infectious virus titers in the upper respiratory tract (URT) wash (D), nasal turbinates (E), Bronchoalveolar lavage fluid (BALF) (F), and lungs (G) were assessed by the TCID50 assay. The dashed lines in C g indicate the detection limit. The histopathological changes of lungs were examined after hematoxylin and eosin staining (Arrows indicate lesions) (H) and immunohistochemical (IHC) staining of SARS-CoV-2 N proteins (brown color) (I). Black arrows indicated lesions or positive signals. Original magnification, ×60 (panels in H) or ×100 (panels in I). A typical area was also shown in an amplified box in the top right corner. Serum viral neutralizing (VN) antibody titers were tested using TCID50-reduction assay (J). The data were presented as mean ± standard deviation (SD). At each time point, values of the TS11 and WA1 groups were compared by Student’s t test (*, p < 0.05; **, p < 0.01; ***, p < 0.005).
Figure 5
Figure 5
SARS-CoV-2 TS11 was attenuated in hamsters and conferred complete protection post challenge with a virulent heterologous D614G strain 14B. (A) Schematic procedure for the Syrian hamster study. Two groups of hamsters (n = 15 per group) were intranasally (i.n.) inoculated with 8 × 10⁴ PFU/hamster of SARS-CoV-2 TS11 (for TS11-Challenge group) or culture medium (for Mock-challenge group). At 21 days post-inoculation (dpi), both groups of hamsters were challenged i.n. with a virulent heterologous D614G strain 14B (3 × 10⁵ TCID50 per hamster). (B) Body weights were measured daily from 1–4 dpi or days post challenge (dpc) followed by every 2–3 days. (C) Nasal washes were collected daily from 1–4 dpi/dpc followed by every 2–3 days and infectious viral titers were determined using Vero E6 cells. At 2 dpi, 6 dpi, 20 dpi, 23 dpi/2 dpc, and 33 dpi/12 dpc, 3 hamsters per group were euthanized. The infectious virus titers in the upper respiratory tract (URT) wash (D), nasal turbinates (E), Bronchoalveolar lavage fluid (BALF) (F), and lungs (G) were assessed by the TCID50 assay. The dashed lines in C g indicate the detection limit. The histopathological changes of lungs were examined after hematoxylin and eosin staining (Arrows indicate lesions) (H) and immunohistochemical (IHC) staining of SARS-CoV-2 N proteins (brown color) (I). Black arrows indicated lesions or positive signals. Original magnification, ×60 (panels in H) or ×100 (panels in I). A typical area was also shown in an amplified box in the top right corner. Serum viral neutralizing (VN) antibody titers were tested using TCID50-reduction assay (J). The data were presented as mean ± standard deviation (SD). At each time point, values of the TS11 and WA1 groups were compared by Student’s t test (*, p < 0.05; **, p < 0.01; ***, p < 0.005).
Figure 6
Figure 6
Three-dimensional structural analyses of the nsp16 proteins of SARS-CoV-2 WA1 (A) and SARS-CoV-2 TS11 (B). They were modeled based on the structure of nsp16 of SARS-CoV-2 WA1 from the Protein Data Bank (PDB accession number 6WKS). S-adenosyl methionine is in Cyan. Tyrosine (TYR); Histidine [18].

Similar articles

Cited by

References

    1. Wu F., Zhao S., Yu B., Chen Y.M., Wang W., Song Z.G., Hu Y., Tao Z.W., Tian J.H., Pei Y.Y., et al. A new coronavirus associated with human respiratory disease in China. Nature. 2020;579:265–269. doi: 10.1038/s41586-020-2008-3. - DOI - PMC - PubMed
    1. Dai L., Gao G.F. Viral targets for vaccines against COVID-19. Nat. Rev. Immunol. 2021;21:73–82. doi: 10.1038/s41577-020-00480-0. - DOI - PMC - PubMed
    1. Uddin M.N., Roni M.A. Challenges of Storage and Stability of mRNA-Based COVID-19 Vaccines. Vaccines. 2021;9:1033. doi: 10.3390/vaccines9091033. - DOI - PMC - PubMed
    1. Evans J.P., Zeng C., Carlin C., Lozanski G., Saif L.J., Oltz E.M., Gumina R.J., Liu S.L. Neutralizing antibody responses elicited by SARS-CoV-2 mRNA vaccination wane over time and are boosted by breakthrough infection. Sci. Transl. Med. 2022;14:eabn8057. doi: 10.1126/scitranslmed.abn8057. - DOI - PMC - PubMed
    1. Altarawneh H.N., Chemaitelly H., Hasan M.R., Ayoub H.H., Qassim S., AlMukdad S., Coyle P., Yassine H.M., Al-Khatib H.A., Benslimane F.M., et al. Protection against the Omicron Variant from Previous SARS-CoV-2 Infection. N. Engl. J. Med. 2022;386:1288–1290. doi: 10.1056/NEJMc2200133. - DOI - PMC - PubMed

Publication types