

Secular Trends of Clinical Characteristics and Survival of Hepatocellular Carcinoma in Taiwan from 2011 to 2019
- PMID: 36680166
- PMCID: PMC9867357
- DOI: 10.3390/v15010126
Secular Trends of Clinical Characteristics and Survival of Hepatocellular Carcinoma in Taiwan from 2011 to 2019
Abstract
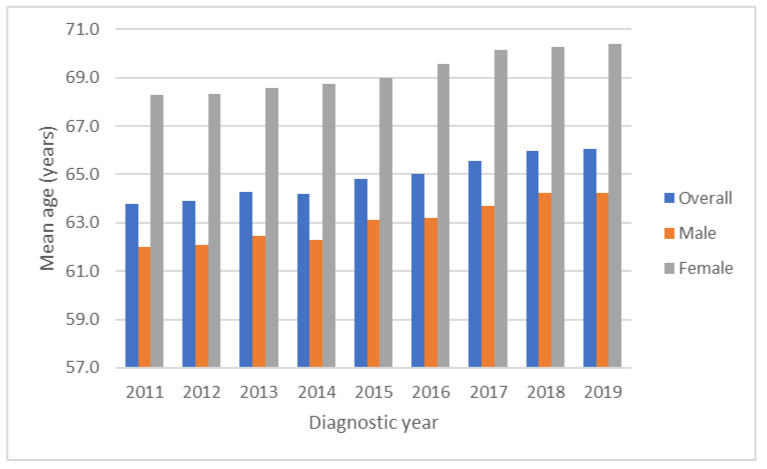
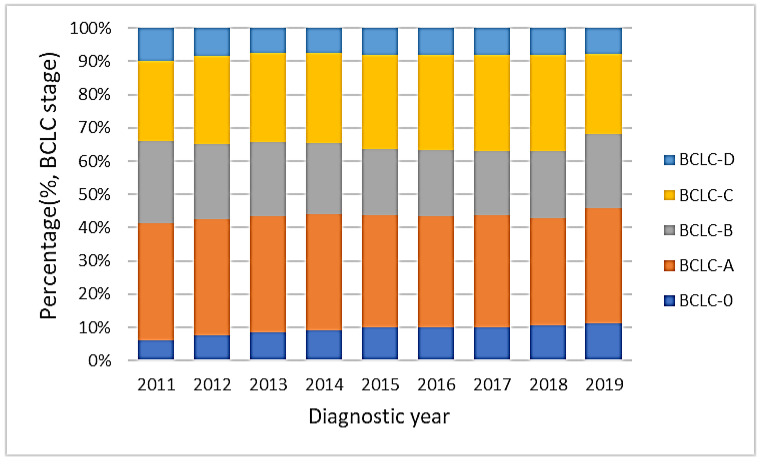
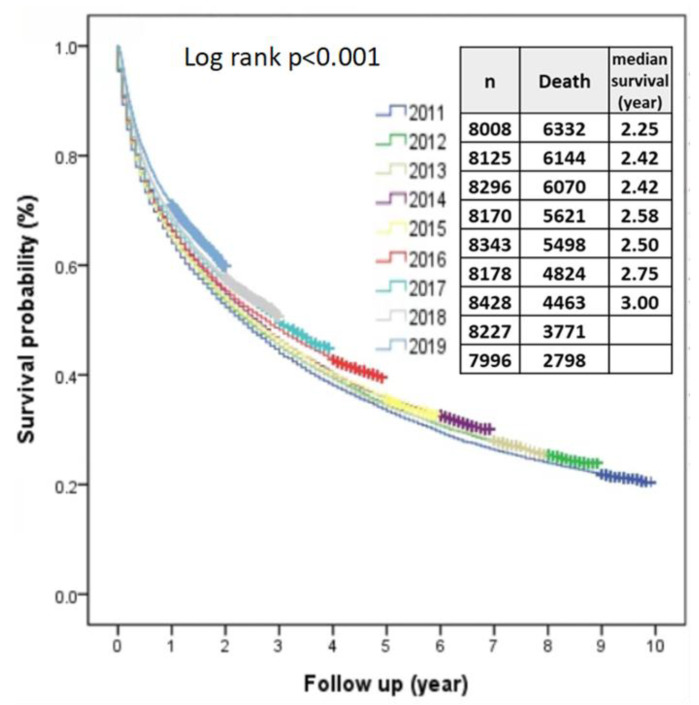
Hepatocellular carcinoma (HCC) is a major cause of cancer death in Taiwan, and in the past 30-40 years, Taiwan has been committed to its prevention and treatment. We aimed to investigate the secular trends of characteristics and the survival of HCC in recent decades after making increased efforts. Between 2011 and 2019, a total of 73,817 cases were enrolled from the TCR database. The overall male-to-female ratio was 7/3. The overall, male and female mean ages increased from 63.8 to 66.1 years, 62.0 to 64.3 years and 68.3 to 70.4 years, respectively. After dividing by viral etiologies and gender, the mean age showed increasing trends in all subgroups. The proportions of HBV-HCC, HCV-HCC, HBV+HCV-HCC and Non-HBV+non-HCV-HCC were 48.3%, 25.2%, 5.3% and 21.3% in males, compared with 25.5%, 48.6%, 5.3% and 20.5% in females, respectively. The 5-year survival rates of BCLC stages 0, A, B, C and D were 70%, 58%, 34%, 11% and 4%, respectively. The proportion of BCLC stage 0 increased from 6.2% to 11.3%. Multivariate analysis showed that being female, older age, diagnostic year, BCLC stages, hospital level, body mass index, smoking, alcohol consumption, AFP, Child-Pugh classification and HBV/HCV status were independent predictors for survival. In recent decades, the overall survival of HCC in Taiwan has been improving and might be partly associated with increased BCLC 0 and Child-Pugh A patients, while with the consequent age of patients increasing over time. The proportion of viral-related HCC is decreasing, while nonviral-related HCC is increasing.
Keywords: age; gender; hepatitis B virus; hepatitis C virus; hepatocellular carcinoma; non-B and non-C viral hepatitis; survival.
Conflict of interest statement
The authors declare no conflict of interest.
Figures


References
-
- Tateishi R., Uchino K., Fujiwara N., Takehara T., Okanoue T., Seike M., Yoshiji H., Yatsuhashi H., Shimizu M., Torimura T., et al. A nationwide survey on non-B, non-C hepatocellular carcinoma in Japan: 2011-2015 update. J. Gastroenterol. 2019;54:367–376. doi: 10.1007/s00535-018-1532-5. - DOI - PMC - PubMed
-
- Taiwan Cancer Registry Center Cancer Stastistics. [(accessed on 6 October 2022)]. Available online: https://twcr.tw/?page_id=1855&lang=en.
Publication types
MeSH terms
LinkOut - more resources
Full Text Sources
Medical
Miscellaneous
