. 2022 Dec 31;15(1):128.
doi: 10.3390/v15010128.

Molecular Epidemiology of HIV-1 in Ghana: Subtype Distribution, Drug Resistance and Coreceptor Usage

Affiliations

Molecular Epidemiology of HIV-1 in Ghana: Subtype Distribution, Drug Resistance and Coreceptor Usage

Anna Appah et al. Viruses. .

Abstract

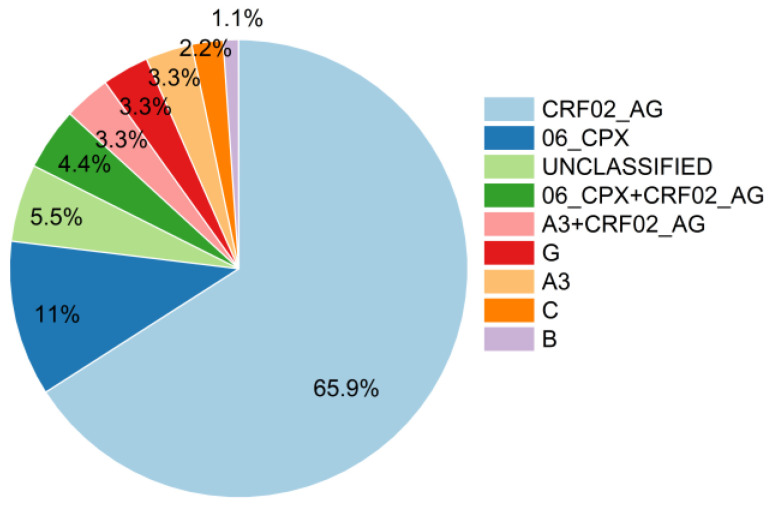
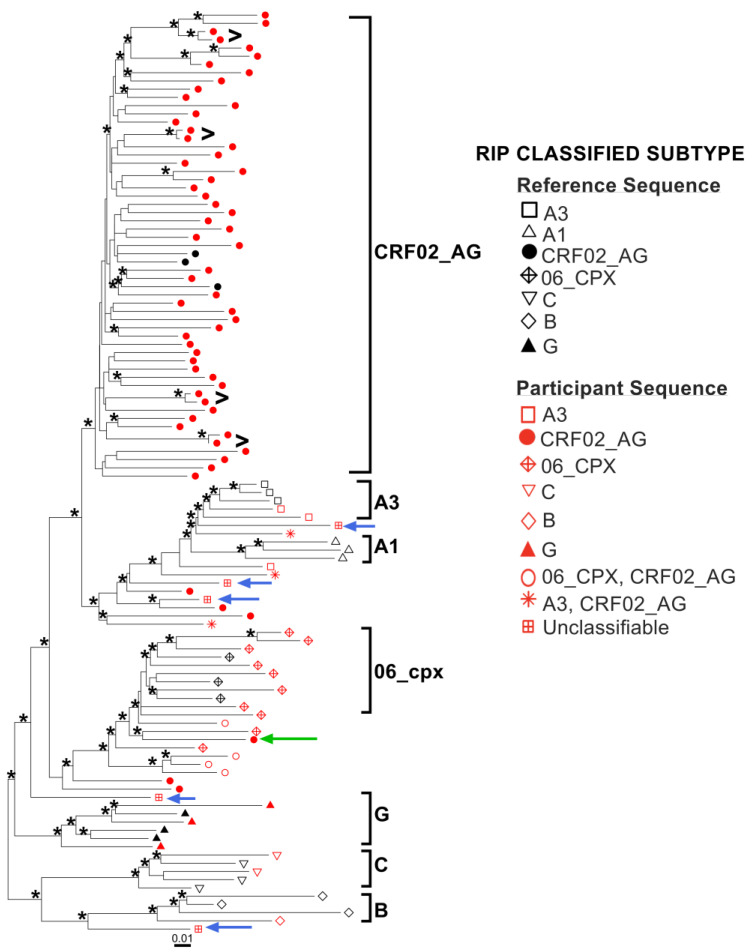
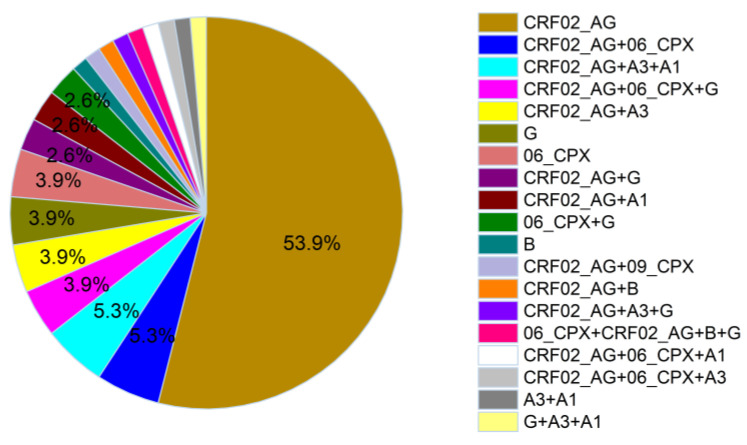
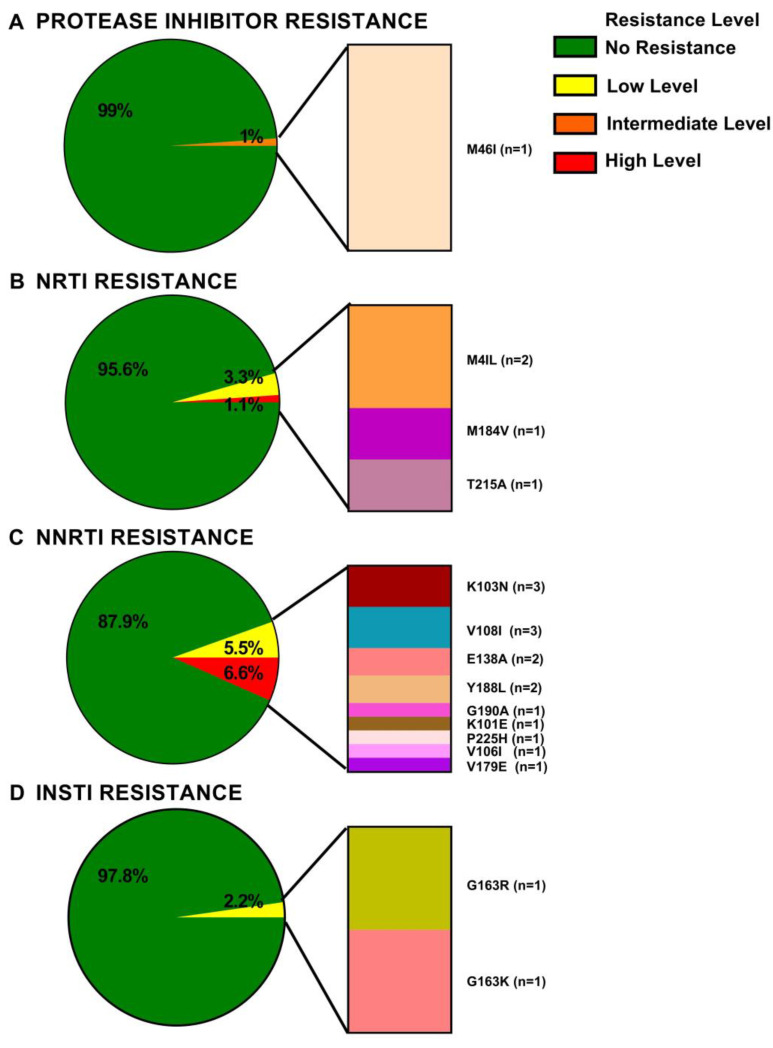
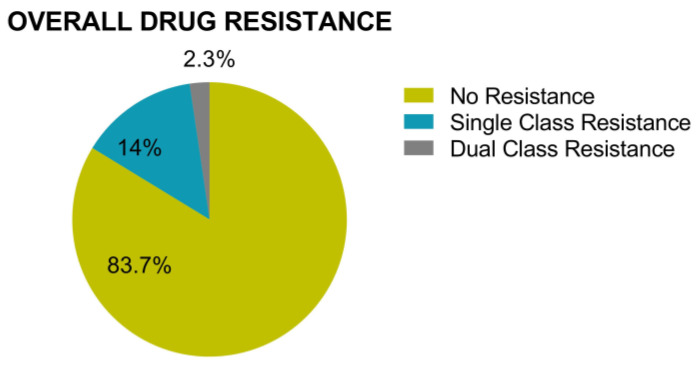
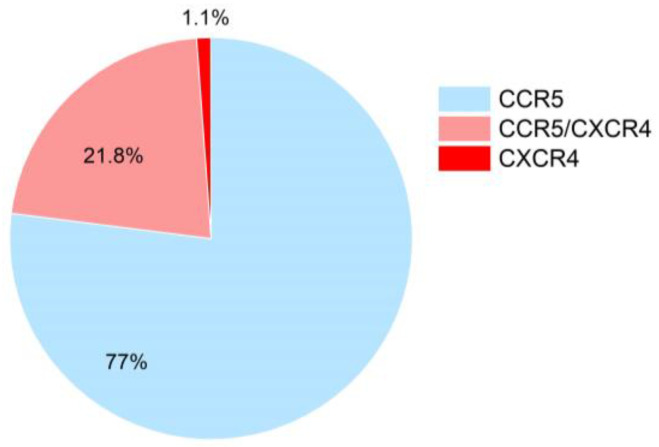
The greatest HIV-1 genetic diversity is found in West/Central Africa due to the pandemic’s origins in this region, but this diversity remains understudied. We characterized HIV-1 subtype diversity (from both sub-genomic and full-genome viral sequences), drug resistance and coreceptor usage in 103 predominantly (90%) antiretroviral-naive individuals living with HIV-1 in Ghana. Full-genome HIV-1 subtyping confirmed the circulating recombinant form CRF02_AG as the dominant (53.9%) subtype in the region, with the complex recombinant 06_cpx (4%) present as well. Unique recombinants, most of which were mosaics containing CRF02_AG and/or 06_cpx, made up 37% of sequences, while “pure” subtypes were rare (<6%). Pretreatment resistance to at least one drug class was observed in 17% of the cohort, with NNRTI resistance being the most common (12%) and INSTI resistance being relatively rare (2%). CXCR4-using HIV-1 sequences were identified in 23% of participants. Overall, our findings advance our understanding of HIV-1 molecular epidemiology in Ghana. Extensive HIV-1 genetic diversity in the region appears to be fueling the ongoing creation of novel recombinants, the majority CRF02_AG-containing, in the region. The relatively high prevalence of pretreatment NNRTI resistance but low prevalence of INSTI resistance supports the use of INSTI-based first-line regimens in Ghana.

Keywords: Ghana; HIV; HIV-1; coreceptor usage; molecular epidemiology; pretreatment drug resistance; subtype diversity.


Conflict of interest statement

The authors declare no conflict of interest. The funders had no role in the design of the study; in the collection, analyses, or interpretation of data; in the writing of the manuscript; or in the decision to publish the result.

Figures

Figure 1
Figure 1
Subtype distribution based on protease-RT sequences.
Figure 2
Figure 2
Subtype assignments based on protease-RT sequences. Panels (AC): The y-axis denotes the % similarity between the participant sequence to each of 17 reference sequences (each in a different color) over a sliding window of 400 bases (shown on X axis). The bars at the top of each plot indicate the best matching reference sequence over a given sequence region (lower bar) and whether this match meets the 95% confidence threshold (upper bar). Panel (A) A “pure” CRF02_AG sequence in participant KBH02-GH. Panel (B) Pure subtype B in KBH48-GH. Panel (C) A sample that was classified as CRF02_AG based on two short CRF02_AG regions that met the 95% confidence threshold, but that is likely a recombinant of CRF02_AG and 06_cpx (participant KBH30-GH).
Figure 3
Figure 3
Protease-RT sequences where subtype classification was not possible at the predefined confidence threshold. The y-axis denotes the % similarity between the participant sequence to each of 17 reference sequences (each in a different color) over a sliding window of 400 bases (shown on X axis). The bars at the top of each plot indicate the best matching reference sequence over a given sequence region (lower bar) and whether this match meets the 95% confidence threshold (upper bar). The RIP plots however show the recombinant composition as follows: Panel (A) Mosaic of subtypes A3 and A1. (B) Mosaic of G and/or CRF02_AG at the 5’ end, with A3 at the 3’ end. Panel (C) Likely recombinant of CRF02_AG and A3. Panel (D) Mosaic including A-like, G-like, CRF02_AG-like and/or 06_cpx-like sequences. Panel (E) Likely recombinant of CRF02_AG and subtype D. The sequences are presented in the same order as they appear in the phylogeny (in Figure 4), from top to bottom.
Figure 4
Figure 4
Maximum likelihood protease-RT phylogeny. The tree was inferred from 91 protease-RT sequences from participants (red symbols) and 21 reference sequences representative of cohort diversity (3 each for 7 subtypes; black symbols). Phylogeny is rooted at midpoint. Blue arrows denote sequences with unclassifiable subtypes by RIP, shown in the same order from top to bottom as Figure 3. Black “>“ symbols show known epidemiologically linked pairs. Green arrow shows the sequence in Figure 2C. Scale in estimated nucleotide substitutions per site. Asterisks (*) indicate branches with approximate bootstrap values >70.
Figure 5
Figure 5
Subtype distribution determined from full HIV genomes (N = 76). Categories indicate subtype composition, not shared breakpoints. Single occurrences are not indicated by percentages.
Figure 6
Figure 6
Representative full-HIV-genome similarity plots of major subtypes in our cohort. The y-axis denotes the % similarity between the participant sequence to each of 17 reference sequences (each in a different color) over a sliding window of 400 bases (shown on X axis). The bars at the top of each plot indicate the best matching reference sequence over a given sequence region (lower bar) and whether this match meets the 95% confidence threshold (upper bar). Panel (A) CRF02_AG in KBH06-GH. Panel (B) Pure Subtype G in KBH16-GH. Panel (C) 06_cpx in KBH22-GH.
Figure 7
Figure 7
Full-genome similarity plots of unique recombinants. Panels (AC): The y-axis denotes the % similarity between the participant sequence to each of 17 reference sequences (each in a different color) over a sliding window of 400 bases (shown on X axis). The bars at the top of each plot indicate the best matching reference sequence over a given sequence region (lower bar) and whether this match meets the 95% confidence threshold (upper bar). Panel (A) Novel A3 and A1 recombinant in KBH72-GH. Panel (B) Novel recombinant containing CRF02_AG and 09_cpx in KBH35-GH. Panel (C) Novel recombinant of CRF02_AG and A3 in KBH62-GH.
Figure 8
Figure 8
Similarity plots of 3 sequences classified as CRF02_AG/A3/A1 recombinants that do not share common breakpoints, indicating that they arose independently. Panels (AC): The y-axis denotes the % similarity between the participant sequence to each of 17 reference sequences (each in a different color) over a sliding window of 400 bases (shown on X axis). The bars at the top of each plot indicate the best matching reference sequence over a given sequence region (lower bar) and whether this match meets the 95% confidence threshold (upper bar). Panel (A) CRF02_AG/A3/A1 in KBH43-GH Panel (B) CRF02_AG/A3/A1 in KBH63-GH Panel (C) CRF02_AG/A3/A1 in EHC002-GH.
Figure 9
Figure 9
Drug resistance by antiretroviral class, identified by Sanger sequencing. Resistance categories were defined based on the following Stanford scores: Susceptible 0–14, Low-level resistance 15–29, Intermediate resistance 30–59 and High-level resistance ≥ 60. For sequences harboring low, intermediate, or high-level resistance, the individual mutations contributing to the inferred resistance are shown at the right of the pie. Panel (A): PI resistance. Panel (B) NRTI resistance. Panel (C) NNRTI resistance. Panel (D) INSTI.
Figure 10
Figure 10
Prevalence of multi-drug resistance, assessed in 86 participants for whom both protease-RT and integrase genotyping was successful. Of the 12 individuals (14%) with single class resistance, 10 had NNRTI resistance, 1 had NRTI resistance, 1 had INSTI resistance. Two cases of dual-class resistance were to NRTI/NNRTI and NRTI/INSTI, respectively.
Figure 11
Figure 11
Coreceptor usage based on V3 loop sequences genotyped using Illumina MiSeq. Coreceptor usage was inferred using the g2p algorithm. A sample was denoted as containing CXCR4-using variants when ≥2% of its g2p scored reads had a false positive rate (FPR) of ≤3.5%.

Similar articles

Cited by

References

    1. Nweze J., Eke I., Nweze E. HIV/AIDS in sub-Saharan Africa: Current status, challenges and prospects. Asian Pac. J. Trop. Dis. 2017;7:239–256. doi: 10.12980/apjtd.7.2017D6-366. - DOI
    1. UNAIDS Global HIV & AIDS Statistics—Fact Sheet. [(accessed on 1 September 2022)]. Available online: https://www.unaids.org/en/resources/fact-sheet.
    1. Wainberg M.A., Friedland G. Public Health Implications of Antiretroviral Therapy and HIV Drug Resistance. JAMA. 1998;279:1977–1983. doi: 10.1001/jama.279.24.1977. - DOI - PubMed
    1. Hemelaar J., Elangovan R., Yun J., Dickson-Tetteh L., Fleminger I., Kirtley S., Williams B., Gouws-Williams E., Ghys P.D., Abimiku A.l.G., et al. Global and regional molecular epidemiology of HIV-1, 1990–2015: A systematic review, global survey, and trend analysis. Lancet Infect. Dis. 2019;19:143–155. doi: 10.1016/S1473-3099(18)30647-9. - DOI - PubMed
    1. Taylor B.S., Sobieszczyk M.E., McCutchan F.E., Hammer S.M. The challenge of HIV-1 subtype diversity. N. Engl. J. Med. 2008;358:1590–1602. doi: 10.1056/NEJMra0706737. - DOI - PMC - PubMed

Publication types

Grants and funding