. 2023 Dec:54:195-210.
doi: 10.1016/j.jare.2023.01.015. Epub 2023 Jan 18.

IQGAP3 is relevant to prostate cancer: A detailed presentation of potential pathomechanisms

Affiliations

IQGAP3 is relevant to prostate cancer: A detailed presentation of potential pathomechanisms

Wenjuan Mei et al. J Adv Res. 2023 Dec.

Abstract

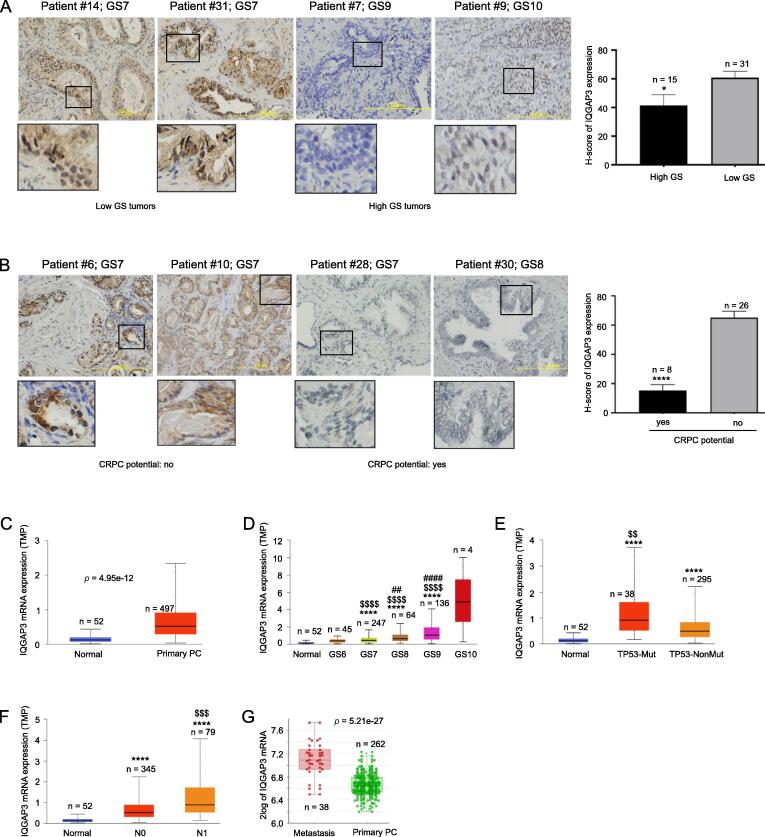
Introduction: IQGAP3 possesses oncogenic actions; its impact on prostate cancer (PC) remains unclear.

Objective: We will investigate IQGAP3's association with PC progression, key mechanisms, prognosis, and immune evasion.

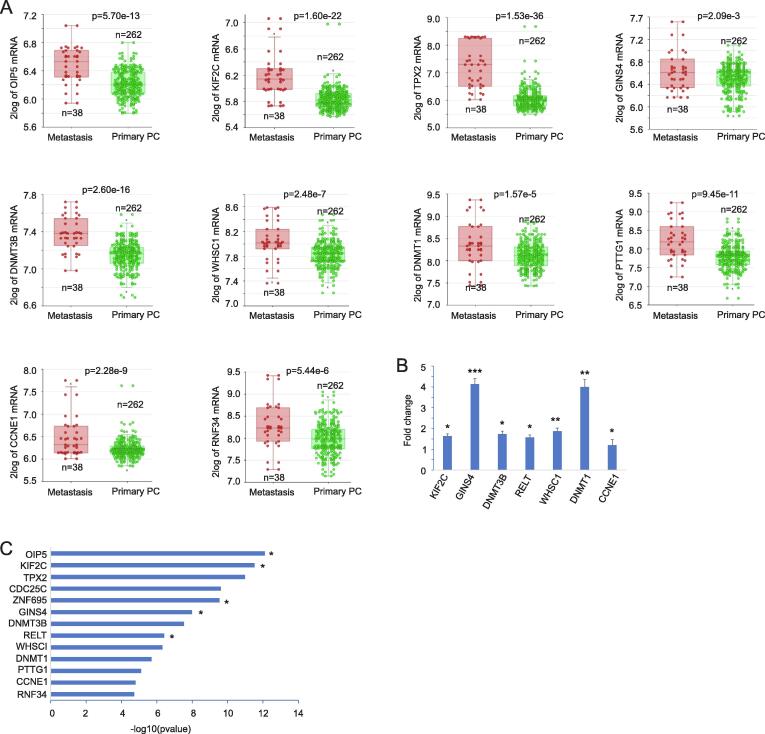
Methods: IQGAP3 expression in PC was examined by immunohistochemistry and using multiple datasets. IQGAP3 network was analyzed for pathway alterations and used to construct a multigene signature (SigIQGAP3NW). SigIQGAP3NW was characterized using LNCaP cell-derived castration-resistant PCs (CRPCs), analyzed for prognostic value in 26 human cancer types, and studied for association with immune evasion.

Results: Increases in IQGAP3 expression associated with PC tumorigenesis, tumor grade, metastasis, and p53 mutation. IQGAP3 correlative genes were dominantly involved in mitosis. IQGAP3 correlated with PLK1 and TOP2A expression at Spearman correlation/R = 0.89 (p ≤ 3.069e-169). Both correlations were enriched in advanced PCs and Taxane-treated CRPCs and occurred at high levels (R > 0.8) in multiple cancer types. SigIQGAP3NW effectively predicted cancer recurrence and poor prognosis in independent PC cohorts and across 26 cancer types. SigIQGAP3NW stratified PC recurrence after adjustment for age at diagnosis, grade, stage, and surgical margin. SigIQGAP3NW component genes were upregulated in PC, metastasis, LNCaP cell-produced CRPC, and showed an association with p53 mutation. SigIQGAP3NW correlated with immune cell infiltration, including Treg in PC and other cancers. RELT, a SigIQGAP3NW component gene, was associated with elevations of multiple immune checkpoints and the infiltration of Treg and myeloid-derived suppressor cells in PC and across cancer types. RELT and SigIQGAP3NW predict response to immune checkpoint blockade (ICB) therapy.

Conclusions: In multiple cancers, IQGAP3 robustly correlates with PLK1 and TOP2A expression, and SigIQGAP3NW and/or RELT effectively predict mortality risk and/or resistance to ICB therapy. PLK1 and TOP2A inhibitors should be investigated for treating cancers with elevated IQGAP3 expression. SigIQGAP3NW and/or RELT can be developed for clinical applications in risk stratification and management of ICB therapy.

Keywords: Clinical relevance; IQGAP3; Immune checkpoint blockade therapy; Overall survival; Prognostic prediction; Prostate cancer.


Conflict of interest statement

Declaration of Competing Interest The authors declare that they have no known competing financial interests or personal relationships that could have appeared to influence the work reported in this paper.

Figures

None
Graphical abstract
Fig. 1
Fig. 1
Association of IQGAP3 with PC tumorigenesis and progression. A., B. Immunohistochemistry staining of IQGAP3 expression in PC. PCs in the B panel were primary PCs with (yes) or without (no) progression to CRPC. Typical images and quantification (mean ± SD/standard deviation) are shown. GS: Gleason score; the marked regions are enlarged 3-fold. * and ****: p < 0.05 and p < 0.0001 respectively by 2-tailed Student’s t test. C-F. Analyses of IQGAP3 mRNA expression (TMP: transcripts per million) in the indicated tissues using the TCGA dataset organized by UALCAN (29). Statistical analyses were performed by UALCAN. ****: p < 0.0001 in comparison to Normal; $$: p < 0.01 compared to PC without TP53 mutation (NonMut) (E), $$$$: p < 0.0001 in comparison to GS6 PCs (D) or PC without lymph node metastasis (N0) (F); ## and ####: p < 0.01 and p < 0.0001 respectively in comparison to GS7 tumors (D). G. The analyses were performed using Sawyers’s DNA microarray dataset (28) within the R2: Genomics Analysis and Visualization Platform (http://r2.amc.nlhttp://r2platform.com).
Fig. 2
Fig. 2
Association of IQGAP3 correlative genes with mitosis and chromosome segregation in PC. IQGAP3 correlative genes were determined with Spearman correlation using the TCGA dataset (n = 497) organized by LinkedOmics (35). A. Analysis of IQGAP3 correlative genes for the enrichment of GO-BP (gene ontology biological process) gene sets by GSEA. All enrichments were at FDR (false discovery rate) < 0.05. B. Details of GSEA enrichment for the indicated GO-BP gene sets. C. Correlations of IQGAP3 mRNA expression with the indicated gene expression in PC (TCGA dataset, n = 497). D. Genes with expression in PC at Spearman R ≥ 0.6 (Table S3A) were analyzed for enrichment using the Metascape platform (30). The top 10 enriched processes are shown (see Table S3C for detailed enrichment).
Fig. 3
Fig. 3
Top enrichment of mitosis in the IQGAP3 correlative genes across human cancers. IQGAP3 correlative genes were determined in 32 human cancer types using LinkedOmics. Those genes with Spearman R ≥ 0.6 (p < 0.001) in all 32 cancer types were analyzed for pathway enrichment using Metascape. A. Cancer types with Mitotic Cell Cycle being the top (#1) enrichment are shown; the exceptions are THYM and TCGC, in which Mitotic Cell Cycle was enriched as #2 (THYM) and #3 (TCGC) enrichment. The -log10(p) for KICH is indicated. B., C. Cancer types showing the correlations of IQGAP3 mRNA expression with PLK1 and TOP2A mRNA expression. The respective TCGA datasets used for these analyses include - ACC: adrenocortical carcinoma; BLCA: bladder urothelial carcinoma; BRCA: breast invasive carcinoma; CHOL: cholangiocarcinoma; COAD: colon adenocarcinoma; GBM: glioblastoma multiforme; HNSC: head and neck squamous cell carcinoma; KICH: kidney chromophobe; KIPR: kidney renal papillary cell carcinoma; KIRC: kidney renal clear cell carcinoma; LAML: acute myeloid leukemia; LGG: brain lower grade glioma; LIHC: liver hepatocellular carcinoma; LUAD: lung adenocarcinoma; MESO: mesothelioma; OV: ovarian serous cystadenocarcinoma; PAAD: pancreatic adenocarcinoma; PCPG: pheochromocytoma and paraganglioma; PRAD: prostate adenocarcinoma; SARC: sarcoma; SKCM: skin cutaneous melanoma; STAD: stomach adenocarcinoma; TGCT: testicular germ cell tumors; THCA: thyroid carcinoma; THYM: thymoma; UCEC: uterine corpus endometrial carcinoma; and UVM: uveal melanoma.
Fig. 4
Fig. 4
SigIQGAP3NW-mediated stratification of PC recurrence and fatality risk. A. Separation of PCs in the Training, Testing, and Full TCGA PanCancer PC dataset with SigIQGAP3NW score. Cutoff points were estimated with Maximally Selected Rank Statistics within the R Maxstat package. Kaplan Meier curves and log-rank test were performed using the R survival package. B. Correlation between IQGAP3 mRNA expression and SigIQGAP3NW score within the TCGA PanCancer PC dataset. C., D. Stratification of PC recurrence in the MSKCC (C) and overall survival probability in mCRPC (SU2C) dataset (D). E. Prediction of PC recurrence (Training, Testing, Full, and MSKCC) and fatality (SU2C) using the respective SigIQGAP3NW scores (continuous data). F. ROC-AUC (receiver operating characteristic-area under the curve) curves for the indicated cohorts.
Fig. 5
Fig. 5
SigIQGAP3NW effectively predicts poor prognosis in a spectrum of human cancers. A. The AUC values of SigIQGAP3NW in discriminating survival probability in all the indicated cancer types except otherwise indicated. The size (n) of TCGA PanCancer datasets used in these analyses is indicated. B-F. SigIQGAP3NW-mediated stratifications of survival probability and recurrence risk for the indicated cancer types are shown.
Fig. 6
Fig. 6
Upregulation of SigIQGAP3NW component genes with PC pathogenesis. A-D. Upregulation of OIP5, KIF2C, TPX2, and ZNF695 in PC, PCs with advanced grades, lymph node metastasis, and p53 mutations. Analyses were carried out using the TCGA dataset organized by UALCAN. **: p < 0.01 and ****: p < 0.0001 in comparison to Normal; $, $$, $$$, and $$$$: p < 0.05, 0.01, 0.001, and 0.0001 respectively in comparison to GS6, N0, and None p53 mutation PCs; #, ##, ###, and ####: p < 0.05, 0.01, 0.001, and 0.0001 respectively compared to GS7 PCs. &: p < 0.05 in compared to GS8 tumors.
Fig. 7
Fig. 7
Upregulation of SigIQGAP3NW component genes following PC progression. A. The Sawyers dataset was used to reveal the upregulation for the indicated SigIQGAP3NW component genes in distant PC metastasis. B. LNCaP cell-derived xenografts in either intact mice (n = 6) or castrated mice (n = 6) were produced and used to determine gene expression by real-time PCR for the indicated genes. Gene expression in CRPC xenografts was presented as fold change (mean ± SD) in reference to their expression in tumors produced in intact mice. *, **, and ***: p < 0.05, 0.01, and 0.001 respectively by 2-tailed Student’s t-test. C. All component genes of SigIQGAP3NW predict PC recurrence with respect to their gene expression in univariate Cox analysis. OIP5, KIF2C, ZNF695, GINS4, and RELT remain risk factors of PC recurrence after adjusting for age at diagnosis, WHO GG grade, stage, and surgical margin status.
Fig. 8
Fig. 8
SigIQGAP3NW correlates with immune cell infiltration. A-F. Immune cell populations in PC, ACC, ccRCC, pRCC, THYM, and UVM were determined from RNA-seq data within the respective TCGA dataset using multiple computational programs. Immune cell contents obtained using ssGSEA were analyzed for correlation (Spearman) with SigIQGAP3NW scores. All correlations were at p < 0.05; only those correlations with Spearman R > |0.1| are indicated. Th2 cells and Treg cells are marked with red, indicating their frequent correlations with SigIQGAP3NW score. (For interpretation of the references to colour in this figure legend, the reader is referred to the web version of this article.)
Fig. 9
Fig. 9
Biomarker potential of RELT and SigIQGAP3NW in predicting response to ICB therapy. A. Correlation of RELT mRNA expression with the expression of indicated immune checkpoints in PC. Analysis was performed using the TCGA PC dataset (n = 497) within the TISIDB platform (31). B. Correlations of RELT mRNA expression with neutrophil, dendritic cells (DCs) (graphs were produced by TIMER), Treg cells, and MDSC (graphs were generated by TISIDB). C. Correlations of RELT mRNA expression with neutrophil and dendritic cells in the indicated cancer types (p < 0.0001 for all correlations and p ≤ 8.34e-11 for all correlations at R ≥ 0.5). The analyses were performed using the TIMER platform (33). D., E. The AUC values for RELT, SigIQGAP3NW, and other indicated biomarkers in predicting response to ICB therapy in the indicated cohorts were obtained using TIDE and graphed. F., G. Stratification of responders and non-responders in anti-CTLA4 antibody (lpi: Ipilimumab) naïve melanoma and glioblastoma treated with PD1 blockade. The graphs were produced using TIDE.

Similar articles

Cited by

References

    1. Sung H., Ferlay J., Siegel R.L., Laversanne M., Soerjomataram I., Jemal A., et al. Global Cancer Statistics 2020: GLOBOCAN Estimates of Incidence and Mortality Worldwide for 36 Cancers in 185 Countries. CA Cancer J Clin. 2021;71(3):209–249. - PubMed
    1. Gordetsky J., Epstein J. Grading of prostatic adenocarcinoma: current state and prognostic implications. Diagn Pathol. 2016;11:25. - PMC - PubMed
    1. Zaorsky N.G., Raj G.V., Trabulsi E.J., Lin J., Den R.B. The dilemma of a rising prostate-specific antigen level after local therapy: what are our options? Semin Oncol. 2013;40(3):322–336. - PubMed
    1. Semenas J., Allegrucci C., Boorjian S.A., Mongan N.P., Persson J.L. Overcoming drug resistance and treating advanced prostate cancer. Curr Drug Targets. 2012;13(10):1308–1323. - PMC - PubMed
    1. Ojo D., Lin X., Wong N., Gu Y., Tang D. Prostate Cancer Stem-like Cells Contribute to the Development of Castration-Resistant Prostate Cancer. Cancers (Basel) 2015;7(4):2290–2308. - PMC - PubMed

Publication types

Substances