

Prediction of neuropathologic lesions from clinical data
- PMID: 36681388
- PMCID: PMC10359434
- DOI: 10.1002/alz.12921
Prediction of neuropathologic lesions from clinical data
Abstract
Introduction: Post-mortem analysis provides definitive diagnoses of neurodegenerative diseases; however, only a few can be diagnosed during life.
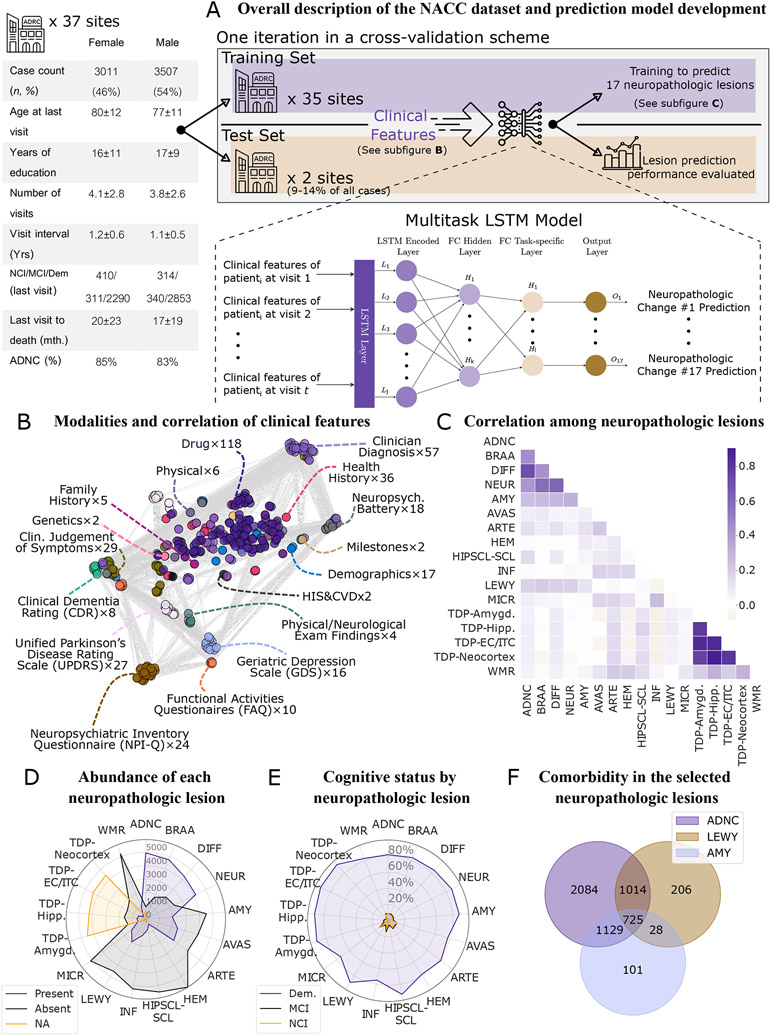
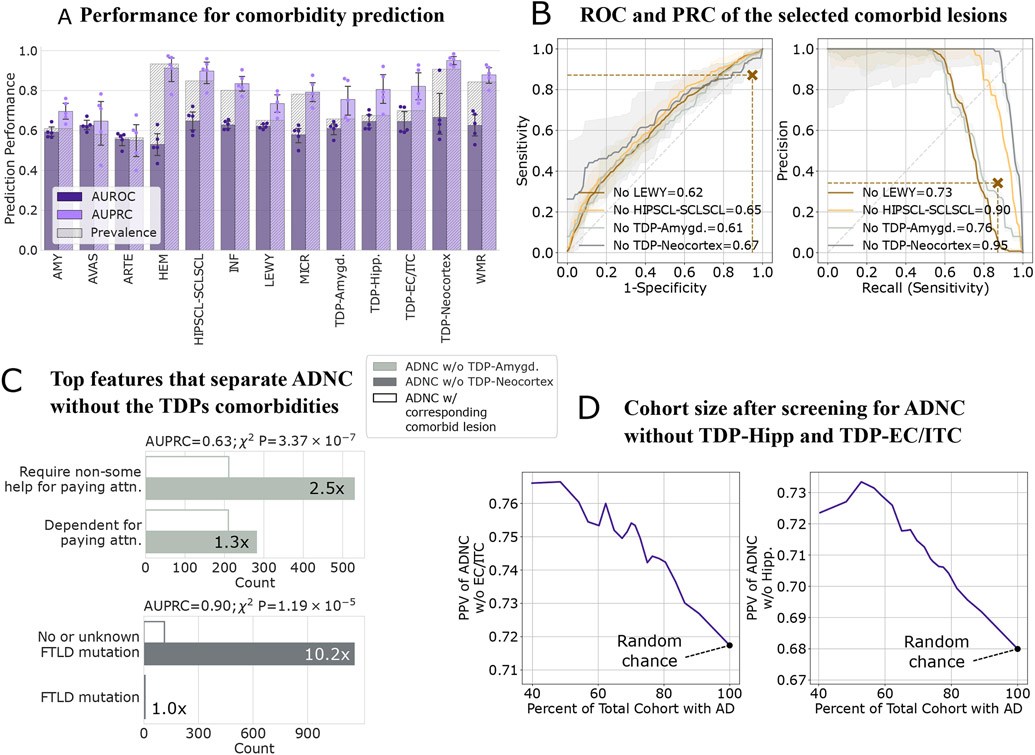
Methods: This study employed statistical tools and machine learning to predict 17 neuropathologic lesions from a cohort of 6518 individuals using 381 clinical features (Table S1). The multisite data allowed validation of the model's robustness by splitting train/test sets by clinical sites. A similar study was performed for predicting Alzheimer's disease (AD) neuropathologic change without specific comorbidities.
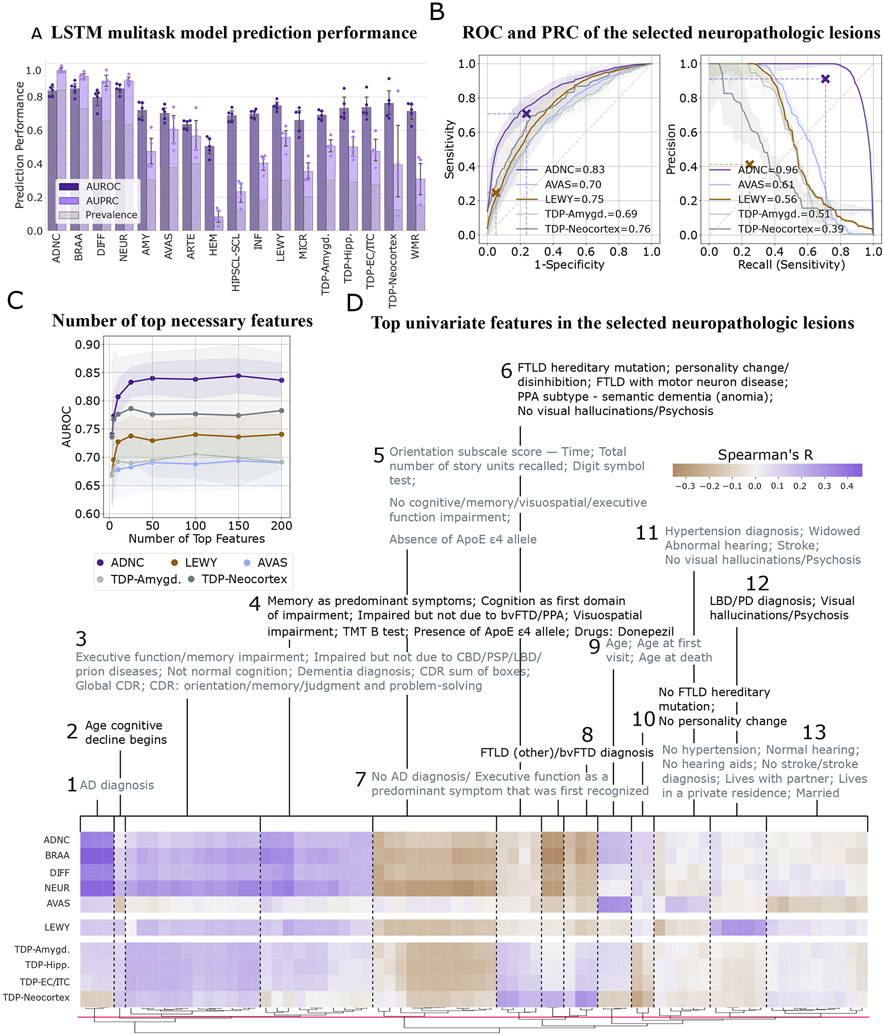
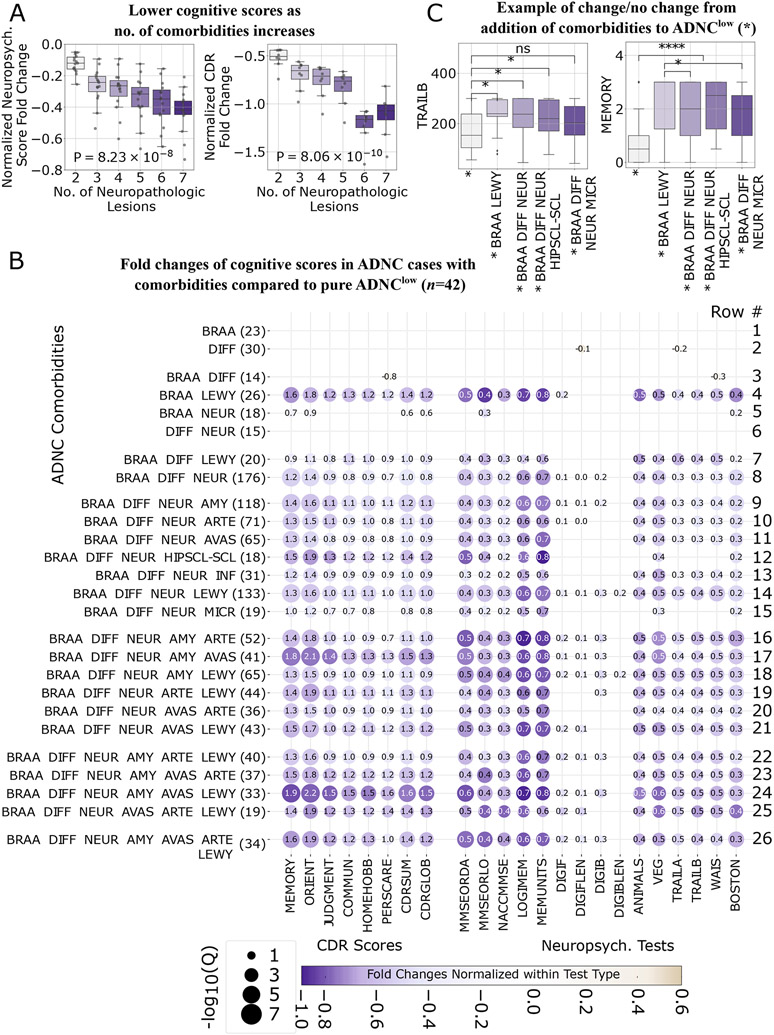
Results: Prediction results show high performance for certain lesions that match or exceed that of research annotation. Neurodegenerative comorbidities in addition to AD neuropathologic change resulted in compounded, but disproportionate, effects across cognitive domains as the comorbidity number increased.
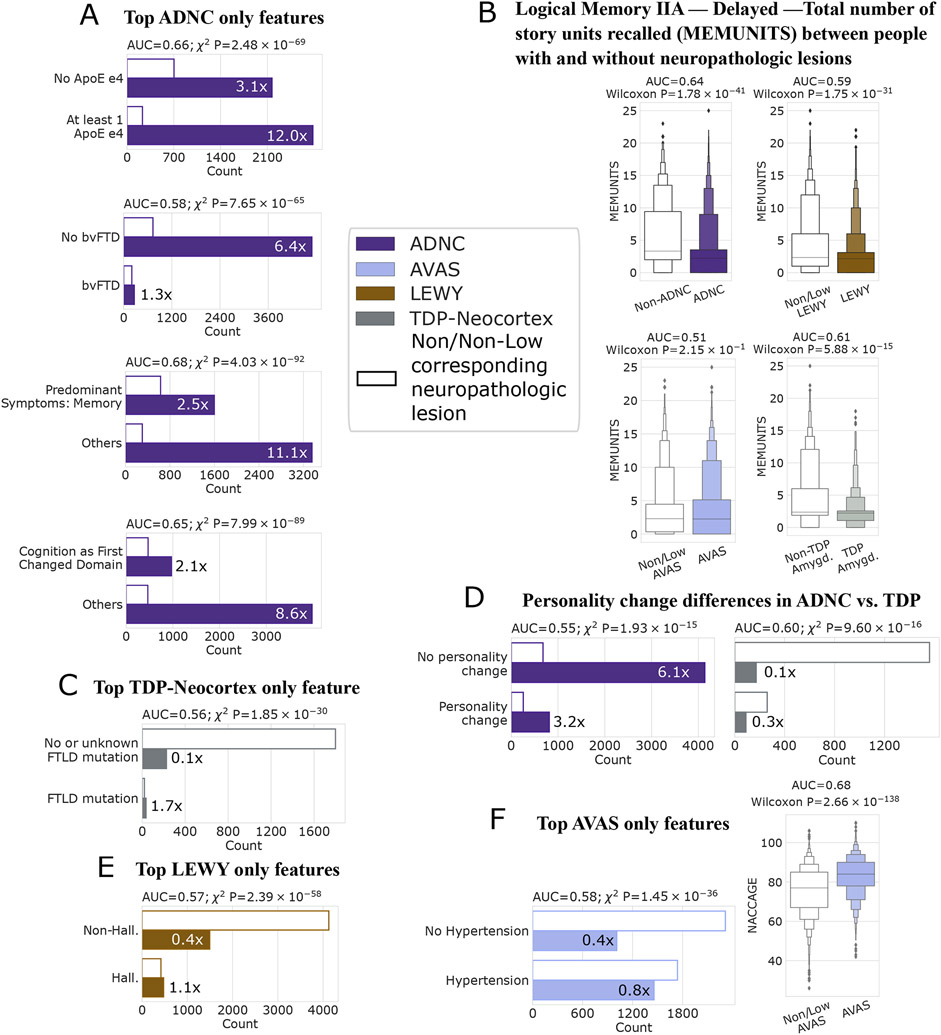
Discussion: Certain clinical features could be strongly associated with multiple neurodegenerative diseases, others were lesion-specific, and some were divergent between lesions. Our approach could benefit clinical research, and genetic and biomarker research by enriching cohorts for desired lesions.
Keywords: Alzheimer's disease neuropathologic change; Lewy body disease; comorbidities; neuropsychological battery tests; post-mortem autopsies.
© 2023 the Alzheimer's Association.
Conflict of interest statement
Conflicts
The authors listed certify that they have no affiliations with or involvement in any organization or entity with any financial interest or non-financial interest in the subject matter or materials discussed in this manuscript.
Figures
Similar articles
-
Brain collection, standardized neuropathologic assessment, and comorbidity in Alzheimer's Disease Neuroimaging Initiative 2 participants.Alzheimers Dement. 2015 Jul;11(7):815-22. doi: 10.1016/j.jalz.2015.05.010. Alzheimers Dement. 2015. PMID: 26194314 Free PMC article. Review.
-
Neuropsychological changes in asymptomatic persons with Alzheimer disease neuropathology.Neurology. 2014 Jul 29;83(5):434-40. doi: 10.1212/WNL.0000000000000650. Epub 2014 Jun 20. Neurology. 2014. PMID: 24951474 Free PMC article.
-
The Utility of the National Alzheimer's Coordinating Center's Database for the Rapid Assessment of Evolving Neuropathologic Conditions.Alzheimer Dis Assoc Disord. 2020 Apr-Jun;34(2):105-111. doi: 10.1097/WAD.0000000000000380. Alzheimer Dis Assoc Disord. 2020. PMID: 32304374 Free PMC article.
-
Multisite assessment of NIA-AA guidelines for the neuropathologic evaluation of Alzheimer's disease.Alzheimers Dement. 2016 Feb;12(2):164-169. doi: 10.1016/j.jalz.2015.07.492. Epub 2015 Aug 29. Alzheimers Dement. 2016. PMID: 26327235 Free PMC article.
-
The Differential Effects of Alzheimer's Disease and Lewy Body Pathology on Cognitive Performance: a Meta-analysis.Neuropsychol Rev. 2017 Mar;27(1):1-17. doi: 10.1007/s11065-016-9334-0. Epub 2016 Nov 22. Neuropsychol Rev. 2017. PMID: 27878426 Review.
Cited by
-
Understanding the molecular basis of resilience to Alzheimer's disease.Front Neurosci. 2023 Dec 19;17:1311157. doi: 10.3389/fnins.2023.1311157. eCollection 2023. Front Neurosci. 2023. PMID: 38192507 Free PMC article. Review.
-
Quantitative estimate of cognitive resilience and its medical and genetic associations.Alzheimers Res Ther. 2023 Nov 6;15(1):192. doi: 10.1186/s13195-023-01329-z. Alzheimers Res Ther. 2023. PMID: 37926851 Free PMC article.
-
Inferring Alzheimer's disease pathologic traits from clinical measures in living adults.medRxiv [Preprint]. 2024 Jan 20:2023.05.08.23289668. doi: 10.1101/2023.05.08.23289668. medRxiv. 2024. Update in: J Alzheimers Dis. 2024;98(1):95-107. doi: 10.3233/JAD-230639. PMID: 37214885 Free PMC article. Updated. Preprint.
-
Identifying dementia neuropathology using low-burden clinical data.Alzheimers Dement. 2025 Aug;21(8):e70539. doi: 10.1002/alz.70539. Alzheimers Dement. 2025. PMID: 40760979 Free PMC article.
-
The impact of arteriolosclerosis on cognitive impairment in decedents without severe dementia from the National Alzheimer's Coordinating Center.Alzheimers Dement. 2025 Mar;21(3):e70059. doi: 10.1002/alz.70059. Alzheimers Dement. 2025. PMID: 40110658 Free PMC article.
References
Publication types
MeSH terms
Substances
Grants and funding
- P50 AG016573/AG/NIA NIH HHS/United States
- P50 AG047266/AG/NIA NIH HHS/United States
- P30 AG010161/AG/NIA NIH HHS/United States
- P50 AG005133/AG/NIA NIH HHS/United States
- P30 AG072977/AG/NIA NIH HHS/United States
- P30 AG010129/AG/NIA NIH HHS/United States
- R01 AG062695/AG/NIA NIH HHS/United States
- P50 AG033514/AG/NIA NIH HHS/United States
- P30 AG013854/AG/NIA NIH HHS/United States
- P30 AG053760/AG/NIA NIH HHS/United States
- P20 AG068082/AG/NIA NIH HHS/United States
- P30 AG010124/AG/NIA NIH HHS/United States
- P50 AG023501/AG/NIA NIH HHS/United States
- P50 AG005142/AG/NIA NIH HHS/United States
- U01 AG079850/AG/NIA NIH HHS/United States
- P20 AG068053/AG/NIA NIH HHS/United States
- P50 AG005131/AG/NIA NIH HHS/United States
- P30 AG010133/AG/NIA NIH HHS/United States
- P50 AG016574/AG/NIA NIH HHS/United States
- P50 AG005146/AG/NIA NIH HHS/United States
- U24 AG072122/AG/NIA NIH HHS/United States
- P30 AG035982/AG/NIA NIH HHS/United States
- P50 AG008702/AG/NIA NIH HHS/United States
- P30 AG008051/AG/NIA NIH HHS/United States
- P50 AG005681/AG/NIA NIH HHS/United States
- P30 AG013846/AG/NIA NIH HHS/United States
- P50 AG047270/AG/NIA NIH HHS/United States
- P50 AG005136/AG/NIA NIH HHS/United States
- P30 AG049638/AG/NIA NIH HHS/United States
- P30 AG012300/AG/NIA NIH HHS/United States
- P50 AG005134/AG/NIA NIH HHS/United States
- UF1 AG057707/AG/NIA NIH HHS/United States
- P30 AG008017/AG/NIA NIH HHS/United States
- T15 LM007033/LM/NLM NIH HHS/United States
- P50 AG025688/AG/NIA NIH HHS/United States
- R35 GM138353/GM/NIGMS NIH HHS/United States
- P20 AG068077/AG/NIA NIH HHS/United States
- P30 AG066546/AG/NIA NIH HHS/United States
- P50 AG005138/AG/NIA NIH HHS/United States
- P50 AG047366/AG/NIA NIH HHS/United States
- P20 AG068024/AG/NIA NIH HHS/United States
- P30 AG072958/AG/NIA NIH HHS/United States
- P30 AG019610/AG/NIA NIH HHS/United States
- P30 AG072947/AG/NIA NIH HHS/United States
- P30 AG072959/AG/NIA NIH HHS/United States
- P30 AG028383/AG/NIA NIH HHS/United States
LinkOut - more resources
Full Text Sources
Medical
