

High-Resolution Ultrasound Characterization of Local Scattering in Cancer Tissue
- PMID: 36681609
- PMCID: PMC9974749
- DOI: 10.1016/j.ultrasmedbio.2022.11.017
High-Resolution Ultrasound Characterization of Local Scattering in Cancer Tissue
Abstract
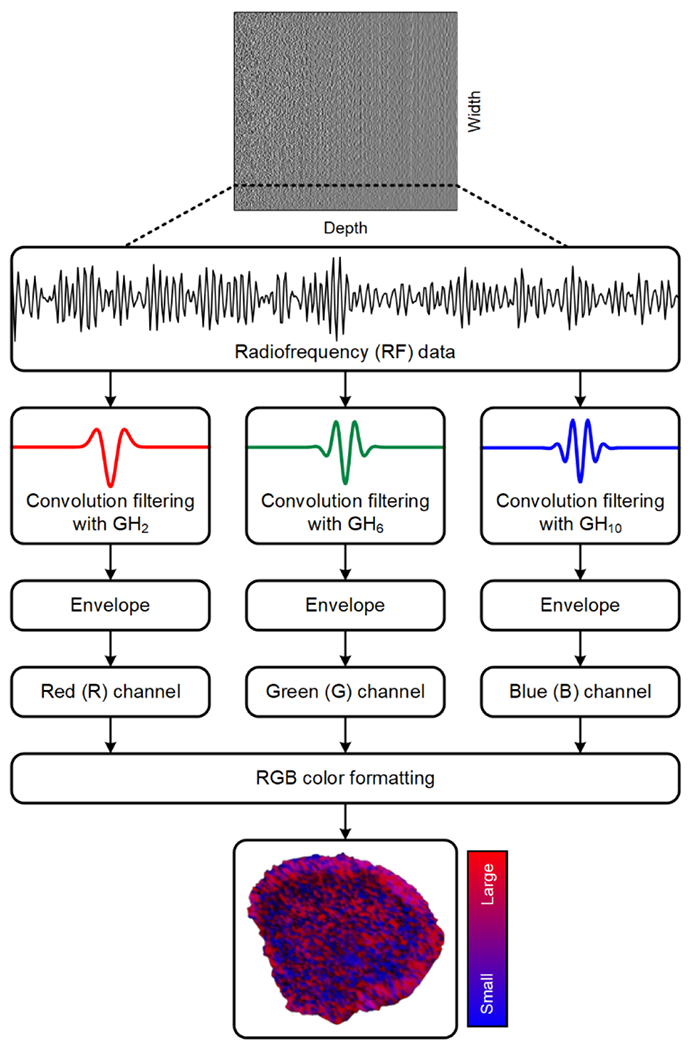
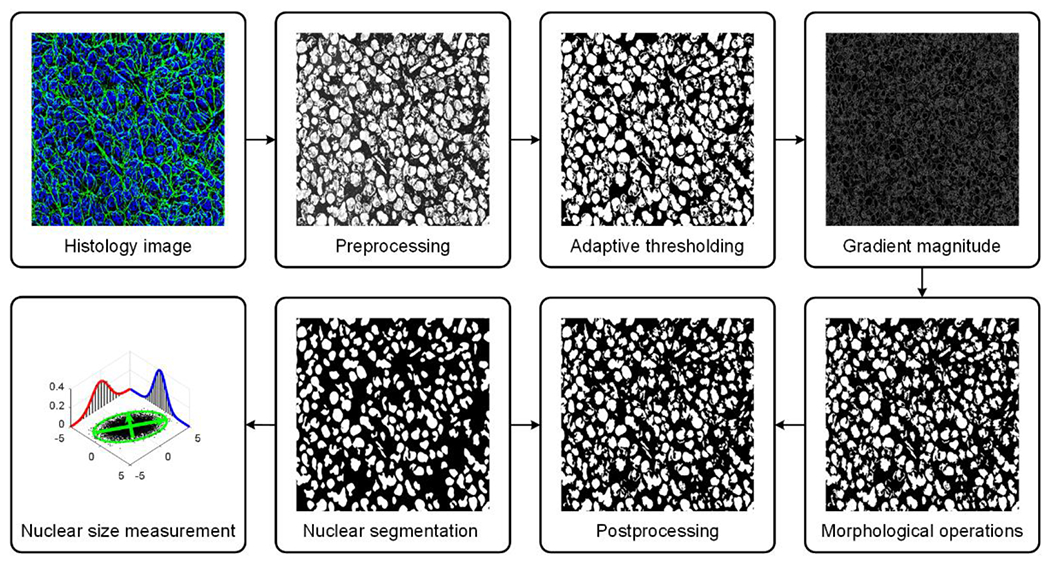
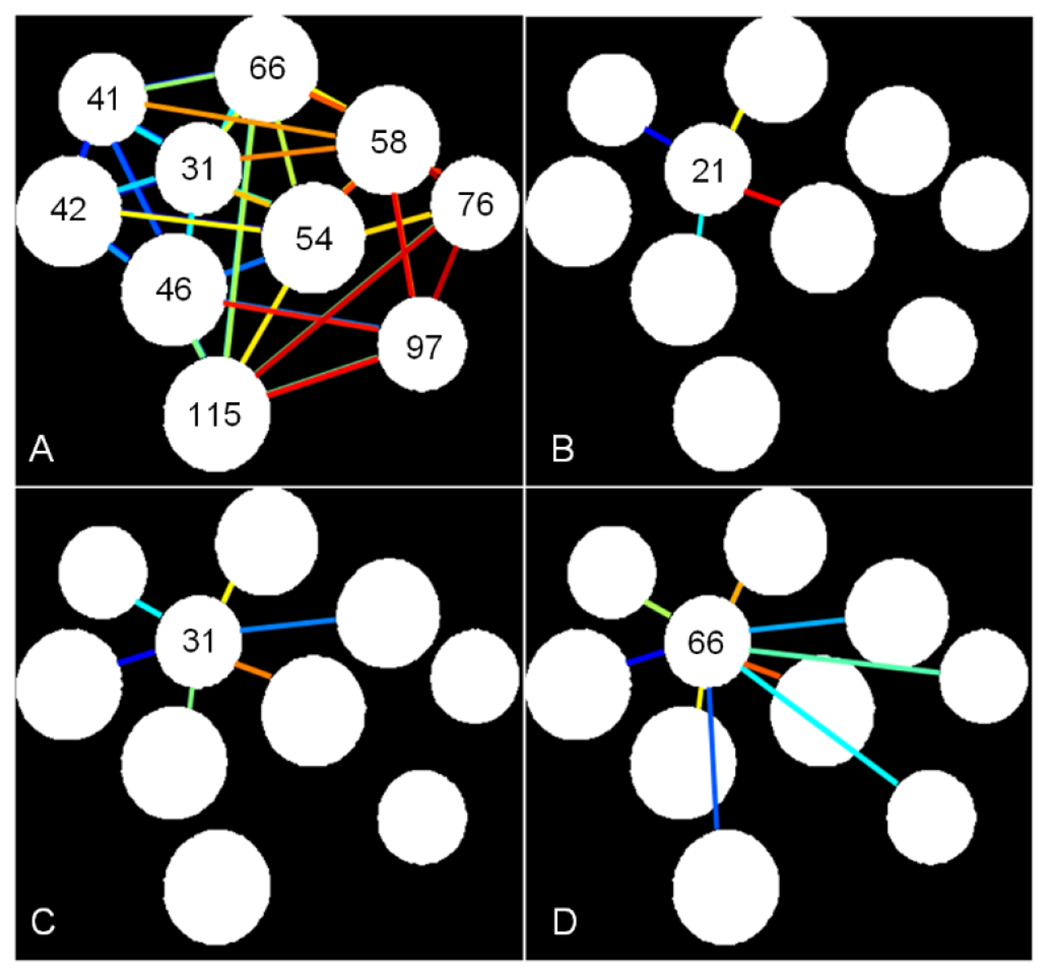
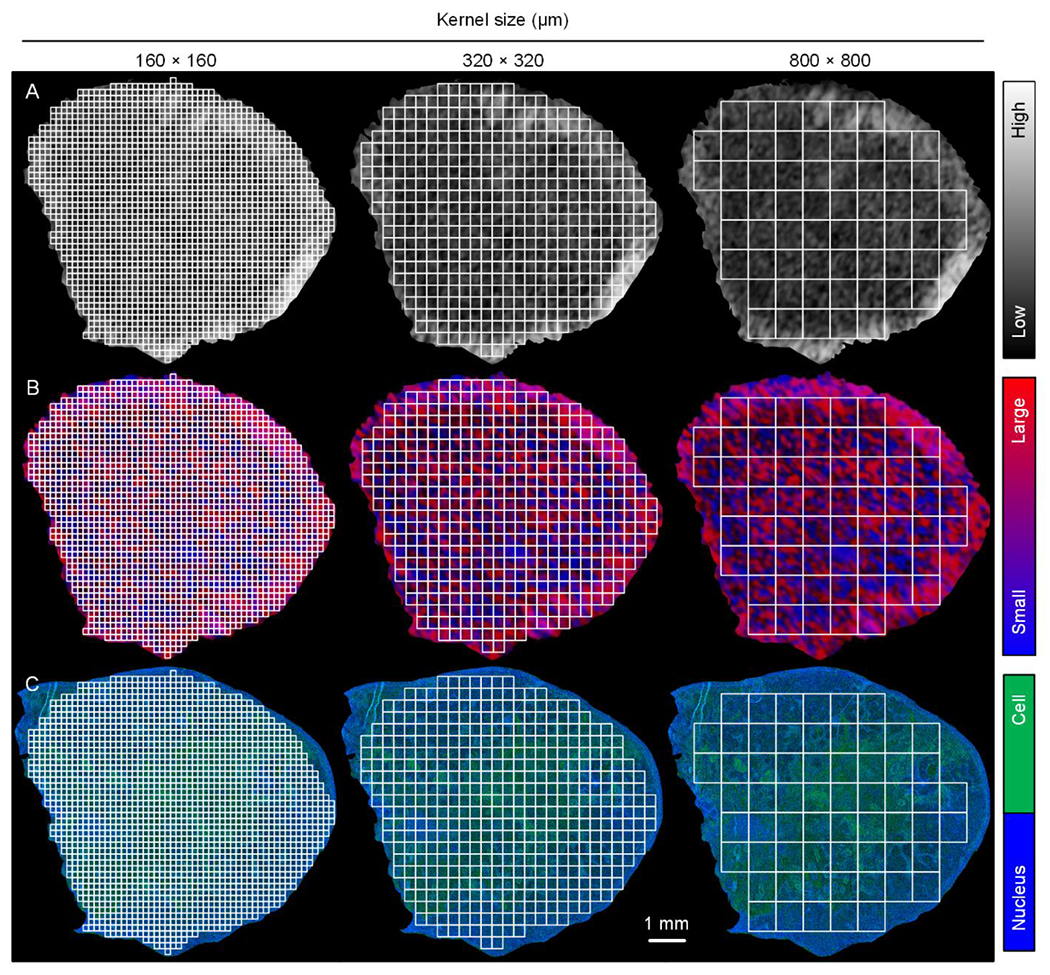
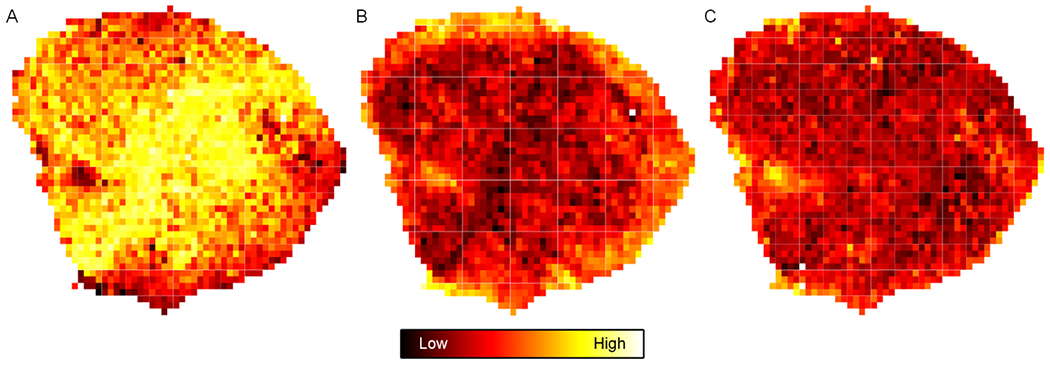
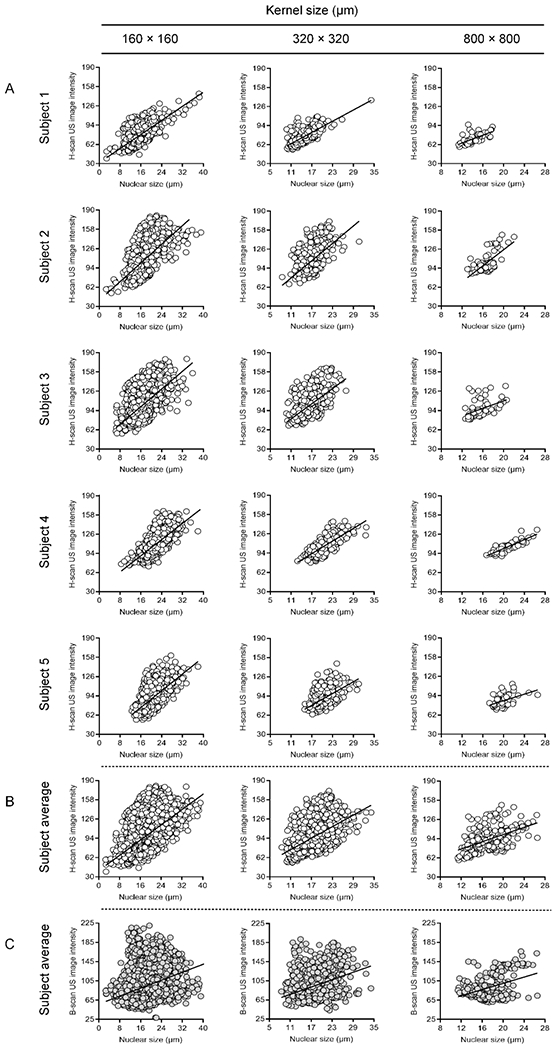
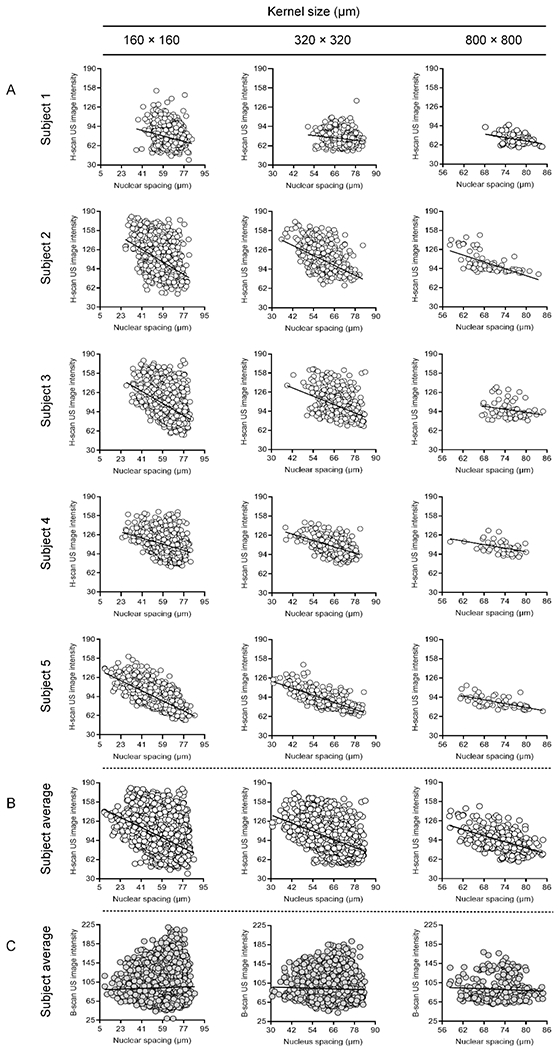
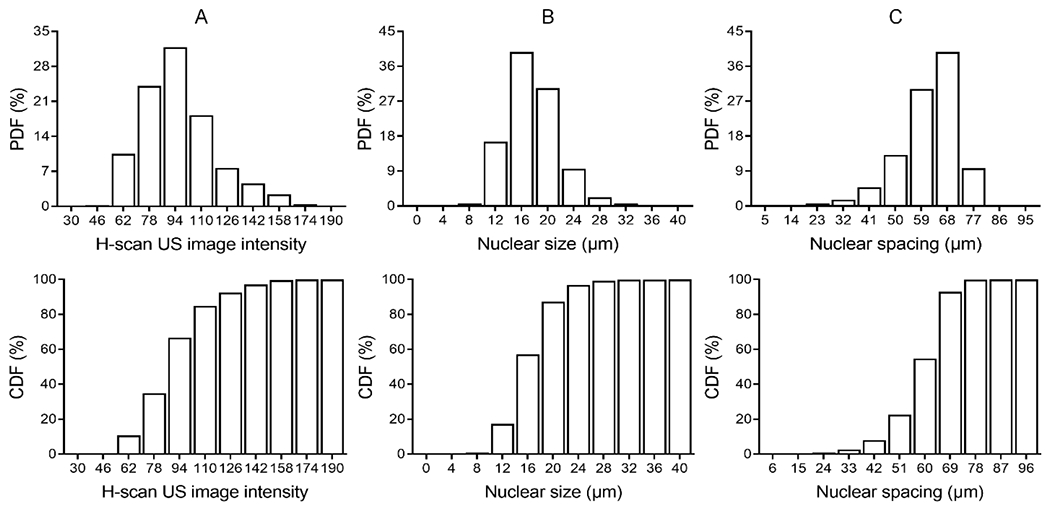
Ultrasound (US) has afforded an approach to tissue characterization for more than a decade. The challenge is to reveal hidden patterns in the US data that describe tissue function and pathology that cannot be seen in conventional US images. Our group has developed a high-resolution analysis technique for tissue characterization termed H-scan US, an imaging method used to interpret the relative size of acoustic scatterers. In the present study, the objective was to compare local H-scan US image intensity with registered histologic measurements made directly at the cellular level. Human breast cancer cells (MDA-MB 231, American Type Culture Collection, Manassas, VA, USA) were orthotopically implanted into female mice (N = 5). Tumors were allowed to grow for approximately 4 wk before the study started. In vivo imaging of tumor tissue was performed using a US system (Vantage 256, Verasonics Inc., Kirkland, WA, USA) equipped with a broadband capacitive micromachined ultrasonic linear array transducer (Kolo Medical, San Jose, CA, USA). A 15-MHz center frequency was used for plane wave imaging with five angles for spatial compounding. H-scan US image reconstruction involved use of parallel convolution filters to measure the relative strength of backscattered US signals. Color codes were applied to filter outputs to form the final H-scan US image display. For histologic processing, US imaging cross-sections were carefully marked on the tumor surface, and tumors were excised and sliced along the same plane. By use of optical microscopy, whole tumor tissue sections were scanned and digitized after nuclear staining. US images were interpolated to have the same number of pixels as the histology images and then spatially aligned. Each nucleus from the histologic sections was automatically segmented using custom MATLAB software (The MathWorks Inc., Natick, MA, USA). Nuclear size and spacing from the histology images were then compared with local H-scan US image features. Overall, local H-scan US image intensity exhibited a significant correlation with both cancer cell nuclear size (R2 > 0.27, p < 0.001) and the inverse relationship with nuclear spacing (R2 > 0.17, p < 0.001).
Keywords: Acoustic scatterers; Cancer; H-Scan ultrasound; Histologic analysis; Tissue characterization; Ultrasound imaging.
Copyright © 2022 World Federation for Ultrasound in Medicine & Biology. Published by Elsevier Inc. All rights reserved.
Conflict of interest statement
Conflict of interest disclosure
The authors declare they have no conflicts of interest.
Figures
Similar articles
-
3-D H-scan ultrasound imaging of relative scatterer size using a matrix array transducer and sparse random aperture compounding.Comput Biol Med. 2022 Dec;151(Pt B):106316. doi: 10.1016/j.compbiomed.2022.106316. Epub 2022 Nov 17. Comput Biol Med. 2022. PMID: 36442278 Free PMC article.
-
Real-time H-scan ultrasound imaging using a Verasonics research scanner.Ultrasonics. 2019 Apr;94:28-36. doi: 10.1016/j.ultras.2018.12.010. Epub 2018 Dec 20. Ultrasonics. 2019. PMID: 30606648 Free PMC article.
-
Spatial Angular Compounding Technique for H-Scan Ultrasound Imaging.Ultrasound Med Biol. 2018 Jan;44(1):267-277. doi: 10.1016/j.ultrasmedbio.2017.09.003. Epub 2017 Oct 12. Ultrasound Med Biol. 2018. PMID: 29031985 Free PMC article.
-
A Review of Ultrasound Tissue Characterization with Mean Scatterer Spacing.Ultrason Imaging. 2017 Sep;39(5):263-282. doi: 10.1177/0161734617692018. Epub 2017 Mar 6. Ultrason Imaging. 2017. PMID: 28797220 Review.
-
Spatial Coherence in Medical Ultrasound: A Review.Ultrasound Med Biol. 2022 Jun;48(6):975-996. doi: 10.1016/j.ultrasmedbio.2022.01.009. Epub 2022 Mar 11. Ultrasound Med Biol. 2022. PMID: 35282988 Free PMC article. Review.
Cited by
-
Microvascular blood flow ultrasound imaging with microbubble-based H-Scan technology.Med Biol Eng Comput. 2025 Jun;63(6):1649-1660. doi: 10.1007/s11517-024-03262-1. Epub 2025 Jan 21. Med Biol Eng Comput. 2025. PMID: 39836289 Free PMC article.
-
A Systematic Review of Real-Time Deep Learning Methods for Image-Based Cancer Diagnostics.J Multidiscip Healthc. 2024 Sep 9;17:4411-4425. doi: 10.2147/JMDH.S446745. eCollection 2024. J Multidiscip Healthc. 2024. PMID: 39281299 Free PMC article.
-
3-D H-scan ultrasound imaging of relative scatterer size using a matrix array transducer and sparse random aperture compounding.Comput Biol Med. 2022 Dec;151(Pt B):106316. doi: 10.1016/j.compbiomed.2022.106316. Epub 2022 Nov 17. Comput Biol Med. 2022. PMID: 36442278 Free PMC article.
References
-
- Coila AL, Lavarello R. Regularized spectral log difference technique for ultrasonic attenuation imaging. IEEE Trans Ultrason Ferroelectr Freq Control 2018;65:378–389. - PubMed
-
- Deeba F, Schneider C, Mohammed S, Honarvar M, Lobo J, Tam E, Salcudean S, Rohling R. A multiparametric volumetric quantitative ultrasound imaging technique for soft tissue characterization. Med Image Anal 2021;74:102245. - PubMed
Publication types
MeSH terms
Grants and funding
LinkOut - more resources
Full Text Sources
Medical
Miscellaneous
