. 2023 Jan 21;9(1):20.
doi: 10.1038/s41420-023-01334-z.

A microfluidic-based PDAC organoid system reveals the impact of hypoxia in response to treatment

Affiliations

A microfluidic-based PDAC organoid system reveals the impact of hypoxia in response to treatment

Marlene Geyer et al. Cell Death Discov. .

Abstract

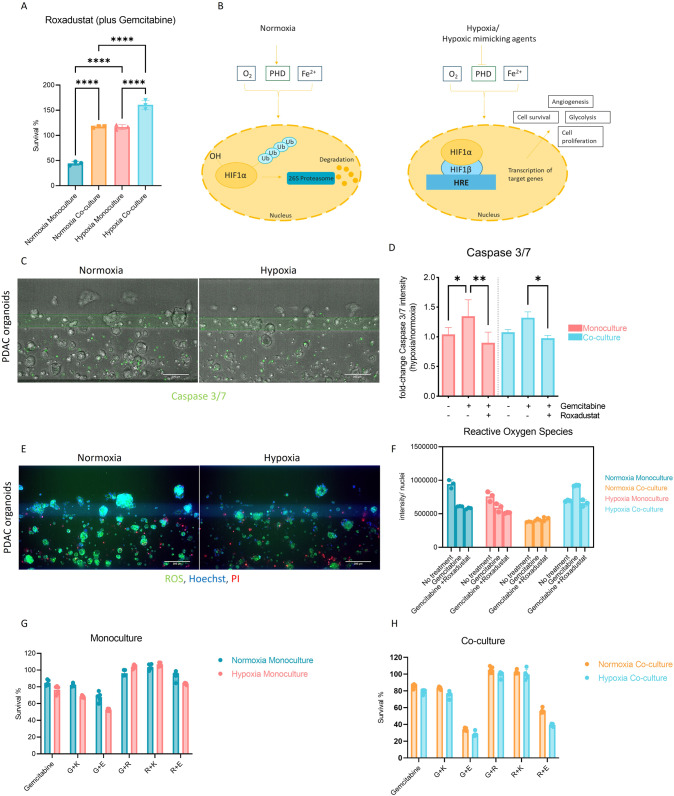
Pancreatic Ductal Adenocarcinoma (PDAC) is estimated to become the second leading cause of cancer-related deaths by 2030 with mortality rates of up to 93%. Standard of care chemotherapeutic treatment only prolongs the survival of patients for a short timeframe. Therefore, it is important to understand events driving treatment failure in PDAC as well as identify potential more effective treatment opportunities. PDAC is characterized by a high-density stroma, high interstitial pressure and very low oxygen tension. The aim of this study was to establish a PDAC platform that supported the understanding of treatment response of PDAC organoids in mono-, and co-culture with pancreatic stellate cells (PSCs) under hypoxic and normoxic conditions. Cultures were exposed to Gemcitabine in combination with molecules targeting relevant molecular programs that could explain treatment specific responses under different oxygen pressure conditions. Two groups of treatment responses were identified, showing either a better effect in monoculture or co-culture. Moreover, treatment response also differed between normoxia and hypoxia. Modulation of response to Gemcitabine was also observed in presence of a Hypoxia-inducible factor (HIF) prolyl hydroxylase (PHD) inhibitor and HIF inhibitors. Altogether this highlights the importance of adjusting experimental conditions to include relevant oxygen levels in drug response studies in PDAC.


Conflict of interest statement

MG, LG and KQ are employees of MIMETAS BV, the Netherlands, which is marketing the OrganoPlate®.

Figures

Fig. 1
Fig. 1. Development of PDAC-on-a-Chip models.
A Image of the OrganoPlate® 2-lane from MIMETAS and (B) a zoomed in schematic overview of one chip. The gel inlet (A1) is connected to the gel channel (blue). The perfusion channel (red) connects the perfusion inlet (A2) with the perfusion outlet (A4). C Schematic representation of a chip filled with PDAC organoids and PSCs. The cells are mixed with extracellular matrix, and these are seeded in the gel channel upon pipetting into the gel inlet and subsequently distributed along the gel channel due to capillary forces. The channels are separated by Phaseguides, capillary pressure barriers, which keep the channels separate from each other and allows the stratified loading of culture components. After gelation, cell culture medium was added to the medium inlet and outlet. During all experiments, when the plates were in the incubator (37 °C), these were kept on an (D) interval rocker at an inclination of 7° and an 8-min interval. The interval rocker ensured perfusion of the cultures. To enhance optical clarity, 50 μl of Hanks Balanced Salt Solution (HBSS) (Sigma, 55037 C) was dispensed into the observation windows of the OrganoPlate® 2-lane. E Timeline of the experiment: On day 0 PDAC organoids and PSCs were seeded in Matrigel suspension, cells were allowed to expand until day 4, when these were subjected to chemotherapeutic treatment for 72 h. Cell survival was analyzed using Cell Titer Glo 3D Viability assay. F Representative Phase Contrast (PC) image of a PDAC organoid monoculture in an OrganoPlate 2-Lane. 4x acquisition, Scale bar: 200 um. PC Images were acquired on the ImageXPress Micro XLS Widefield High-Content Analysis System® (Molecular Devices, US).
Fig. 2
Fig. 2. Assessment of hypoxia and cell viability in PDAC organoids cultures and PDAC organoids-PSCs co-cultures.
Cells were grown for 4 days in the OrganoPlate® 2-Lane until used for subsequent analyses. A shows representative images of a hypoxia marker staining, images were acquired by confocal microscopy. B Hypoxia probe fluorescence intensity was quantified and data normalized to the probe in normoxic conditions. Data is shown as fold change of normoxic conditions (N = 3, n = 3). C Live and Dead assay staining with Hoechst, DraQ7 and Calcein-AM was used to access viability of the cultures. D shows the percentage of dead cells compared to the total cell number in cultures (N = 3, n = 3). The data was compared with Ordinary one-way ANOVA and Tukey’s multiple comparison test and shown are mean and SD (****p ≤ 0.0001, ***P ≤ 0.001, **P ≤ 0.01, *P ≤ 0.05). Confocal images were acquired on the ImageXpress Micro Confocal (Molecular Devices, US).
Fig. 3
Fig. 3. Hypoxia influences the transcriptional state of PDAC organoids (co-)cultures.
Cells were grown under 1% O2 or 20% O2, for 4 days until harvested for RNA isolation, cDNA synthesis and qPCR. A Gene expression analysis of cells grown in hypoxia vs. normoxia. Fold expression changes in normoxia and hypoxia in monoculture and co-culture. The values were normalized to β-actin expression and to normoxic culture conditions to determine the expression differences in hypoxia. (N = 3, 24 chips were pooled for each sample) B RNA Sequencing data of PDAC organoids grown in normoxia and hypoxia. The data is depicted with the Hallmark database and shows pathways upregulated in normoxia (above 0) and pathways upregulated in hypoxia (below 0). The color indicates the -log10(p.adjusted) (N = 1, 48 chips were pooled for each sample). C RNA-Sequencing data of PDAC organoids in co-culture with PSCs grown in normoxia and hypoxia. The data is depicted with the Hallmark database and shows pathways upregulated in normoxia (above 0) and pathways upregulated in hypoxia (below 0). The color indicates the -log10 (p.adjusted). (N = 1, 48 chips were pooled for each sample). Pathways with P < 0.05 are depicted. The graph with all up-, and downregulated genes are depicted in Fig. S2.
Fig. 4
Fig. 4. Chemotherapy treatment effect under different oxygen tension.
PDAC organoids were grown in monoculture and co-culture with PSCs under normoxia and hypoxic conditions. The cells were grown for 4 days on the OrganoPlate® and subjected to several combinations of (chemo)therapeutics for 72 h, after which their survival was analyzed with Cell Titer Glo 3D viability assay. The graphs show the survival of the cultures normalized to a no-treatment control (medium only). Cells were subject to 1 µM Gemcitabine (G) alone and in combination with other compounds (shown in graphs A and B). Shown are mean + − SD and the data points represent individual chips (N = 3, n = 3). Statistical analysis shows results of a 2-way ANOVA with Tukey’s multiple comparisons (****p ≤ 0.0001, ***P ≤ 0.001, **P ≤ 0.01, *P ≤ 0.05).
Fig. 5
Fig. 5. Effect of hypoxia and hypoxia-mimicking compounds on PDAC response to treatment.
A PDAC organoids were grown in monoculture and co-culture with PSCs under normoxic and hypoxic conditions. The cells were grown for 4 days on the OrganoPlate® and subjected to 1 µM Gemcitabine and 1 µM Roxadustat for 72 h, before their survival was analyzed with Cell Titer Glo 3D viability assay. The graph shows the survival of the organoids normalized to a no-treatment control (=medium only). 0.1% DMSO was used as a vehicle control and showed no effect on the cells. The data was compared with Ordinary one-way ANOVA and Tukey’s multiple comparison test and shown are mean and SD (****p ≤ 0.0001, ***P ≤ 0.001, **P ≤ 0.01, *P ≤ 0.05). B Diagram showing key regulators of HIF1α in hypoxia and normoxia. During normoxia HIF1α is constantly hydroxylated by prolyl hydroxylases (PHDs), that use oxygen (O2) and iron (Fe2+), thus leading to subsequent ubiquitination and proteasomal degradation of HIF1α. In contrast, under hypoxia or due to hypoxia mimicking factors (such as Roxadustat treatment), PHDs are inhibited, thus enabling the HIF1α subunit to bind to the HIF1β subunit. This HIF-complex can migrate to the nucleus, bind a hypoxia responsive element (HRE), and lead to the activation of several genes involved in angiogenesis, glycolysis, proliferation, and survival [42]. C Caspase 3/7 staining of chips in hypoxia was compared to chips in normoxia to show respective areas of apoptosis. D Quantification of the Caspase 3/7 assay staining depicting mono-, and co-cultured cells in normoxia and hypoxia when treated with Gemcitabine or Gemcitabine with Roxadustat. The data was compared with Ordinary one-way ANOVA and Tukey’s multiple comparison test and shown are mean and SD (****p ≤ 0.0001, ***P ≤ 0.001, **P ≤ 0.01, *P ≤ 0.05), (n = 3, N = 2). E Reactive Oxygen Species (ROS) staining with ROS marker, Hoechst for nuclei staining and Propidium Iodide (PI) for dead cell staining in PDAC monoculture. F Quantification of ROS intensity to the total cell count in hypoxia samples was normalized to normoxia samples comparing untreated samples with samples treated with Gemcitabine with or without Roxadustat. G Monocultures treated with 500 nM Gemcitabine (G), 1 uM Roxadustat (R), 1 nM Echinomycin (E) and 10 uM Kc7f2 (K). H Co-cultures treated with 500 nM Gemcitabine (G), 1 uM Roxadustat (R), 1 nM Echinomycin (E) and 10 uM Kc7f2 (K) to determine the effect of HIF-inhibitors on PDAC treatment. Shown are mean and SD (****p ≤ 0.0001, ***P ≤ 0.001, **P ≤ 0.01, *P ≤ 0.05), (N = 3, n = 3). The data was analyzed with two-way ANOVA and Sidak’s multiple comparison test. Shown are maximum projections (10× magnification) of PDAC monoculture for all images, imaged on the ImageXpress Micro Confocal (Molecular Devices, US). Scale Bar = 200 um.

Similar articles

Cited by

References

    1. Veenstra V, Garcia-Garijo A, van Laarhoven H, Bijlsma M. Extracellular influences: molecular subclasses and the microenvironment in pancreatic cancer. Cancers (Basel) 2018;10:34. doi: 10.3390/cancers10020034. - DOI - PMC - PubMed
    1. Nielsen MFB, Mortensen MB, Detlefsen S. Key players in pancreatic cancer-stroma interaction: Cancer-associated fibroblasts, endothelial and inflammatory cells. World J Gastroenterol. 2016;22:2678. doi: 10.3748/wjg.v22.i9.2678. - DOI - PMC - PubMed
    1. Daniel SK, Sullivan KM, Labadie KP, Pillarisetty VG. Hypoxia as a barrier to immunotherapy in pancreatic adenocarcinoma. Clin Transl Med. 2019;8:10. doi: 10.1186/s40169-019-0226-9. - DOI - PMC - PubMed
    1. Schäfer M, Werner S. Cancer as an overhealing wound: an old hypothesis revisited. Nat Rev Mol Cell Biol. 2008;9:628–38. doi: 10.1038/nrm2455. - DOI - PubMed
    1. Koong AC, Mehta VK, Le QT, Fisher GA, Terris DJ, Brown JM, et al. Pancreatic tumors show high levels of hypoxia. Int J Radiat Oncol*Biol*Phys. 2000;48:919–22. doi: 10.1016/S0360-3016(00)00803-8. - DOI - PubMed