. 2023 Jan 21;9(1):15.
doi: 10.1038/s41420-023-01324-1.

Neuroprotective effect of astragalin via activating PI3K/Akt-mTOR-mediated autophagy on APP/PS1 mice

Affiliations

Neuroprotective effect of astragalin via activating PI3K/Akt-mTOR-mediated autophagy on APP/PS1 mice

Cui-Zhu Yang et al. Cell Death Discov. .

Abstract

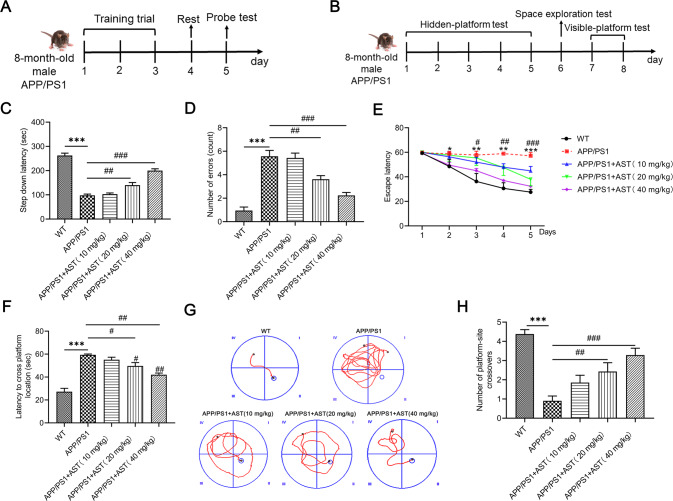
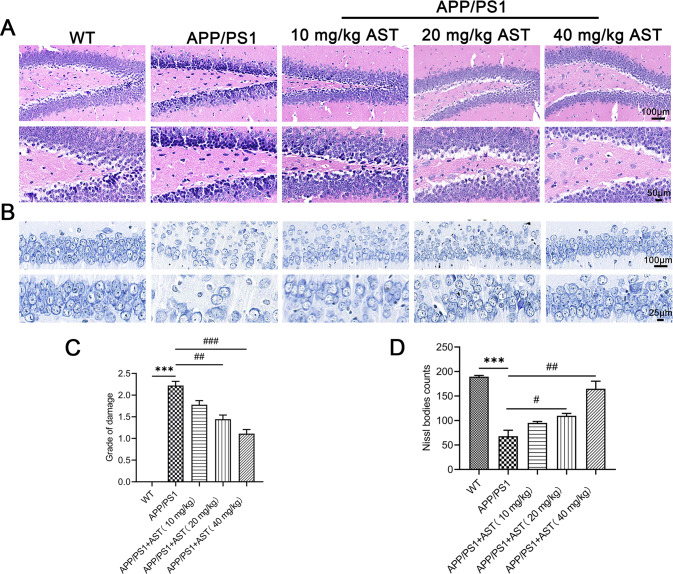
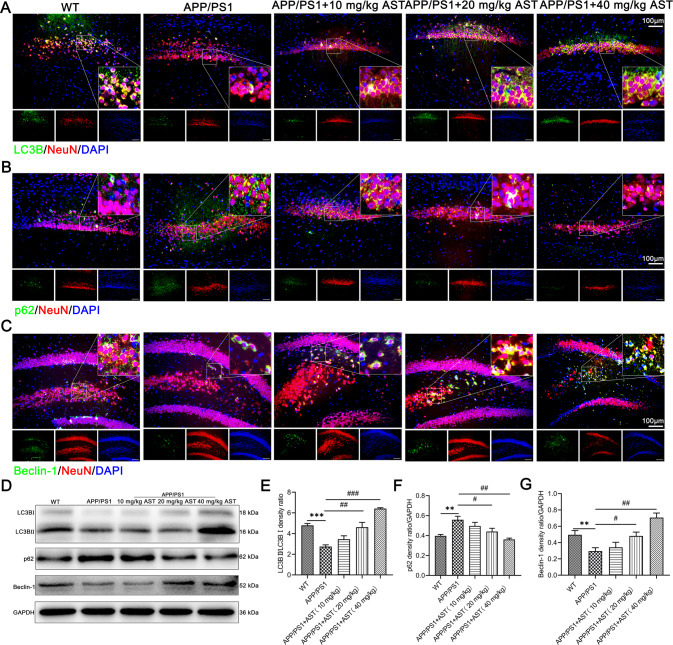
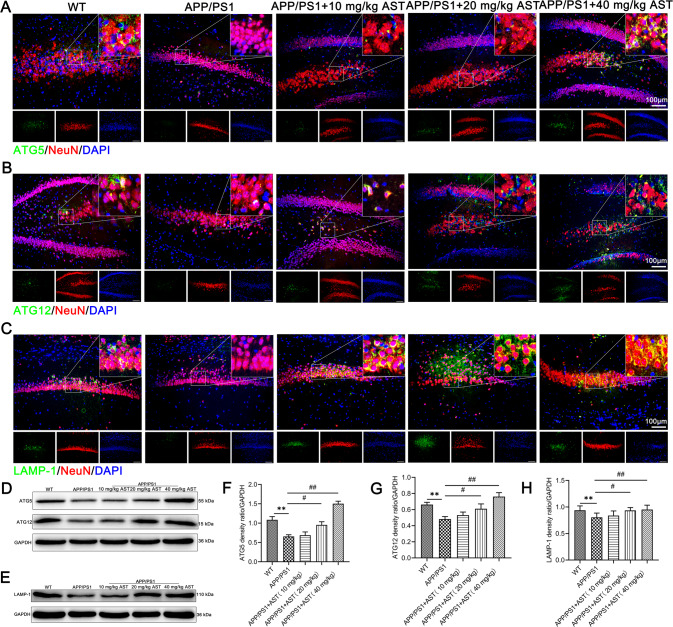
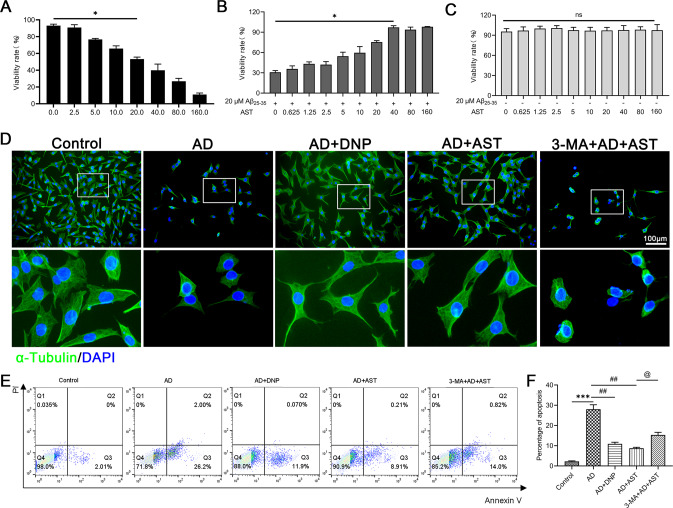
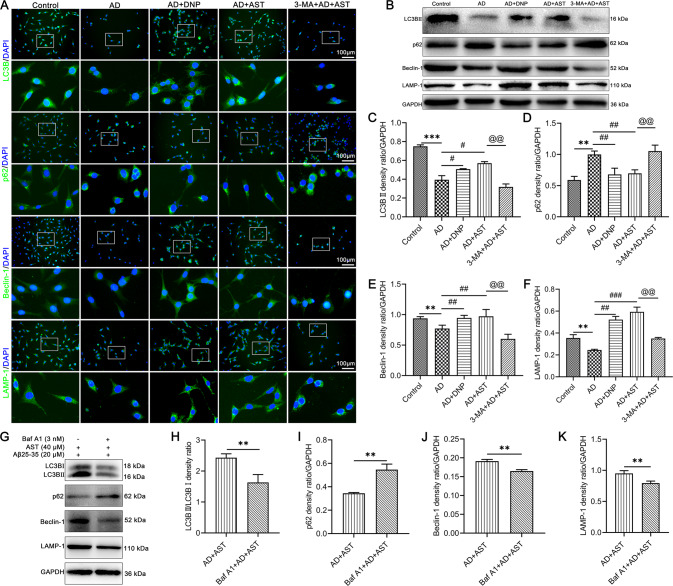
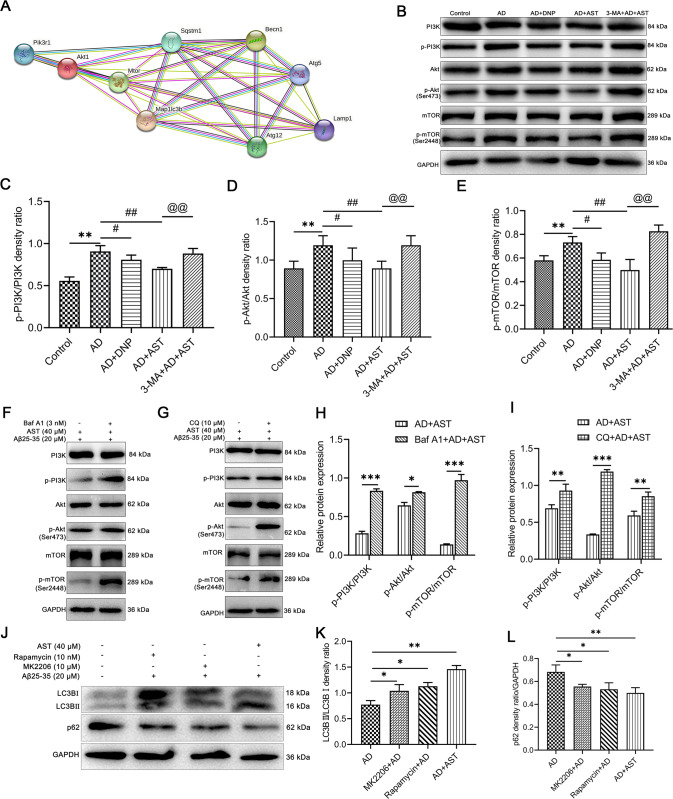
As a small molecule flavonoid, astragalin (AST) has anti-inflammatory, anti-cancer, and anti-oxidation effects. However, the impact and molecular mechanism of AST in Alzheimer's disease (AD) are still not clear. This study aims to investigate the neuroprotective effect and mechanism of AST on APP/PS1 mice and Aβ25-35-injured HT22 cells. In this study, we found that AST ameliorated cognitive dysfunction, reduced hippocampal neuronal damage and loss, and Aβ pathology in APP/PS1 mice. Subsequently, AST activated autophagy and up-regulated the levels of autophagic flux-related protein in APP/PS1 mice and Aβ25-35-induced injury in HT22 cells. Interestingly, AST down-regulated the phosphorylation level of PI3K/Akt-mTOR pathway-related proteins, which was reversed by autophagy inhibitors 3-Methyladenine (3-MA) or Bafilomycin A1 (Baf A1). At the same time, consistent with the impacts of Akt inhibitor MK2206 and mTOR inhibitor rapamycin, inhibited levels of autophagy in Aβ25-35-injured HT22 cells were activated by the administration of AST. Taken together, these results suggested that AST played key neuroprotective roles on AD via stimulating PI3K/Akt-mTOR pathway-mediated autophagy and autophagic flux. This study revealed a new mechanism of autophagy regulation behind the neuroprotection impact of AST for AD treatment.


Conflict of interest statement

The authors declare no competing interests.

Figures

Fig. 1
Fig. 1. AST improved the cognitive dysfunction of APP/PS1 mice in the step-down avoidance (SDA) test and the Morris water maze (MWM) test.
A, B Timelines of the mice SDA and MWM test. C, D The step-down latency and the number of errors of mice in the SDA test. E The escape latency of mice to arrive at the platform during the positioning navigation test in the MWM test (Day 1–5). F, G Time of mice to reach the target platform and swimming trajectory diagrams of mice during the space exploration in the MWM test (Day 6). H The number of mice crossing the target platform during the visible platform period in the MWM test (Day 7–8). Data were presented as mean ± SD, n = 7/group. *p < 0.05, **p < 0.01 and ***p < 0.001 vs WT group, #p < 0.05, ##p < 0.01 and ###p < 0.001 vs APP/PS1 group.
Fig. 2
Fig. 2. AST reduced hippocampal neuronal damage of APP/PS1 mice by HE and Nissl staining.
A HE staining aimed to observe the alterations of neuronal morphology in mice hippocampus. Scale bar = 100, 50 μm, respectively. B Nissl staining aimed to detect changes in the morphology of Nissl bodies in the mice hippocampus. Scale bar = 100, 25 μm, respectively. C The grade of neuronal damage in the hippocampus of mice. D Statistical analysis of the Nissl bodies in the hippocampus of mice. Data were presented as mean ± SD, n = 4/group. ***p < 0.001 vs WT group, #p < 0.05 and ##p < 0.01 vs APP/PS1 group.
Fig. 3
Fig. 3. AST reduced Aβ aggregation in the APP/PS1 mice.
A Detection of SPs in the brain of mice by Th-S staining and immunofluorescent co-staining. Scale bar = 500 μm in the three columns of images, and scale bar = 100 μm in the last column of images. B Statistical analysis of the number of SPs in the brain of mice in the merged images at 5X magnification (scale bar = 500 μm) of A. C, D The Aβ and Aβ42 levels in the serum of mice were detected by ELISA. Data were presented as mean ± SD, n = 3/group. ***p < 0.001 vs WT group, ##p < 0.01 and ###p < 0.001 vs APP/PS1 group.
Fig. 4
Fig. 4. AST activated autophagy initiation in hippocampal neurons of APP/PS1 mice.
AC Representative immunofluorescent staining of LC3B/p62/Beclin-1, NeuN, and DAPI in hippocampal neurons of mice. Scale bar = 100 μm. D Representative bands of LC3BII/LC3BI, p62, and Beclin-1 in the hippocampus of mice by western blot (WB) detection. EG Statistical analysis of LC3BII/LC3BI, p62, and Beclin-1 proteins in the hippocampus of mice. Data were presented as mean ± SD, n = 3/group. **p < 0.01 and ***p < 0.001 vs WT group, #p < 0.05, ##p < 0.01 and ###p < 0.001 vs APP/PS1 group.
Fig. 5
Fig. 5. AST promoted autophagosome formation and the initiation of autophagic lysosomal phase in hippocampal neurons of APP/PS1 mice.
AC Representative immunofluorescent staining of ATG5/ATG12/LAMP-1, NeuN, and DAPI in hippocampal neurons of mice. Scale bar = 100 μm. D, E Representative bands of ATG5, ATG12, and LAMP-1 in the hippocampus of mice by WB detection. FH Statistical analysis of ATG5, ATG12, and LAMP-1 proteins in the hippocampus of mice. Data were presented as mean ± SD, n = 3/group. **p < 0.01 vs WT group, #p < 0.05, ##p < 0.01 vs APP/PS1 group.
Fig. 6
Fig. 6. Effects of AST on the proliferation and apoptosis of Aβ25-35-damaged HT22 cells.
A Cell viability was detected in HT22 cells with different concentrations of Aβ25-35 (0–160 μM Aβ25-35, 24 h) by CCK8 assay. B Cell viability was detected in Aβ25-35-injured HT22 cells (20 μM Aβ25-35, 24 h) with different concentrations of AST (4 h before Aβ25-35 treatment) by CCK8 assay. C Cell viability was detected in HT22 cells with different concentrations of AST (0–160 μM AST, 24 h) by CCK8 assay. Data were presented as mean ± SD, *p < 0.05 vs 0 μM. D Effect of AST on the morphological alteration of HT22 cells was observed by immunofluorescent staining. E, F Flow cytometry analysis indicated the anti-apoptotic effect of AST on the apoptosis of HT22 cells. Data were presented as mean ± SD, n = 3/group. ***p < 0.001 vs control group, ##p < 0.01 vs AD group, @p < 0.05 vs AST + AD group.
Fig. 7
Fig. 7. The expressions of LC3BII/LC3BI, p62, Beclin-1, and LAMP-1 in HT22 cells were detected by Immunofluorescent staining and WB detection.
A Observation of LC3B, p62, Beclin-1, and LAMP-1 expression in HT22 cells by immunofluorescent staining, Scale bar = 100 μm. B Representative bands of LC3BII/LC3BI, p62, Beclin-1, and LAMP-1 in HT22 cells by WB detection. CF Statistical analysis of the corresponding LC3BII/LC3BI, p62, Beclin-1, and LAMP-1 protein bands. Data were presented as mean ± SD, n = 3/group. **p < 0.01 vs control group, ##p < 0.01 and ###p < 0.001 vs AD group, @@p < 0.01 and @@@p < 0.001 vs. AST + AD group. G Representative bands of LC3BII/LC3BI, p62, Beclin-1, and LAMP-1 were detected by WB after the administration of Baf A1 in AD cell model. HK Statistical analysis of the corresponding LC3BII/LC3BI, p62, Beclin-1, and LAMP-1 protein bands. Data were presented as mean ± SD, n = 3/group. **p < 0.01 vs AST + AD group.
Fig. 8
Fig. 8. AST pretreatment decreased the phosphorylation levels of PI3K, Akt, and mTOR in the AD cells group.
A Protein-protein interaction analysis of differently expressed autophagy-associated proteins using STRING database. B Representative bands of PI3K, p-PI3K, Akt, p-Akt, mTOR, and p-mTOR by WB detection in the HT22 cells. CE Statistical analysis of p-PI3K/PI3K, p-Akt/Akt, and p-mTOR/mTOR in HT22 cells. Data were presented as mean ± SD, n = 3/group. **p < 0.01 vs control group, #p < 0.05 and ##p < 0.01 vs AD group, @@p < 0.01 vs AST + AD group. F, G The expression levels of PI3K, p-PI3K, Akt, p-Akt, mTOR, and p-mTOR were detected by WB after the addition of Baf A1 or CQ in AD cell model. H, I Statistical analysis of p-PI3K/PI3K, p-Akt/Akt, and p-mTOR/mTOR in HT22 cells of each group. Data were presented as mean ± SD, n = 3/group. *p < 0.05, ***p < 0.01 and ***p < 0.001 vs AST + AD group. J The expression levels of LC3BII/LC3BI and p62 were detected by WB after the addition of MK2206 or rapamycin in Aβ25-35-injured HT22 cells. K, L Statistical analysis of the corresponding LC3BII/LC3BI and p62 protein bands. Data were presented as mean ± SD, n = 3/group. *p < 0.05, **p < 0.01 vs AD group.

References

    1. Lane CA, Hardy J, Schott JM. Alzheimer’s disease. Eur J Neurol. 2018;25:59–70. doi: 10.1111/ene.13439. - DOI - PubMed
    1. Rajan KB, Weuve J, Barnes LL, McAninch EA, Wilson RS, Evans DA. Population estimate of people with clinical Alzheimer’s disease and mild cognitive impairment in the United States (2020-2060) Alzheimers Dement. 2021;17:1966–75. doi: 10.1002/alz.12362. - DOI - PMC - PubMed
    1. Siemers ER, Sundell KL, Carlson C, Case M, Sethuraman G, Liu-Seifert H, et al. Phase 3 solanezumab trials: Secondary outcomes in mild Alzheimer’s disease patients. Alzheimers Dement. 2016;12:110–20. doi: 10.1016/j.jalz.2015.06.1893. - DOI - PubMed
    1. Plotkin SS, Cashman NR. Passive immunotherapies targeting Aβ and tau in Alzheimer’s disease. Neurobiol Dis. 2020;144:105010. doi: 10.1016/j.nbd.2020.105010. - DOI - PMC - PubMed
    1. Nakagawa R, Ohnishi T, Kobayashi H, Yamaoka T, Yajima T, Tanimura A, et al. Long-term effect of galantamine on cognitive function in patients with Alzheimer’s disease versus a simulated disease trajectory: an observational study in the clinical setting. Neuropsychiatr Dis Treat. 2017;13:1115–24. doi: 10.2147/NDT.S133145. - DOI - PMC - PubMed

LinkOut - more resources