Nuclear receptor modulators inhibit osteosarcoma cell proliferation and tumour growth by regulating the mTOR signaling pathway
- PMID: 36681687
- PMCID: PMC9867777
- DOI: 10.1038/s41419-022-05545-7
Nuclear receptor modulators inhibit osteosarcoma cell proliferation and tumour growth by regulating the mTOR signaling pathway
Erratum in
-
Correction: Nuclear receptor modulators inhibit osteosarcoma cell proliferation and tumour growth by regulating the mTOR signaling pathway.Cell Death Dis. 2025 Feb 10;16(1):86. doi: 10.1038/s41419-025-07409-2. Cell Death Dis. 2025. PMID: 39929815 Free PMC article. No abstract available.
Abstract
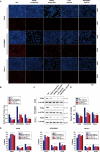
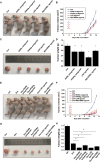
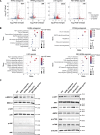
Osteosarcoma is the most common primary malignant bone tumour in children and adolescents. Chemoresistance leads to poor responses to conventional therapy in patients with osteosarcoma. The discovery of novel effective therapeutic targets and drugs is still the main focus of osteosarcoma research. Nuclear receptors (NRs) have shown substantial promise as novel therapeutic targets for various cancers. In the present study, we performed a drug screen using 29 chemicals that specifically target 17 NRs in several different human osteosarcoma and osteoblast cell lines. The retinoic acid receptor beta (RARb) antagonist LE135, peroxisome proliferator activated receptor gamma (PPARg) antagonist T0070907, liver X receptor (LXR) agonist T0901317 and Rev-Erba agonist SR9011 significantly inhibited the proliferation of malignant osteosarcoma cells (U2OS, HOS-MNNG and Saos-2 cells) but did not inhibit the growth of normal osteoblasts. The effects of these NR modulators on osteosarcoma cells occurred in a dose-dependent manner and were not observed in NR-knockout osteosarcoma cells. These NR modulators also significantly inhibited osteosarcoma growth in vivo and enhanced the antitumour effect of doxorubicin (DOX). Transcriptomic and immunoblotting results showed that these NR modulators may inhibit the growth of osteosarcoma cells by regulating the PI3K/AKT/mTOR and ERK/mTOR pathways. DDIT4, which blocks mTOR activation, was identified as one of the common downstream target genes of these NRs. DDIT4 knockout significantly attenuated the inhibitory effects of these NR modulators on osteosarcoma cell growth. Together, our results revealed that modulators of RARb, PPARg, LXRs and Rev-Erba inhibit osteosarcoma growth both in vitro and in vivo through the mTOR signaling pathway, suggesting that treatment with these NR modulators is a novel potential therapeutic strategy.
© 2023. The Author(s).
Conflict of interest statement
The authors declare no competing interests.
Figures


Similar articles
-
Highly-expressed P2X7 receptor promotes growth and metastasis of human HOS/MNNG osteosarcoma cells via PI3K/Akt/GSK3β/β-catenin and mTOR/HIF1α/VEGF signaling.Int J Cancer. 2019 Aug 15;145(4):1068-1082. doi: 10.1002/ijc.32207. Epub 2019 Mar 18. Int J Cancer. 2019. PMID: 30761524 Free PMC article.
-
Mechanism of miR-122-5p regulating the activation of PI3K-Akt-mTOR signaling pathway on the cell proliferation and apoptosis of osteosarcoma cells through targeting TP53 gene.Eur Rev Med Pharmacol Sci. 2020 Dec;24(24):12655-12666. doi: 10.26355/eurrev_202012_24163. Eur Rev Med Pharmacol Sci. 2020. PMID: 33378012
-
Calycosin, a Phytoestrogen Isoflavone, Induces Apoptosis of Estrogen Receptor-Positive MG-63 Osteosarcoma Cells via the Phosphatidylinositol 3-Kinase (PI3K)/AKT/Mammalian Target of Rapamycin (mTOR) Pathway.Med Sci Monit. 2018 Sep 5;24:6178-6186. doi: 10.12659/MSM.910201. Med Sci Monit. 2018. PMID: 30182951 Free PMC article.
-
mTOR: An attractive therapeutic target for osteosarcoma?Oncotarget. 2016 Aug 2;7(31):50805-50813. doi: 10.18632/oncotarget.9305. Oncotarget. 2016. PMID: 27177330 Free PMC article. Review.
-
Campaign to identify novel modulators of the Retinoic acid receptor-related Orphan Receptors (ROR).2009 Jan 3 [updated 2011 Mar 11]. In: Probe Reports from the NIH Molecular Libraries Program [Internet]. Bethesda (MD): National Center for Biotechnology Information (US); 2010–. 2009 Jan 3 [updated 2011 Mar 11]. In: Probe Reports from the NIH Molecular Libraries Program [Internet]. Bethesda (MD): National Center for Biotechnology Information (US); 2010–. PMID: 21735608 Free Books & Documents. Review.
Cited by
-
Gelatin-based biomaterials as a delivery strategy for osteosarcoma treatment.Front Pharmacol. 2025 Jan 28;16:1537695. doi: 10.3389/fphar.2025.1537695. eCollection 2025. Front Pharmacol. 2025. PMID: 39936088 Free PMC article. Review.
-
Pyroptosis and chemical classification of pyroptotic agents.Mol Divers. 2025 Jun;29(3):2765-2782. doi: 10.1007/s11030-024-10987-6. Epub 2024 Sep 24. Mol Divers. 2025. PMID: 39316325 Free PMC article. Review.
-
Leveraging diverse cell death patterns in osteosarcoma patients and identification of the function of FADS2 in osteosarcoma cells.Sci Rep. 2025 Jul 1;15(1):20831. doi: 10.1038/s41598-025-05480-5. Sci Rep. 2025. PMID: 40593006 Free PMC article.
-
The phosphatase CTDSPL2 promotes proliferation, invasion, metastasis and regorafenib resistance in osteosarcoma.J Bone Oncol. 2025 Apr 26;52:100684. doi: 10.1016/j.jbo.2025.100684. eCollection 2025 Jun. J Bone Oncol. 2025. PMID: 40352265 Free PMC article.
-
A telomere-related signature for predicting prognosis and assessing immune microenvironment in osteosarcoma.Front Pharmacol. 2025 Jan 27;15:1532610. doi: 10.3389/fphar.2024.1532610. eCollection 2024. Front Pharmacol. 2025. PMID: 39980969 Free PMC article.
References
-
- Kansara M, Teng MW, Smyth MJ, Thomas DM. Translational biology of osteosarcoma. Nat Rev Cancer. 2014;14:722–35. - PubMed
-
- Gill J, Gorlick R. Advancing therapy for osteosarcoma. Nat Rev Clin Oncol. 2021;18:609–24. - PubMed
-
- Casali PG, Bielack S, Abecassis N, Aro HT, Bauer S, Biagini R, et al. Bone sarcomas: ESMO-PaedCan-EURACAN Clinical Practice Guidelines for diagnosis, treatment and follow-up. Ann Oncol. 2018;29:iv79–iv95. - PubMed
Publication types
MeSH terms
Substances
LinkOut - more resources
Full Text Sources
Medical
Miscellaneous

