. 2023 Jan 21;14(1):351.
doi: 10.1038/s41467-023-35998-z.

Circular RNA circGlis3 protects against islet β-cell dysfunction and apoptosis in obesity

Affiliations

Circular RNA circGlis3 protects against islet β-cell dysfunction and apoptosis in obesity

Yue Liu et al. Nat Commun. .

Abstract

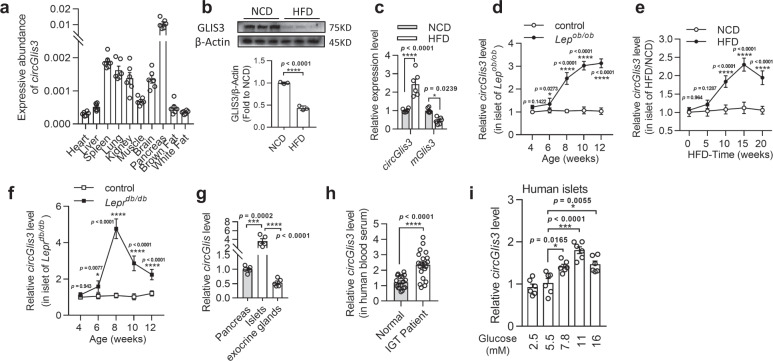
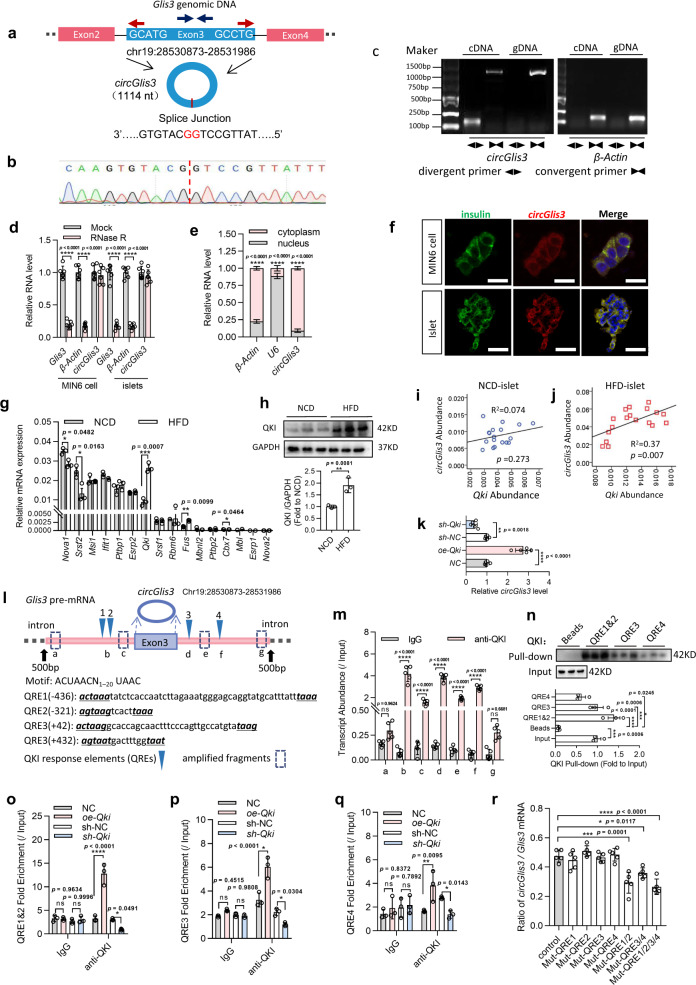
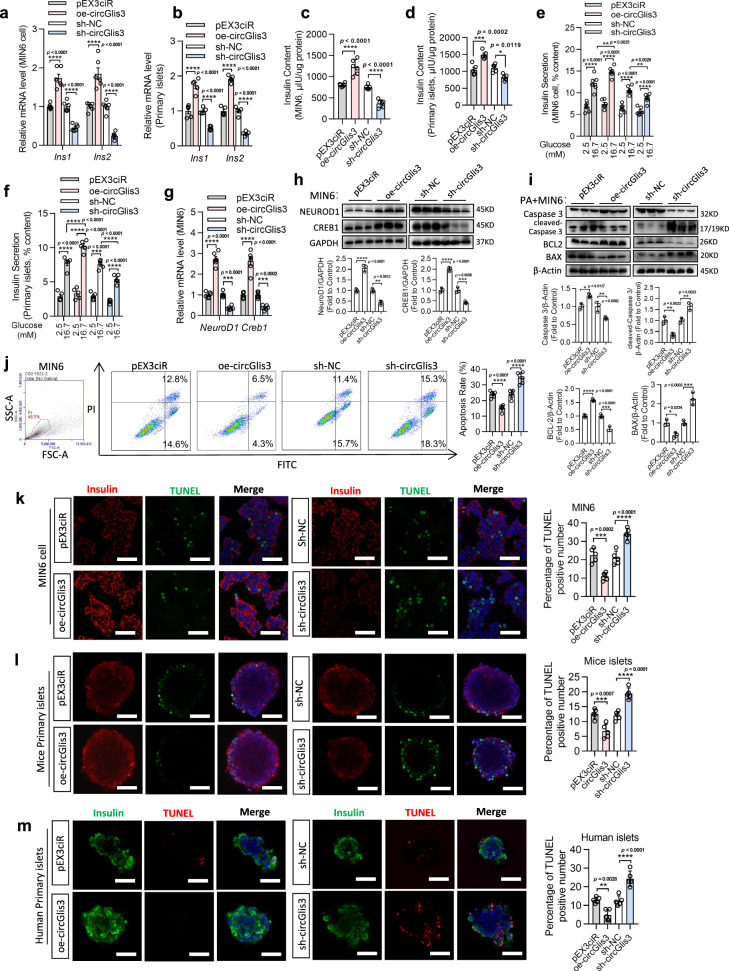
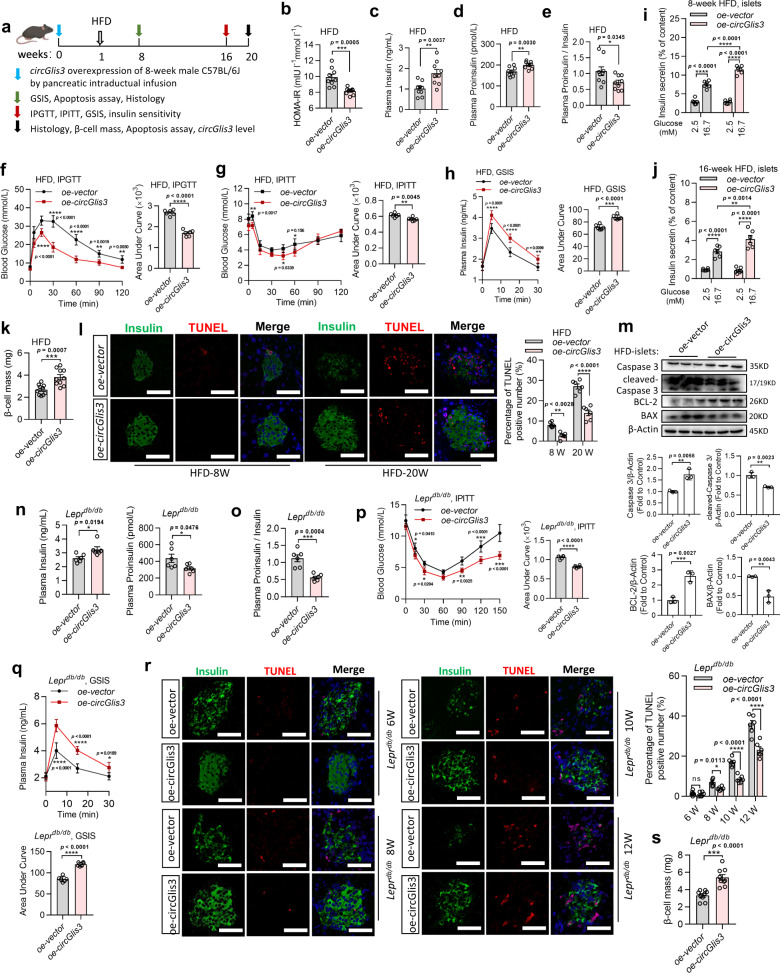
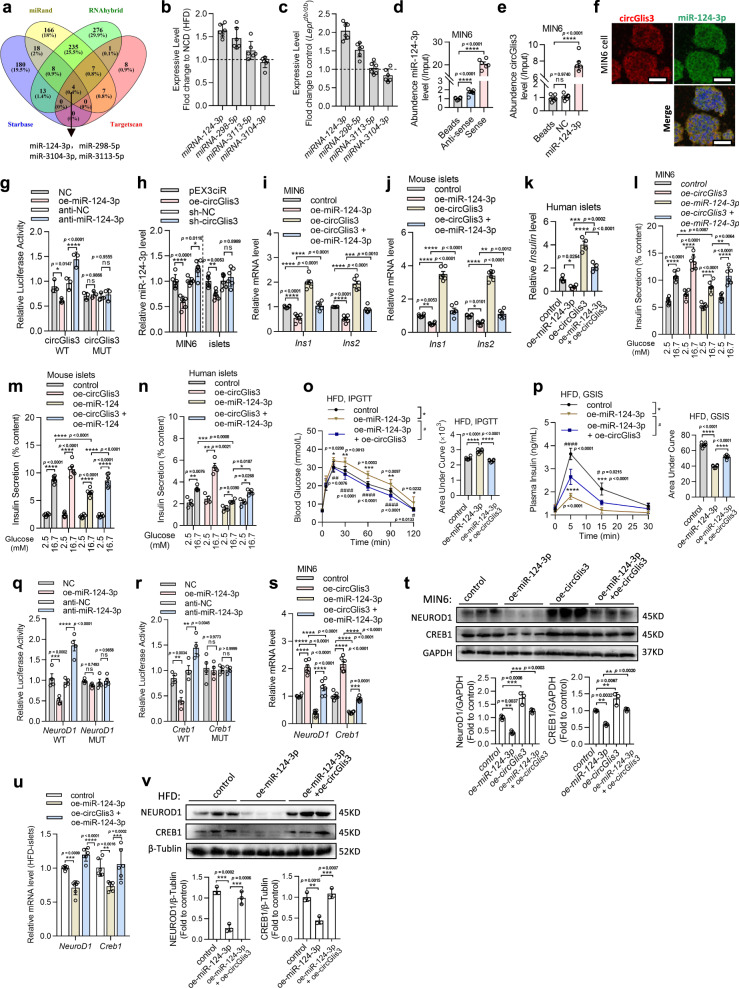
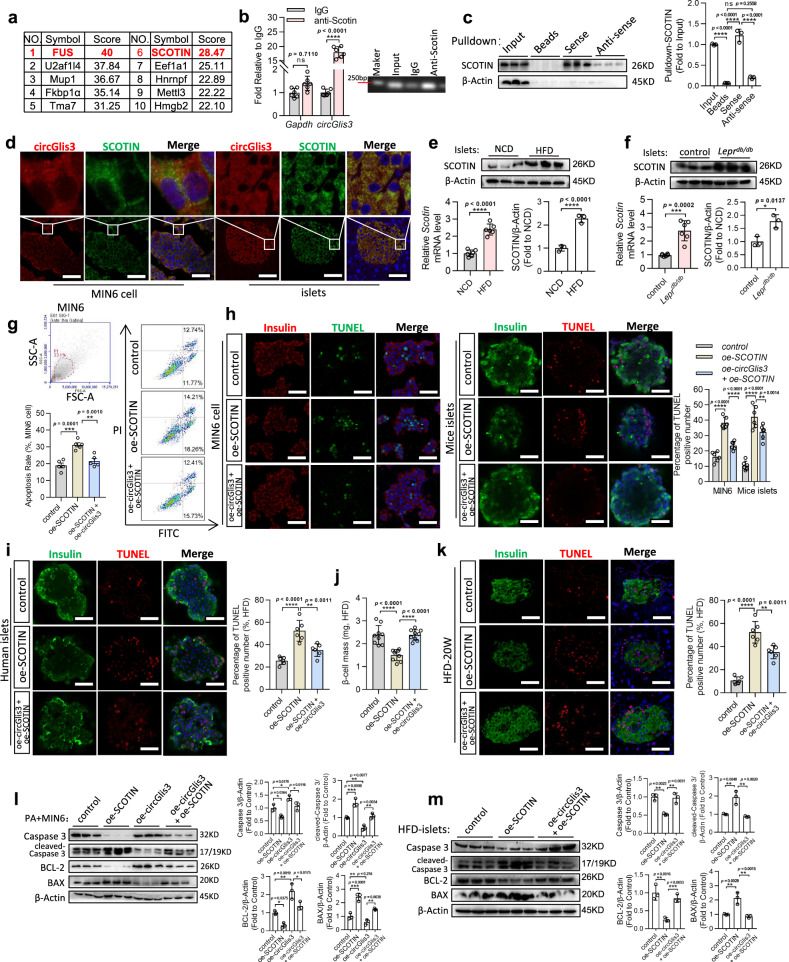
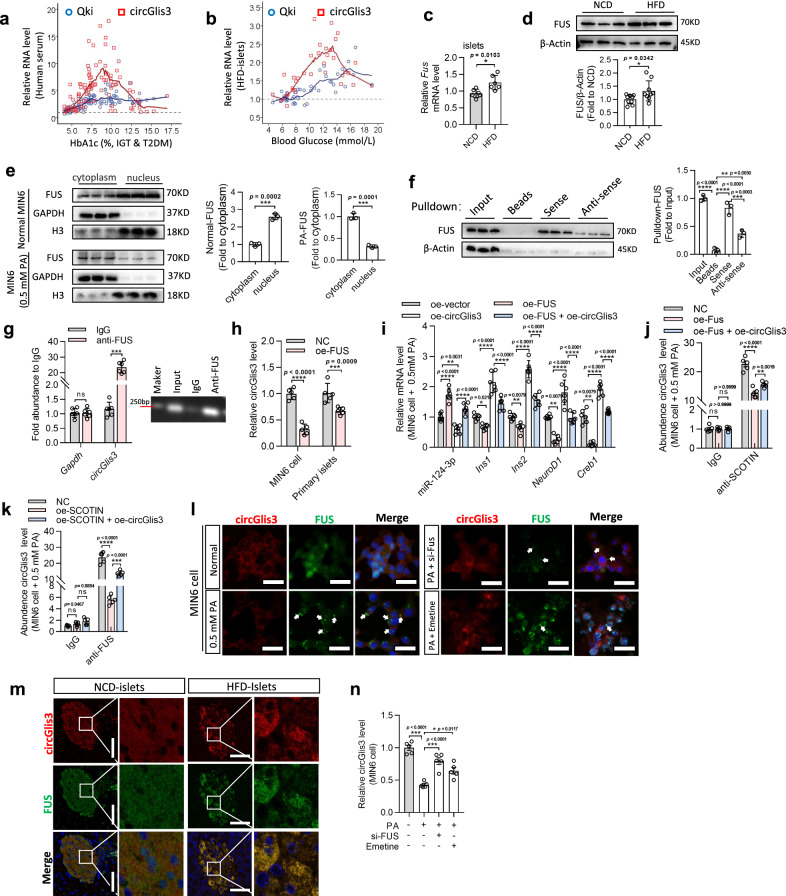
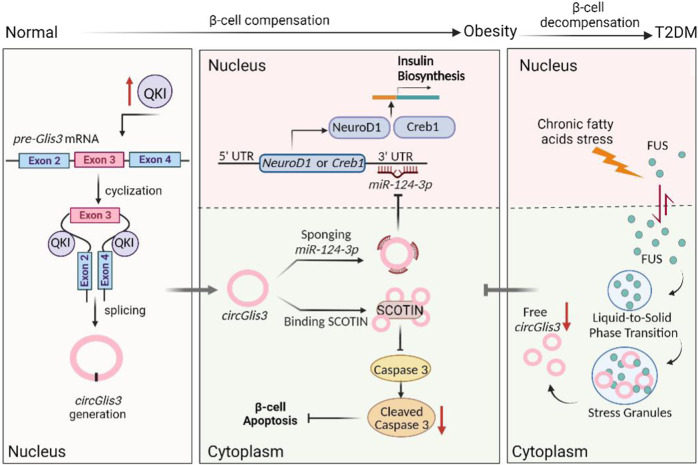
Pancreatic β-cell compensation is a major mechanism in delaying T2DM progression. Here we report the abnormal high expression of circGlis3 in islets of male mice with obesity and serum of people with obesity. Increasing circGlis3 is regulated by Quaking (QKI)-mediated splicing circularization. circGlis3 overexpression enhances insulin secretion and inhibits obesity-induced apoptosis in vitro and in vivo. Mechanistically, circGlis3 promotes insulin secretion by up-regulating NeuroD1 and Creb1 via sponging miR-124-3p and decreases apoptosis via interacting with the pro-apoptotic factor SCOTIN. The RNA binding protein FUS recruits circGlis3 and collectively assemble abnormal stable cytoplasmic stress granules (SG) in response to cellular stress. These findings highlight a physiological role for circRNAs in β-cell compensation and indicate that modulation of circGlis3 expression may represent a potential strategy to prevent β-cell dysfunction and apoptosis after obesity.


Conflict of interest statement

The authors declare no competing interests.

Figures

Fig. 1
Fig. 1. circGlis3 is upregulated in and is associated with obesity.
a RT-PCR analysis of circGlis3 expressive abundance. Compared to other tissues, circGlis3 is enriched in pancreas (n = 6 biological animals). b Western Blotting showing GLIS3 protein level in pancreas of the normal diet (NCD)- and high fat diet (HFD)-fed mice. c RT-PCR analysis of circGlis3 and Glis3 mRNA in pancreas of NCD- and HFD-fed mice (n = 6 biological animals). d RT-PCR analysis of circGlis3 expression in the islets of Lepob/ob mice aged from 4 to 12 weeks and HFD-fed mice from 0 to 20 weeks (e) and Leprdb/db mice aged from 4 to 12 weeks (f). (n = 6 biological subjects). g circGlis3 expression level in mouse islets and exocrine glands (n = 6 biological subjects). h. circGlis3 expression level in the sera of normal and patients with impaired glucose tolerance (IGT) (Normal individual n = 18, patients with IGT n = 21). i circGlis3 expression level in human islets exposed to different concentrations of glucose for 48 h (n = 5-6 biological subjects). ai For bar and line graphs, data represents mean ± SEM. a, b, h Unpaired two-tailed Student’s t-test. cf Two-way ANOVA with Bonferroni’s post-test. g, i One-way ANOVA with Tukey’s post-test. *p < 0.05, **p < 0.01, ***p < 0.001, ****p < 0.0001. Source data are provided as a Source data file.
Fig. 2
Fig. 2. Identification of circGlis3, and splicing factor QKI regulates formation of circGlis3.
a Circularization schematic of circGlis3 derived from exon3 of host gene Glis3. b Sequencing analysis of head-to-tail splicing junction in circGlis3. c circGlis3, along with β-Actin, were amplified from cDNA or gDNA from MIN6 cells with divergent and convergent primers by PCR assays, respectively (n = 3 independent experiments). d RT-PCR analysis of circGlis3 and β-Actin mRNA levels in MIN6 cells and primary islets with and without RNase R treatment (n = 6 biological replicates). e Subcellular fractionation of MIN6 cells and measurement of circGlis3 by RT-PCR analysis (n = 5 biological replicates). f RNA in situ hybridization against circGlis3 in MIN6 cells and islets (Red represents circGlis3, Green represents insulin, Blue represents DAPI). g Absolute quantification for various splicing factors in the islets of the NCD- and HFD-fed mice were measured by RT-PCR assays (n = 3 biological subjects). h Western Blots showing QKI protein in the islets of the NCD- and HFD-fed mice. i, j The correlation of circGlis3 and Qki mRNA abundance in the islets of the NCD- and HFD-fed mice (n = 18 biological animals). k The effect of ectopic expression of QKI on circGlis3 formation was confirmed by RT–PCR analysis (n = 6 biological replicates). l Schematic of Glis3 pre-mRNA showing the locations of four putative QKI response elements (QREs) (inverted blue triangles) and amplicons (ag) used for RNA-binding protein immunoprecipitation (RIP) assay, and sequence of QREs. Numbers in brackets refer to the distance from the circGlis3 forming splice site. m Fold enrichment of endogenous Glis3 intron fragments by QKI in MIN6 cells were detected by RIP and RT-PCR, the RT-PCR primers were designed and indicated in Fig. 2l, n = 6 biological replicates. n Biotin-labeled Glis3 intron fragments containing QREs were used for RNA-QKI pulldown against MIN6 cells lysate, and Western Blotting showing QKI was pulled down. oq RIP and RT-PCR assays were used to measure the QRE1&2, QRE3, QRE4 fold enrichment (n = 3 biological replicates). r Effect of mutations to the QREs on the ratio of circRNA to linear mRNA, as determined by ratios of Absolute quantification by RT-PCR assays (n = 6 biological replicates). de, gk, mr For bar and line graphs, data represents mean ± SEM. h Unpaired two-tailed Student’s t-test. k, n, r One-way ANOVA with Tukey’s post-test. d, e, g, m, oq Two-way ANOVA with Bonferroni’s post-test. i, j Pearson correlation and regression analysis. *p < 0.05, **p < 0.01, ***p < 0.001, ****p < 0.0001. Source data are provided as a Source data file.
Fig. 3
Fig. 3. Upregulation of circGlis3 promotes insulin transcription and secretion, and inhibits β-cell apoptosis in vitro.
a Expression of Ins2 and Ins2 mRNA in MIN6 cells (n = 6 biological replicates) and mouse islets (n = 5 biological subjects) with circGlis3 overexpression and knockdown. c, d Insulin content in MIN6 cells (n = 6 biological replicates) and mouse islets (n = 5 biological subjects) with circGlis3 overexpression and knockdown. e, f Insulin secretion in glucose (2.5 mM and 16.7 mM) stimulated MIN6 cells (n = 6 biological replicates) and mouse islets (n = 5 biological subjects). g, h NeuroD1 and Creb1 mRNA and protein levels in MIN6 cells with circGlis3 overexpression and knockdown (n = 6 biological replicates). i Western Blotting showing Pro-CASPASE 3, Cleaved-CASPASE 3, BAX, and BCL-2 proteins in MIN6 cells with circGlis3 overexpression and knockdown. j Annexin V/PI staining and flow cytometry analysis of cell apoptosis in MIN6 cells with circGlis3 overexpression and knockdown (n = 5 biological replicates). km TUNEL assays and statistic results of cell apoptosis in MIN6 cells (Red represents Insulin, Green represents positive TUNEL cells; Scale bars represent 50 μm), mouse islets (Red represents Insulin, Green represents positive TUNEL cells; Scale bars represent 100 μm), and human islets (Red represents positive TUNEL cells, Green represents Insulin; Scale bars represent 100 μm) with circGlis3 overexpression and knockdown (n = 5-6 biological replicates). am For bar graphs, data represents mean ± SEM. a, b, eg Two-way ANOVA with Bonferroni’s post-test. c, d, hm One-way ANOVA with Tukey’s post-test. *p < 0.05, **p < 0.01, ***p < 0.001, ****p < 0.0001. Source data are provided as a Source data file.
Fig. 4
Fig. 4. Overexpression of circGlis3 protects against β-cell dysfunction and apoptosis in vivo.
a The time pattern of oe-circGlis3-vector injection and HFD feeding (n  =  12 biological animals). b homeostasis model assessment of insulin resistance (HOMA-IR) of the negative control and oe-circGlis3-treated HFD-fed mice (n = 9 biological animals). HOMA-IR was calculated as HOMA-IR = (FBG (mmol/L)×FINS (mIU/L))/22.5. ce The fasting insulin, proinsulin and proinsulin-to-insulin ratio values in fasting serum levels of the negative control and oe-circGlis3-treated HFD-fed mice (n = 9 biological animals). f, g Intraperitoneal glucose tolerance test (IPGTT) (2 g/kg) and intraperitoneal insulin tolerance test (IPITT) (1 U/kg) were performed in the overnight fasted HFD-fed mice (n = 6 biological animals). The corresponding area under the curve (AUC) was calculated. h in vivo glucose-stimulated insulin secretion (GSIS) were performed in the overnight fasted HFD-fed mice (n = 9 biological animals). The corresponding area under the curve (AUC) was calculated. i, j Insulin secretion in glucose (2.5 mM and 16.7 mM) stimulated islets from mice with HFD-fed for 8 weeks and 16 weeks (n = 6 biological subjects). k β-cell mass in the negative control and oe-circGlis3-treated HFD-fed mice (n = 10 biological animals). l TUNEL assays of pancreatic sections from negative control and oe-circGlis3-treated mice with HFD-fed for 8 weeks and 20 weeks (Red represents positive TUNEL cells, Green represents Insulin; Scale bars represent 100 μm). m Western Blotting showing Pro-Caspase 3, Cleaved-CASPASE 3, BAX, and BCL-2 proteins in islets of the negative control and oe-circGlis3-treated HFD-fed mice. n, o The fasting insulin, proinsulin and proinsulin-to-insulin ratio values in fasting serum levels of the negative control and oe-circGlis3-treated Leprdb/db mice (n = 6 biological animals). p IPITT (1.5 U/kg) performed in overnight fasted Leprdb/db mice (n = 6 biological animals). The corresponding area under the curve (AUC) was calculated. q in vivo GSIS (1.5 g/kg body weight) were performed in overnight fasted Leprdb/db mice (n = 6-9 biological animals). The corresponding area under the curve (AUC) was calculated. r TUNEL assays of pancreatic sections from the negative control and oe-circGlis3-treated Leprdb/db mice at age from 6 to 12 weeks (Red represents positive TUNEL cells, Green represents Insulin; Scale bars represent 50 μm). s β-cell mass in the negative control and oe-circGlis3-treated Leprdb/db mice (n = 9 biological animals). bs For bar and line graphs, data represents mean ± SEM. be, k, mo, s Unpaired two-tailed Student’s t-test. i, j, l, r Two-way ANOVA with Bonferroni’s post-test. fh, pq One-way ANOVA with Tukey’s post-test and Unpaired two-tailed Student’s t-test. *p < 0.05, **p < 0.01, ***p < 0.001, ****p < 0.001. Source data are provided as a Source data file.
Fig. 5
Fig. 5. circGlis3 regulates insulin transcription by targeting and sponging miR-124-3p.
a Schematic illustration showing the overlap of the target miRNAs of circGlis3 predicted by StarBase, miRanda, RNAhybrid and TargetScan databases. b, c The relative levels of four miRNA candidates in islets from HFD-fed mice and Lepob/ob mice were detected by RT-PCR (n = 6 biological animals). d.RNA pulldown and RT-qPCR assay showing affinity pulldown of endogenous miRNAs by biotin-labeled circGlis3 sense or anti-sense (n = 6 biological replicates). e RNA pulldown and RT-PCR assay showing the amount of endogenous circGlis3 pulled down by biotin-labeled miR-124-3p (n = 6 biological replicates). f miR-124-3p and circGlis3 were colocalized in the cytoplasm (Red represents circGlis3, Green represents miR-124-3p, Scale bars represent 20 μm). g circGlis3 wild type (WT) and circGlis3 mutant type (MUT) sequence were cloned into the 3’-UTR of the pMIR-REPORT Luciferase reporter, and transfection miR-124-3p mimic repressed the reporter activity of pMIR-circGlis3-WT, and such repression could be restored by anti-miR-124-3p (n = 3 biological replicates). h RT-PCR analysis of miR-124-3p expression in MIN6 cells (n = 6 biological replicates) and islets (n = 6 biological subjects) with circGlis3 overexpression and knockdown. i, j RT-PCR analysis of Ins1 and Ins2 mRNA expression in the MIN6 cells (n = 6 biological replicates) and islets with oe-miR-124-3p or/and oe-circGlis3 treatment (n = 6 biological subjects). k RT-PCR analysis of Insulin gene level in human islets (n = 4 biological subjects) with oe-miR-124-3p or/and oe-circGlis3 treatment. l, m Insulin secretion in MIN6 cells (n = 6 biological replicates) and islets (n = 6 biological subjects) with oe-miR-124-3p or/and oe-circGlis3 treatment. n Insulin secretion in human islets with oe-miR-124-3p or/and oe-circGlis3 treatment (n = 4 biological subjects). o, p IPGTT and in vivo GSIS were performed in the overnight fasted HFD-fed mice with oe-miR-124-3p or/and oe-circGlis3 treatment (n = 6 biological animals). The corresponding AUC was calculated. q, r Relative luciferase activity of the pMIR-REPORT constructs containing either the WT or MUT 3’-UTR of the NeuroD1 and Creb1 (n = 3 biological replicates). s, t NeuroD1 and Creb1 mRNA and protein expression levels in MIN6 cells with oe-miR-124-3p or/and oe-circGlis3 treatment (n = 6 biological replicates). u, v. NeuroD1 and Creb1 mRNA and protein expression levels in the islets of the HFD-fed mice with oe-miR-124-3p or/and oe-circGlis3 treatment (n = 6 biological subjects). be, gv For bar and line graphs, data represents mean ± SEM. be, h, k, t, v One-way ANOVA with Tukey’s post-test. g, ij, ln, qs, u Two-way ANOVA with Bonferroni’s post-test. op One-way ANOVA with Tukey’s post-test and Unpaired two-tailed Student’s t-test. *p < 0.05, **p < 0.01, ***p < 0.001, ****p < 0.0001 versus control group; #p < 0.05, ##p < 0.01, ###p < 0.001, ####p < 0.0001 versus oe-miR-124-3p treated group. Source data are provided as a Source data file.
Fig. 6
Fig. 6. circGlis3 prevents β-cell apoptosis by directly binding to SCOTIN.
a The mass spectrometry assay revealing the proteins (score > 20 by Mascot Software) pulled down by biotin-labeled circGlis3 from the MIN6 cells lysate. b The endogenous circGlis3 interacting with SCOTIN in MIN6 cells were detected by RIP assay and RT-PCR (n = 6 biological replicates). c Biotin-labeled sense or anti-sense circGlis3 were used for circGlis3-protein pulldown against MIN6 cells lysate, and Western Blotting showing that SCOTIN was pulled down. d Colocalization between circGlis3 and SCOTIN in MIN6 cell (Red represents circGlis3, Green represents SCOTIN, Scale bars represent 50 μm, n = 5 biological replicates) and pancreas sections (Scale bars represent 100 μm, n = 5 biological subjects) by circRNA fluorescent in situ hybridization (circFISH) and Immunofluorescence assays. e, f RT-PCR analysis and Western Blotting results of Scotin mRNA and protein level in the islets from the HFD-fed mice and Leprdb/db mice (n = 6 biological subjects). g Annexin V/PI staining and flow cytometry analysis of cell apoptosis in MIN6 cells with oe-circGlis3 or/and oe-SCOTIN treatment (n = 5 biological replicates). h TUNEL assays in MIN6 cell (Red represents positive TUNEL cells, Green represents Insulin; Scale bars represent 100 μm; n = 5 biological replicates) and mice islets (Red represents Insulin, Green represents positive TUNEL cells; Scale bars represent 50 μm; n = 5 biological subjects) with oe-circGlis3 or/and oe-SCOTIN treatment. i. TUNEL assays in human islets (Red represents positive TUNEL cells, Green represents Insulin; Scale bars represent 100 μm) with oe-circGlis3 or/and oe-SCOTIN treatment (n = 5 biological subjects). j β-cell mass in oe-circGlis3 or/and oe-SCOTIN treated HFD-fed mice (n = 6 biological animals). k TUNEL assays in pancreatic sections of oe-circGlis3 or/and oe-SCOTIN treated mice with HFD-fed for 20 weeks (Red represents positive TUNEL cells, Green represents Insulin; Scale bars represent 100 μm; n = 5 biological animals). l, m Western Blotting showing Caspase 3, cleaved-Caspase 3, BAX, and BCL-2 in palmitate-stimulated MIN6 cell and islets of the HFD-fed mice, both with oe-circGlis3 or/and oe-SCOTIN treatment, respectively. b, c, em For bar graphs, data represents mean ± SEM. b, c, gm One-way ANOVA with Tukey’s post-test. e, f Unpaired two-tailed Student’s t-test. *p < 0.05, **p < 0.01, ***p < 0.001. Source data are provided as a Source data file.
Fig. 7
Fig. 7. FUS sequestrates circGlis3 to reduce its abundance in diabetes by assembling cytoplasmic SG.
a Expression of circGlis3 and Qki mRNA in patients with IGT or type 2 diabetes mellitus (T2DM) (n = 98 human individuals). b Expression of circGlis3 and Qki mRNA in HFD-fed mice with obesity or T2DM (n = 40 biological animals). c RT-PCR analysis of FUS mRNA expression in islets of the NCD- and HFD-fed mice (n = 6 biological subjects). d Western Blotting showing FUS protein expression in islets of the NCD- and HFD-fed mice. e Western Blotting showing FUS shuttle between the nucleus and cytoplasm in responses to palmitate stress in MIN6 cells. f Biotin-labeled sense or anti-sense circGlis3 were used for RNA-protein pulldown against MIN6 cells lysate, and Western Blotting showing that FUS was pulled down. g The endogenous circGlis3 interacting with FUS in MIN6 cells were detected by RIP assay and RT-PCR (n = 6 biological replicates). h RT-PCR analysis of circGlis3 expression in MIN6 cells (n = 6 biological replicates) and islets with FUS overexpression (n = 5 biological subjects). i RT-PCR analysis of miR-124-3p, Ins1, Ins2, NeuroD1 and Creb1 mRNA in MIN6 cells with FUS and circGlis3 overexpression (n = 6 biological replicates). j RIP and RT-PCR assay analyzed fold enrichment of endogenous circGlis3 by SCOTIN in palmitate-stimulated and oe-FUS-treated MIN6 cells (n = 6 biological replicates). k RIP and RT-PCR assay analyzed fold enrichment of endogenous circGlis3 by FUS in palmitate-stimulated and oe-SCOTIN-treated MIN6 cells (n = 6 biological replicates). l Colocalization between circGlis3 and FUS-stress granules (FUS-SG) in the palmitate-stimulated MIN6 cells with si-Fus and Emetine treatment (Red represents circGlis3, Green represents FUS; Scale bars represent 20 μm, n = 5 biological replicates). m. Colocalization between circGlis3 and FUS-SG in islets of the HFD-fed mice (Red represents circGlis3, Green represents FUS; Scale bars represent 100 μm, n = 6 biological animals). n. RT-PCR analysis of circGlis3 level in the palmitate-stimulated MIN6 cells with si-FUS and Emetine treatment (n = 6 biological replicates). ck, n For bar graphs, data represents mean ± SEM. a, b LOESS Curve Fitting, 35% of points to fit. ce Unpaired two-tailed Student’s t-test. f, n One-way ANOVA with Tukey’s post-test. gk Two-way ANOVA with Bonferroni’s post-test. *p < 0.05, **p < 0.01, ***p < 0.001, ****p < 0.0001. Source data are provided as a Source data file.
Fig. 8
Fig. 8. A working model that illustrates the mechanism by which circGlis3 regulates β-cell function.
circGlis3 is regulated by QKI-mediated splicing and increases in individuals with obesity and moderately diabetes, while it decreases when diabetes occurs via FUS-formed SG. circGlis3 functions in β-cell compensation through regulating insulin transcription and apoptosis by sponging miR-124-3p and directly binding SCOTIN provide a potential therapeutic angle.

Similar articles

Cited by

References

    1. James, E. et al. NCD Countdown 2030: worldwide trends in non-communicable disease mortality and progress towards Sustainable Development Goal target 3.4. Lancet392, 1072–1088 (2018). - PubMed
    1. Ismail L, Materwala H, Al Kaabi J. Association of risk factors with type 2 diabetes: a systematic review. Comput Struct. Biotechnol. J. 2021;19:1759–1785. doi: 10.1016/j.csbj.2021.03.003. - DOI - PMC - PubMed
    1. Ahlqvist E, et al. Novel subgroups of adult-onset diabetes and their association with outcomes: a data-driven cluster analysis of six variables. Lancet Diabetes Endocrinol. 2018;6:361–369. doi: 10.1016/S2213-8587(18)30051-2. - DOI - PubMed
    1. Mezza T, et al. Beta-cell fate in human insulin resistance and Type 2 diabetes: a perspective on islet plasticity. Diabetes. 2019;68:1121–1129. doi: 10.2337/db18-0856. - DOI - PMC - PubMed
    1. Butler AE, Janson J, Soeller WC, Butler PC. Increased beta-cell apoptosis prevents adaptive increase in beta-cell mass in mouse model of type 2 diabetes: evidence for role of islet amyloid formation rather than direct action of amyloid. Diabetes. 2003;52:2304–2314. doi: 10.2337/diabetes.52.9.2304. - DOI - PubMed

Publication types