. 2023 Jan 21;14(1):348.
doi: 10.1038/s41467-023-35963-w.

Jag1-Notch cis-interaction determines cell fate segregation in pancreatic development

Affiliations

Jag1-Notch cis-interaction determines cell fate segregation in pancreatic development

Xiaochan Xu et al. Nat Commun. .

Abstract

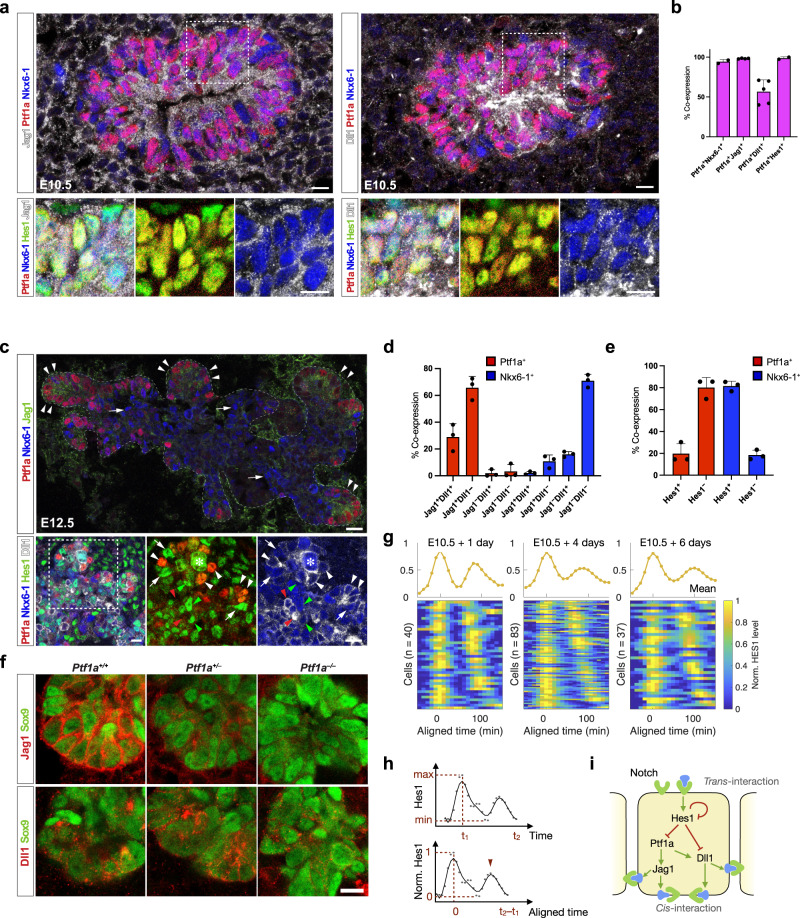
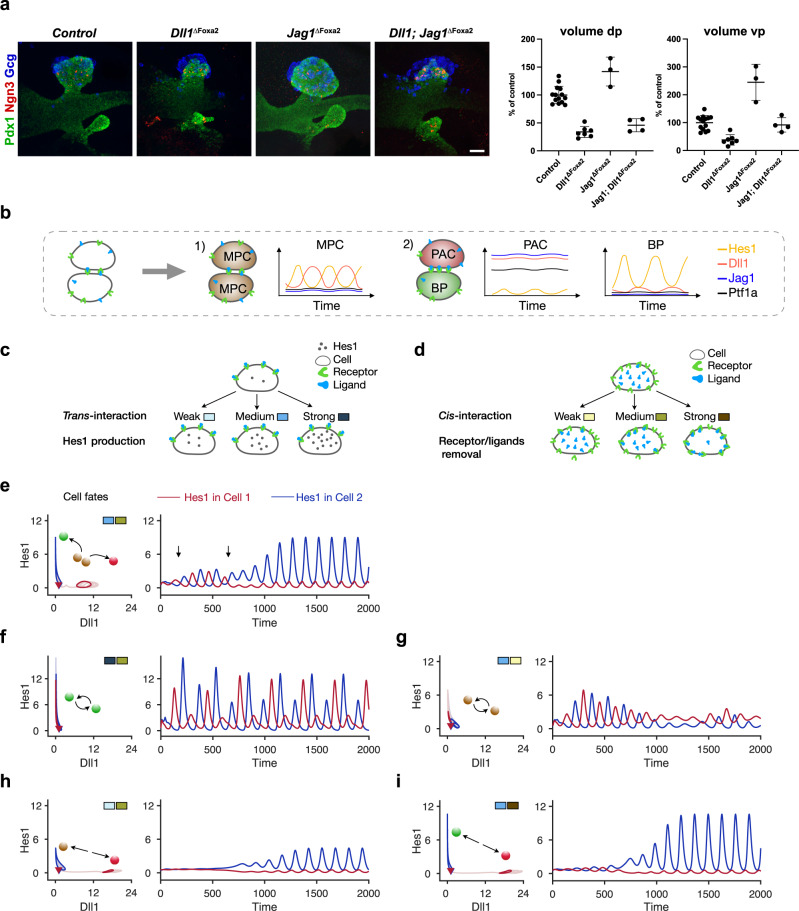
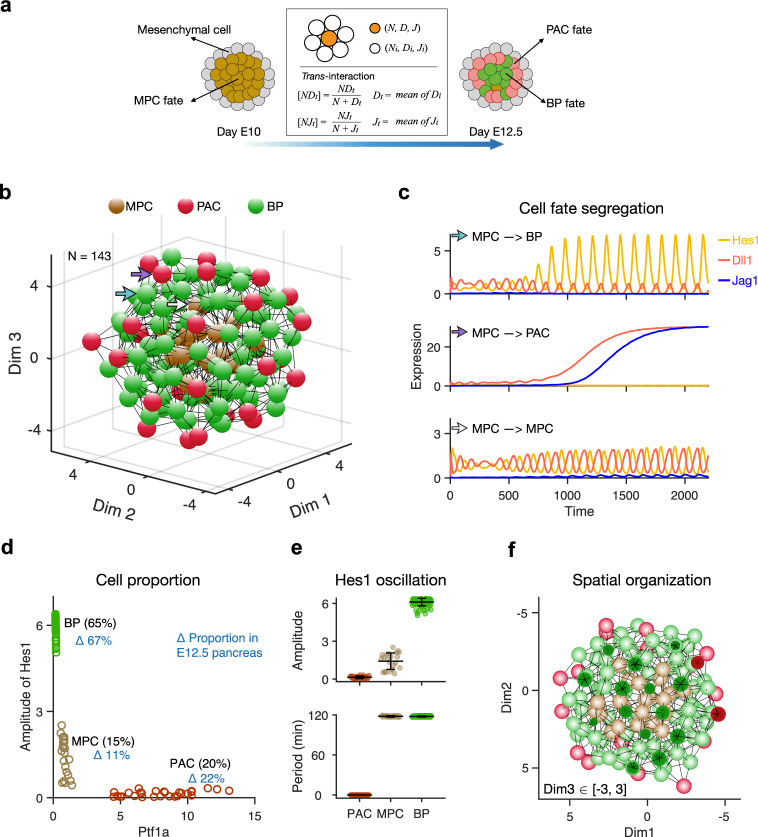
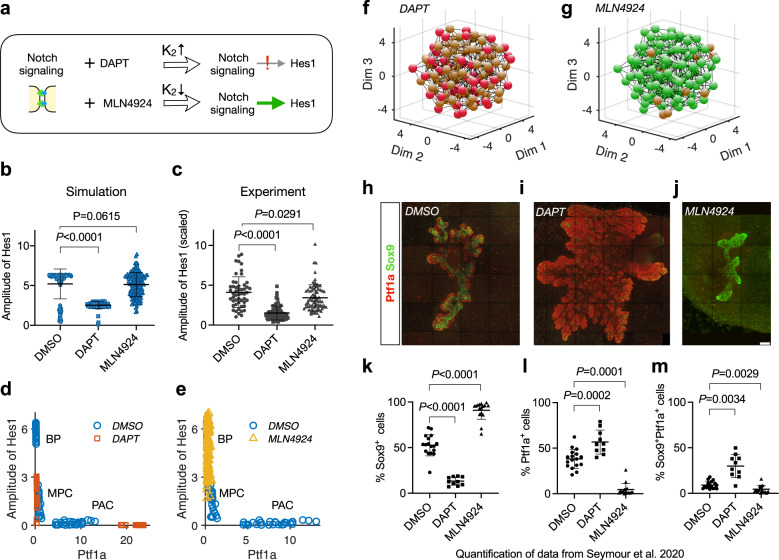
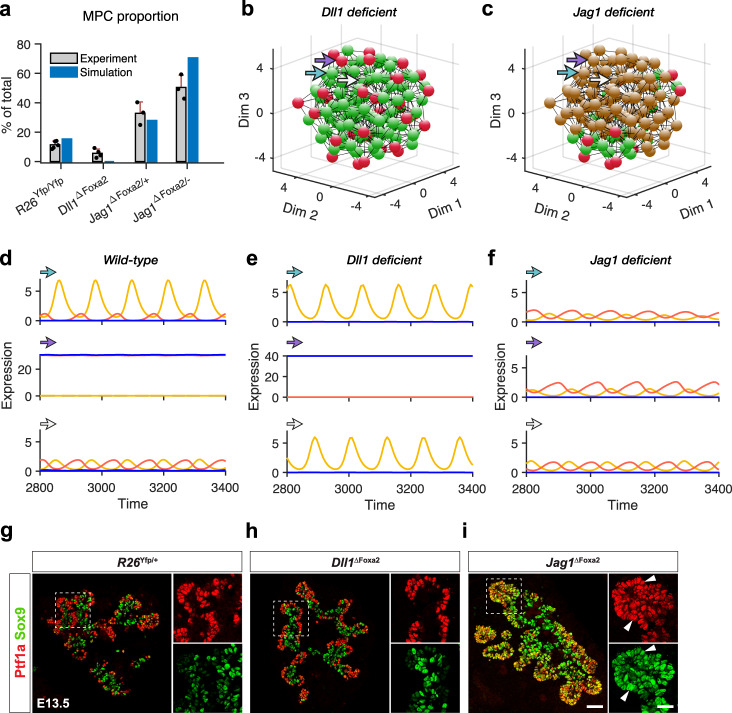
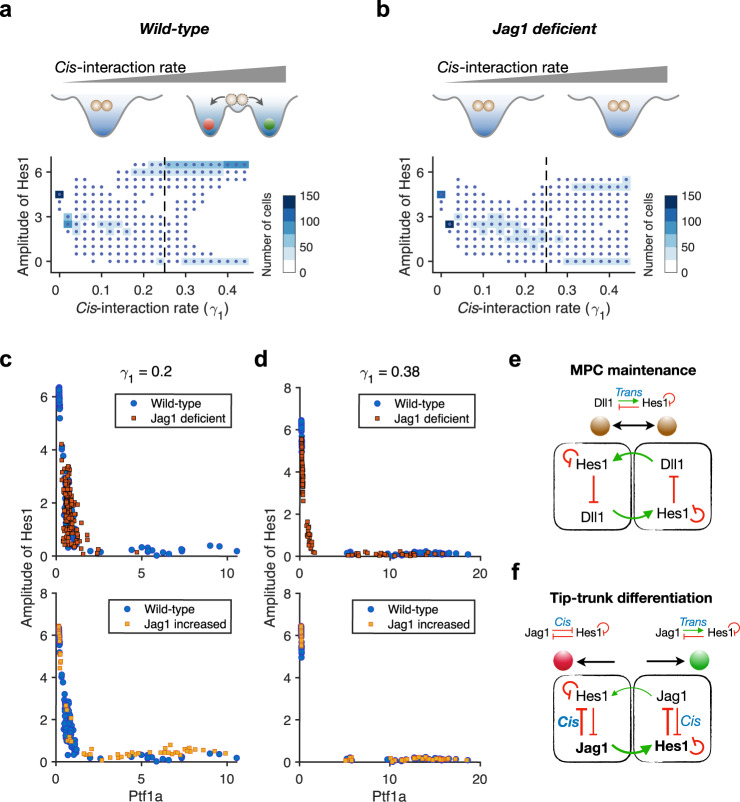
The Notch ligands Jag1 and Dll1 guide differentiation of multipotent pancreatic progenitor cells (MPCs) into unipotent pro-acinar cells (PACs) and bipotent duct/endocrine progenitors (BPs). Ligand-mediated trans-activation of Notch receptors induces oscillating expression of the transcription factor Hes1, while ligand-receptor cis-interaction indirectly represses Hes1 activation. Despite Dll1 and Jag1 both displaying cis- and trans-interactions, the two mutants have different phenotypes for reasons not fully understood. Here, we present a mathematical model that recapitulates the spatiotemporal differentiation of MPCs into PACs and BPs. The model correctly captures cell fate changes in Notch pathway knockout mice and small molecule inhibitor studies, and a requirement for oscillatory Hes1 expression to maintain the multipotent state. Crucially, the model entails cell-autonomous attenuation of Notch signaling by Jag1-mediated cis-inhibition in MPC differentiation. The model sheds light on the underlying mechanisms, suggesting that cis-interaction is crucial for exiting the multipotent state, while trans-interaction is required for adopting the bipotent fate.


Conflict of interest statement

The authors declare no competing interests.

Figures

Fig. 1
Fig. 1. Expression patterns of proteins associated with cell fate segregation in pancreatic development.
a Left: Section of E10.5 dorsal pancreas stained for Jag1 (white), Hes1 (green), Ptf1a (red), and Nkx6-1 (blue). Insets show enlarged views of the boxed area. Note overlapping expression of Hes1, Jag1, Ptf1a, and Nkx6-1 in most cells. Right: Section of E10.5 dorsal pancreas stained for Dll1 (white), Hes1 (green), Ptf1a (red), and Nkx6-1 (blue). Insets show enlarged views of the boxed area. Note the heterogeneous expression of Dll1. Scale bars: 10 μm. b Quantification of Nkx6-1, Jag1, Dll1 and Hes1 co-expression in E10.5 Ptf1a+ epithelial cells. Mean+SD. N = 2, 4 and 5 embryos as indicated by the dot plots. c Top panel: Section of E12.5 dorsal pancreas stained for Ptf1a (red), Nkx6-1 (blue) and Jag1 (green). The dashed line encircles the epithelium. Arrowheads point at Jag1+Ptf1a+ tip cells and arrows at Jag1-Nkx6-1+ trunk cells. Scale bar: 20 μm. Bottom panels: Section of E12.5 dorsal pancreas stained for Ptf1a (red), Nkx6-1 (blue), Hes1 (green) and Dll1 (white). Note that peripheral Dll1Hi cells are typically Hes1LoPtf1a+Nkx6-1Lo/- (white arrowheads). Conversely, peripheral Dll1Lo cells are typically Hes1HiPtf1a-Nkx6-1+ (white arrows). More centrally, Dll1Hi cells are typically Hes1LoPtf1a-Nkx6-1+ (red arrowheads), while Dll1Lo cells are typically Hes1HiPtf1a-Nkx6-1+, as also seen in the periphery (green arrowheads). * indicates mitotic cell. Scale bar: 10 μm. The experiment was repeated with the same result on four embryos. d Quantification of Dll1 and Jag1 co-expression in E12.5 Ptf1a+ (red bars) and Nkx6-1+ (blue bars) epithelium. Mean+SD. N = 3 embryos. e Quantification of Hes1 co-expression in E12.5 Ptf1a+ (red bars) and Nkx6-1+ (blue bars) epithelium. Mean+SD. N = 3 embryos. f Expression of Jag1 and Dll1 ligands as indicated (red) in Sox9+ pancreas epithelium (green) in E12.5 wild type as well as heterozygous and homozygous Ptf1a mutant embryos. Scale bar: 10 μm. The experiment was repeated with the same result on two sets of embryos. g Oscillatory Hes1 expression during MPC differentiation. The luminescence values of the tracked cells were measured every 10 min and followed for more than 150 min. Each row of the heatmaps represents one cell’s dynamic. The curves above represent the mean of the normalized values at each time point. h Example for normalization of Hes1 expression in one individual cell. The absolute luminescence value is linearly scaled between its minimum and maximum after the background values were subtracted. The time of each cell is aligned according to the first peak. i Core gene regulatory network (GRN) motif of MPC differentiation including trans-interaction and cis-interaction. The GRN includes five variables where Hes1 inhibits itself, Ptf1a and Dll1 whereas Ptf1a promotes both Jag1 and Dll1.
Fig. 2
Fig. 2. Trans-interaction maintains MPC state and cis-interaction benefits cell fate segregation.
a 3D maximum intensity projections and pancreatic bud volume quantification of E10.5 Dll1ΔFoxa2, Jag1ΔFoxa2, and Dll1; Jag1ΔFoxa2 embryos compared to littermate controls. Embryos were stained for Pdx1 (green), Ngn3 (red), and Gcg (blue) by whole-mount IF. Scale bar: 50 μm. dp: dorsal pancreas; vp: ventral pancreas. Quantification is shown as mean ± SD, N = 14 control-, N = 7 Dll1 mutant-, N = 3 Jag1 mutant-, N = 4 Jag1; Dll1 mutant-embryos. Statistical significance: dp: Dll1ΔFoxa2: p < 0.0001 vs Control; Jag1ΔFoxa2: p = 0.0012 vs Control; Dll1; Jag1ΔFoxa2: p < 0.0001 vs Control, p < 0.0001 vs Jag1ΔFoxa2, p = 0.5934 vs Dll1ΔFoxa2. vp: Dll1ΔFoxa2: p = 0.0007 vs Control; Jag1ΔFoxa2: p < 0.0001 vs Control; Dll1; Jag1ΔFoxa2: p = 0.9633 vs Control, p <0.0001 vs Jag1ΔFoxa2, p = 0.0352 vs Dll1ΔFoxa2. One-way ANOVA with Tukey’s post-hoc test for multiple comparisons. b Schematic diagram of the two-cell system and gene expression pattern in different cell fates. c Schematic diagram of the trans-interaction strength within the two-cell model. With the same intercellular binding activity of receptor and ligand, the cell increases its Hes1 production when trans-interaction strength changes from weak to strong. d Schematic diagram of the cis-interaction strength within the two-cell model. The receptors and ligands are removed with an increased rate when the cis-interaction strength changes from weak to strong. e Cell fate segregation happens after temporal MPC fate with medium trans-interaction. The cells bifurcate into two states with low Dll1: high Hes1 or high Dll1: low Hes1 (left). The transient MPC state characterized by anti-phase oscillations with an intermediate amplitude of Hes1 is indicated with the arrows (right). f Cell fate segregation is blocked with strong trans-interaction for two cells. Hes1 and Dll1 oscillate inside the cells (left) indicating the cells maintain BP states, and Hes1 oscillates in anti-phase between the BP cells (right). g Cell fate segregation is blocked with weak cis-interaction for two cells. h Cell fate segregation happens bypassing the MPC fate with weak trans-interaction. The cells directly bifurcate into low Dll1: high Hes1 and high Dll1: low Hes1 states. i Cell fate segregation happens with strong cis-interaction. In (e-i), balls indicate final cell fates for two cells, red: PAC, green: BP, and brown: MPC; color coded rectangles indicate the strength of trans- and cis-interaction as shown in (c) and (d). With corresponding blue or red color, the cells' initial conditions (triangles), dynamic trajectories (lighter curves), and final states (darker curves) are plotted on Dll1-Hes1 plane (left panels) and Hes1 expression is additionally plotted over time in minutes (right panels).
Fig. 3
Fig. 3. Mathematical model for Notch signaling mediated MPC differentiation.
a Schematic diagram of how the simulated cells differentiate from MPC fate to PAC fate or BP fate in a 3D structure during E10~E12.5. Different colors indicate different cell fates hereafter: brown, MPC; red, PAC; green, BP. Cells receive ligands from their neighbors and change their gene expression. b E12.5 pancreas in silico. Spatial organization of different cell fates in the simulated pancreatic epithelium at E12.5 is shown with nodes (cells) and edges (interactions). Colors of nodes indicate three different fates: Brown: MPC fate, red: PAC fate, and green: BP fate. c Examples of gene expression dynamics when cells differentiate to BP fate (top) and PAC fate (middle) or maintain MPC fate (bottom). Hes1 (yellow), Dll1 (red), and Jag1 (blue) change along the developmental time (min). Hes1 and Dll1 show comparable anti-phase oscillation in the same cell when the cell is at MPC state. The positions of the cells are pointed out with corresponding colored arrows in (b). The level of Jag1 (≈0.1 μM) is low but significant at the early time. d Comparison of cell proportions in in silico and in vivo E12.5 pancreas. The cells are plotted with the amplitude of Hes1 and Ptf1a level at the final stage. Cell proportions in silico are labeled in black and in vivo are labeled in blue. e Statistics of amplitude and period of Hes1 recaptured in the in silico E12.5 pancreas. The amplitude of Hes1 is higher in BP cells than in MPC cells, and the period of Hes1 in BP fate and MPC fate is ≈120 min. Mean ± SD, PAC: N = 28; MPC: N = 22; BP: N = 93. f Cross-section display of the in silico E12.5 pancreas. The PACs are distributed at the surface of the epithelium surrounded by BP cells, while a few MPCs are in the center closely interacting with the BP cells.
Fig. 4
Fig. 4. Alteration of Hes1 transcription biases cell proportions.
a Effects of DAPT or MLN4924 on Hes1 expression correspond to increasing or decreasing the parameter K2 in the model. b Model predicted effects of treatment with DAPT or MLN4924 on amplitude of Hes1 expression. Values of K2 in different conditions: DMSO (K2 = 0.06), DAPT (K2 = 0.3), and MLN4924 (K2 = 0.01). Mean ± SD, N = 115 for DMSO, N = 91 for DAPT, and N = 143 for MLN4924. P values are calculated with two-tailed Mann–Whitney test and shown above the sample pairs. c Experimentally observed relative changes by treatment with DAPT or MLN4924 on the amplitude of Hes1 expression. Data from ref. are plotted (Mean ± SD, N = 51 for DMSO, N = 71 for DAPT, N = 74 for MLN4924), and the original luminescence signal is scaled with 104. P values are calculated with two-tailed Mann–Whitney test and shown above the sample pairs. d Amplitude of Hes1 and Ptf1a level changes with DAPT treatment in simulation. Treatment with DAPT is predicted to lead to failure of cell fate segregation and result in more cells maintaining MPC state. In the simulation, 24% of the cells adopt PAC fate, which is slightly higher than DMSO (20%). DMSO: N = 143, DAPT: N = 143. e Amplitude of Hes1 and Ptf1a level changes with MLN4924 treatment in simulation. Treatment with MLN4924 is predicted to improve the probability of BP cell fate commitment and result in fewer PAC cells in the pancreas. DMSO: N = 143, MLN4924: N = 143. f BP fate is hampered by DAPT treatment in simulation, compared to the normal structure (Fig. 3b). g PAC fate is hampered by MLN4924 treatment in simulation, compared to the normal structure (Fig. 3b). hj Cell fate distributions in pancreatic explants with different treatments. Expression of Sox9 (green, BP fate) and Ptf1a (red, PAC fate) by IF is shown as 3D maximum intensity projections in E10.5 pancreas explants after culture for 5 days in DMSO, DAPT, or MLN4924. Scale bar: 100 μm. km Statistics of BP, PAC, MPC cell proportions in experiments with different conditions. Data from ref. is plotted (Mean ± SD, N = 17 for DMSO, N = 16 for MLN4924, N = 10 for DAPT). P values are calculated with Two-tailed Welch’s t tests and shown above the sample pairs.
Fig. 5
Fig. 5. Jag1 plays pivotal role in pancreatic development.
a Dll1 deficiency facilitates while Jag1 deficiency hampers MPC differentiation. Compared with wild type (R26Yfp/Yfp), Dll1 deficient (Dll1ΔFoxa2) mutants show decreased MPC proportion in E12.5 pancreas. Intermediate Jag1 deficiency (Jag1ΔFoxa2/+) and severe Jag1 deficiency (Jag1ΔFoxa2/−) increased MPC proportions in E12.5 pancreas. Gray bars: experimental MPC proportions of pancreas in different mutants, mean ± SD of data in ref. is plotted. N = 5 for R26Yfp/Yfp controls, N = 4 for Dll1 mutants, N = 3 for Jag1 heterozygous mutants, N = 3 for Jag1 homozygous mutants. Blue bars: predicted MPC proportions of different simulated genotypes with in silico pancreas. b, c Spatial positions of three cell fates in Dll1 deficient pancreas and Jag1 deficient pancreas. Cell fates are defined with the expression of Ptf1a and Hes1 at the final stage. df Examples for cell fate changes with genotypes. The dynamics of three cells are shown with their expression of Hes1 (yellow), Dll1 (red), and Jag1 (blue). Their positions in the 3D spatial structure are labeled with corresponding colored arrows in (b) and (c). gi Experiments: Distribution of PAC fate and BP fate indicated by cell fate markers, Sox9 (BP, green) and Ptf1a (PAC, red) in R26Yfp/+ mice, Dll1ΔFoxa2 mice, and Jag1ΔFoxa2 mice at E13.5. The left panels show the merged channels in each pancreas, and the right panels show the separate channels. When two colors appear in the same cell, the merged color tends to be yellow particularly seen in Jag1ΔFoxa2 mice (arrowheads indicate colocalization). The scale bar for the merged channels is 50 μm while for the separate channels it is 25 μm. Representative example of IF staining repeated on three different sets of embryos.
Fig. 6
Fig. 6. Jag1 bifurcates cell fates by mediating strong cis-interaction.
a Summary schematic diagram for the necessity of cis-interaction in pancreatic cell fate segregation. Successful cell fate bifurcation requires a certain level of cis-interaction. The heatmap shows the distribution of amplitude of Hes1 in simulated pancreas with different cis-interaction rate. Each column corresponds to one specific value of the cis-interaction rate. Cells maintain intermediate Hes1 oscillation amplitudes with low cis-interaction, while either high or low Hes1 oscillation amplitudes are seen with increased cis-interaction. b Summary schematic diagram for cell fate segregation failure without Jag1 regardless of the cis-interaction rate. With high cis-interaction rate (0.4), cell fate segregation is only partially achieved and some cells still fail to exit the MPC state and maintain an intermediate amplitude of Hes1. c Model predicts that increased expression of Jag1 rescues cell fate segregation at low cis-interaction rate. With γ1 = 0.2, a few cells in wild type (blue dot, aJ = 1.0) pancreas can differentiate into BP fate or PAC fate, with Jag1 deficiency (red square, aJ = 0), the cells maintain MPC fate and with increased Jag1 (orange square, aJ = 4.0), the cells adopt a BP or PAC fate except for very few cells that maintain an MPC fate. d Model predicts that expression of Jag1 facilitates cell fate segregation at high cis-interaction rate. With γ1 = 0.38, Jag1 deficiency causes a few cells to fail to differentiate and maintain MPC fate. With increased Jag1 (aJ = 1.2 is shown), the cells adopt a BP or PAC fate like the wild type. e MPC state is maintained by low Jag1 expression at the beginning of pancreatic development. The trans-interaction between cells and Hes1 oscillation are key factors for MPC fate maintenance. f Tip-trunk differentiation happens when Jag1 rises and mediates strong cis-interaction. Cell fate symmetry is broken by cis-interaction and strengthened trans-interaction.

Similar articles

Cited by

References

    1. Schweisguth F, Corson F. Self-organization in pattern formation. Dev. Cell. 2019;49:659–677. doi: 10.1016/j.devcel.2019.05.019. - DOI - PubMed
    1. Shih HP, Wang A, Sander M. Pancreas organogenesis: from lineage determination to morphogenesis. Annu. Rev. Cell Dev. Biol. 2013;29:81–105. doi: 10.1146/annurev-cellbio-101512-122405. - DOI - PubMed
    1. Murtaugh LC, Stanger BZ, Kwan KM, Melton DA. Notch signaling controls multiple steps of pancreatic differentiation. Proc. Natl Acad. Sci. 2003;100:14920–14925. doi: 10.1073/pnas.2436557100. - DOI - PMC - PubMed
    1. Serup P. Signaling pathways regulating murine pancreatic development. Semin Cell Dev. Biol. 2012;23:663–672. doi: 10.1016/j.semcdb.2012.06.004. - DOI - PubMed
    1. Sprinzak D, et al. Cis-interactions between Notch and Delta generate mutually exclusive signalling states. Nature. 2010;465:86–90. doi: 10.1038/nature08959. - DOI - PMC - PubMed

Publication types

LinkOut - more resources