. 2023 Jan 21;14(1):350.
doi: 10.1038/s41467-023-36021-1.

Mapping nucleolus-associated chromatin interactions using nucleolus Hi-C reveals pattern of heterochromatin interactions

Affiliations

Mapping nucleolus-associated chromatin interactions using nucleolus Hi-C reveals pattern of heterochromatin interactions

Ting Peng et al. Nat Commun. .

Abstract

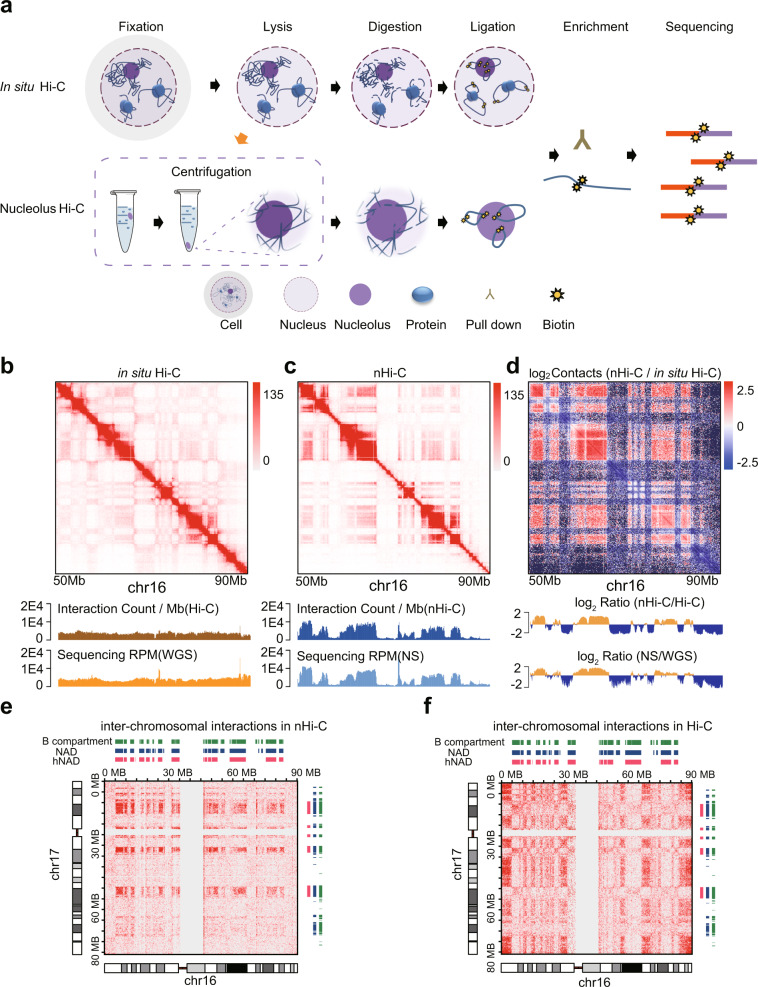
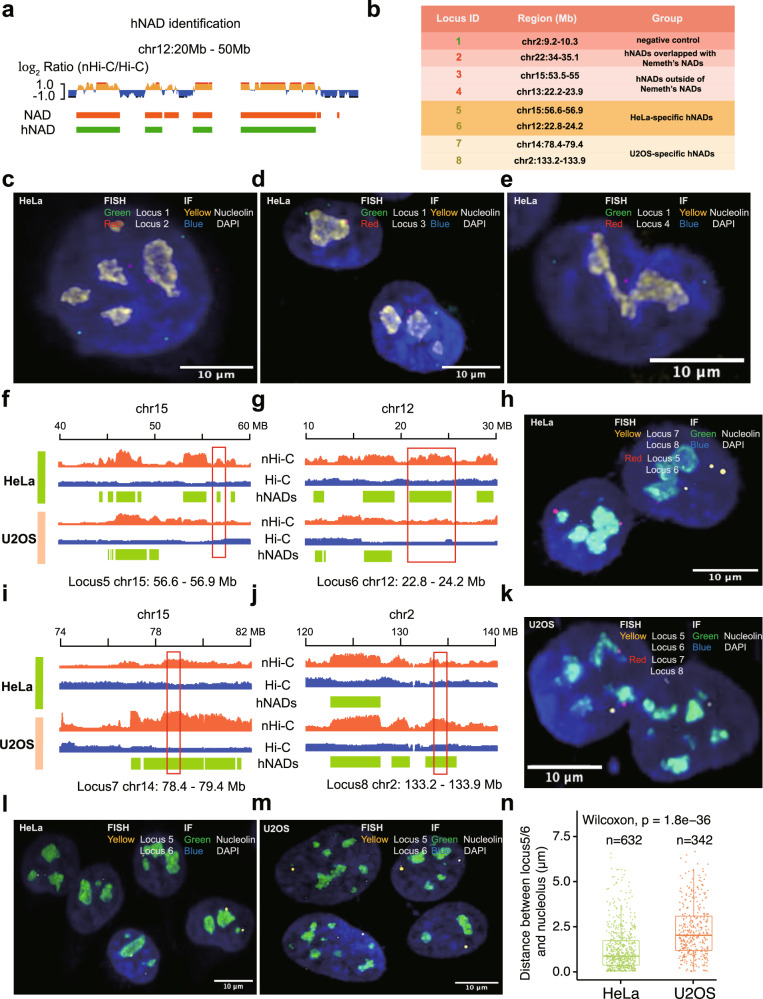
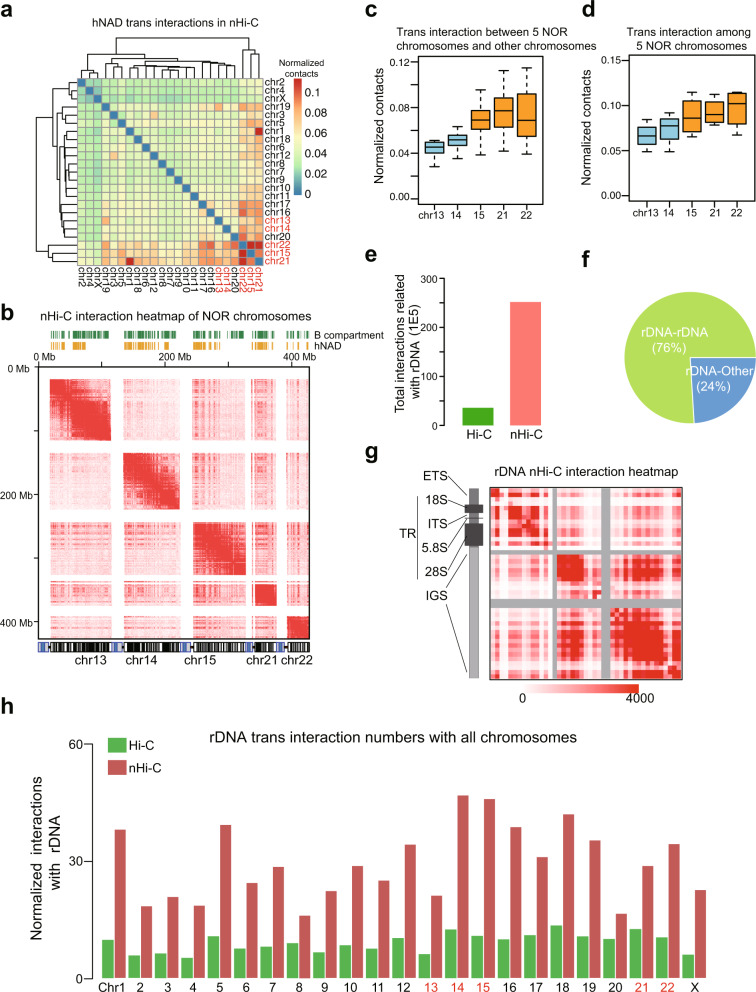
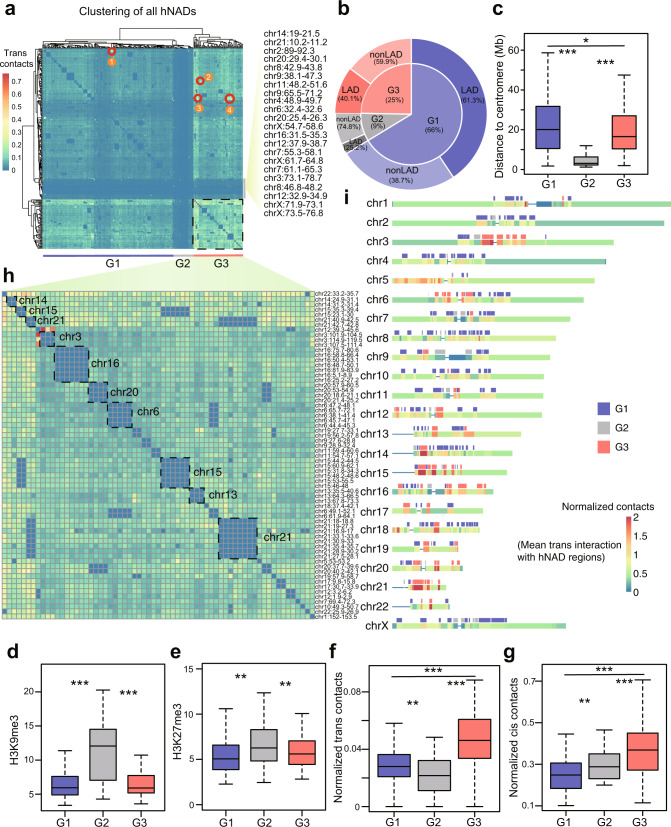
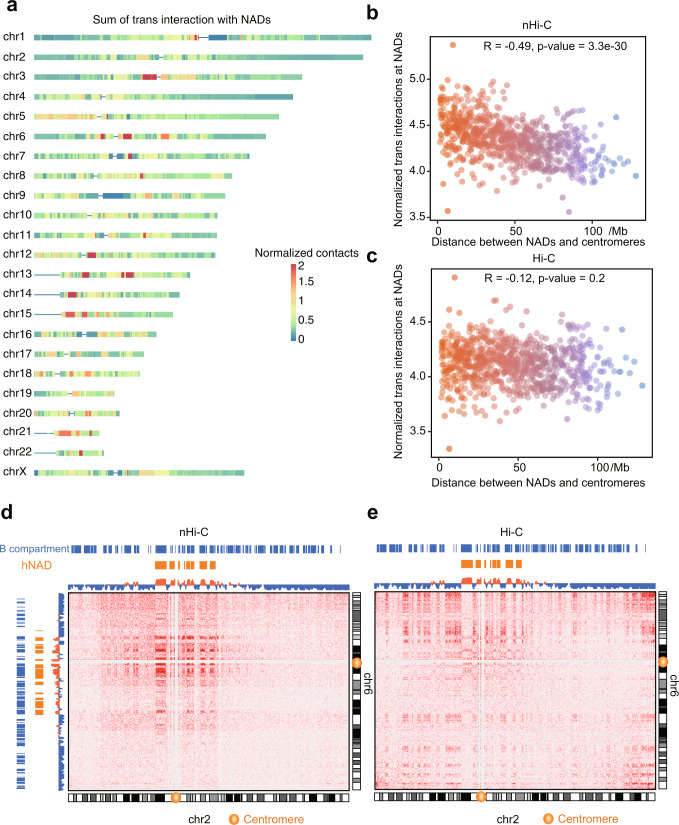
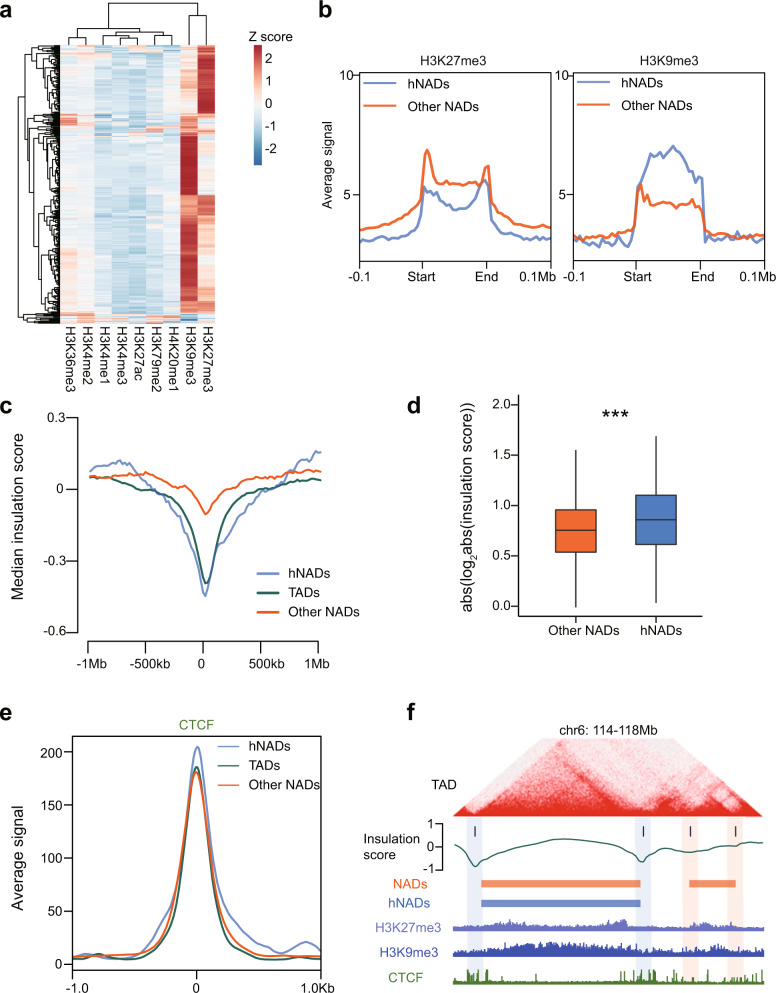
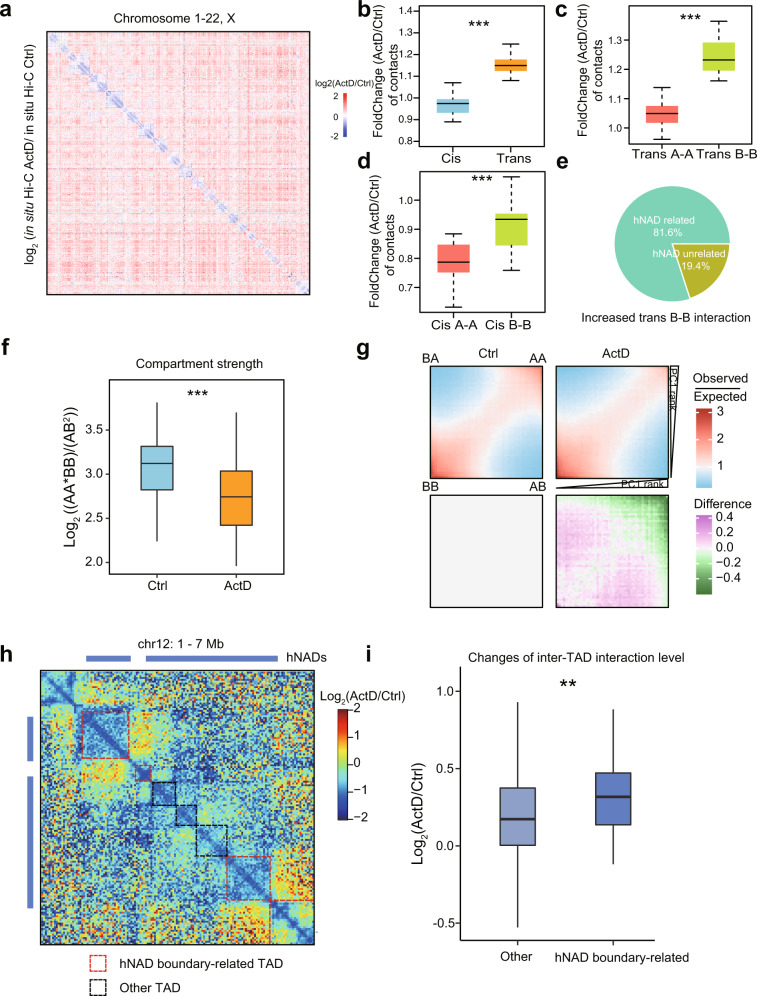
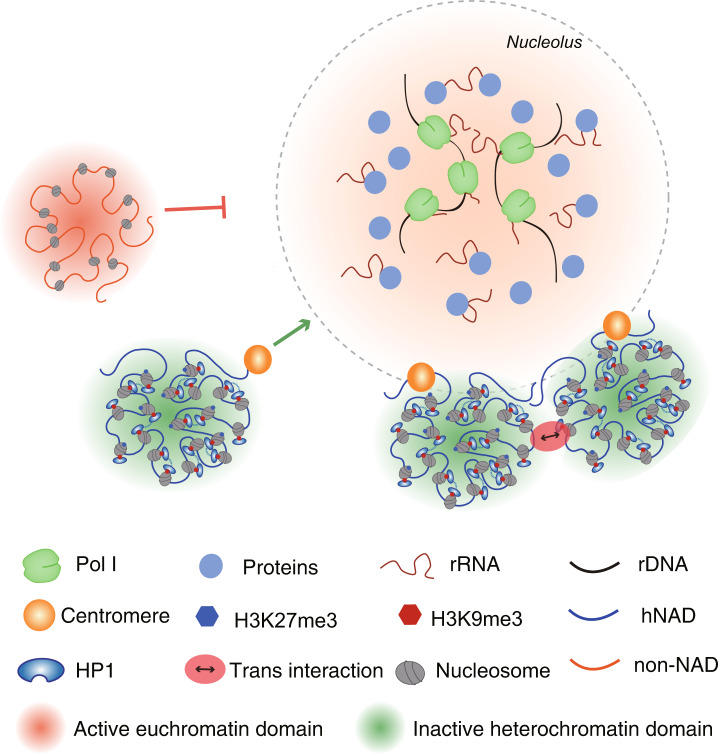
As the largest substructures in the nucleus, nucleoli are the sites of ribosome biogenesis. Increasing evidence indicates that nucleoli play a key role in the organization of 3D genome architecture, but systematic studies of nucleolus-associated chromatin interactions are lacking. Here, we developed a nucleolus Hi-C (nHi-C) experimental technique to enrich nucleolus-associated chromatin interactions. Using the nHi-C experiment, we identify 264 high-confidence nucleolus-associated domains (hNADs) that form strong heterochromatin interactions associated with the nucleolus and consist of 24% of the whole genome in HeLa cells. Based on the global hNAD inter-chromosomal interactions, we find five nucleolar organizer region (NOR)-bearing chromosomes formed into two clusters that show different interaction patterns, which is concordant with their epigenetic states and gene expression levels. hNADs can be divided into three groups that display distinct cis/trans interaction signals, interaction frequencies associated with nucleoli, distance from the centromeres, and overlap percentage with lamina-associated domains (LADs). Nucleolus disassembly caused by Actinomycin D (ActD) significantly decreases the strength of hNADs and affects compartment/TAD strength genome-wide. In summary, our results provide a global view of heterochromatin interactions organized around nucleoli and demonstrate that nucleoli act as an inactive inter-chromosomal hub to shape both compartments and TADs.


Conflict of interest statement

The authors declare no competing interests.

Figures

Fig. 1
Fig. 1. nHi-C preferentially captures nucleolus-associated chromatin interactions.
a Flow chart of nHi-C. For comparison with in situ Hi-C, nHi-C was performed with isolated nucleoli. b, c Interaction heatmaps of in situ Hi-C and nHi-C. WGS: whole-genome sequencing, RPM: reads per million for each chromosome bin, NS: nucleolus sequencing. d Interaction heatmap showing the log2 fold-change in normalized interactions between nHi-C and Hi-C. NADs and nHi-C interaction-enriched regions are defined by an HMM model with log2Ratio (nHi-C/Hi-C) or log2Ratio (NS/WGS). e, f Interaction heatmaps between chromosomes 16 and 17 in nHi-C (e) and in situ Hi-C (f).
Fig. 2
Fig. 2. hNADs in HeLa and U2OS cells.
a High-confidence NADs (hNADs) are defined as those NADs possessing a chromosomal bin with log2Ratio greater than 1. b List of genome regions chosen to perform FISH experiments. ce Representative images of hNADs’ Oligopaint FISH probes (Locus 2-4) in HeLa cells. (n = 5 biologically independent samples). f, g Track plot of HeLa-specific hNADs chosen to perform DNA-FISH. h Representative images of cell type-specific hNADs’ Oligopaint FISH probes (Locus 5-8) in HeLa cells (n = 5 biologically independent samples). i, j Track plot of U2OS-specific hNADs chosen to perform DNA-FISH. k Representative images of cell type-specific hNADs’ Oligopaint FISH probes (Locus 5-8) in U2OS cells (n = 3 biologically independent samples). l, m Representative images of HeLa-specific hNADs’ Oligopaint FISH probes (Locus 5 and 6, the same probes were used for the two loci) in HeLa and U2OS cells (n = 5 biologically independent samples). n Distance between HeLa-specific hNADs (Locus 5 and 6) and nucleolus in HeLa and U2OS cells. In box-plots, center line stands for median; box limits are the 25th and 75th percentiles. ‘n’ indicates the total number of cells imaged in independent experiments. Statistically significant differences are indicated and were calculated with two-sided Wilcoxon test.
Fig. 3
Fig. 3. Deciphering nucleolus-associated interactions using nHi-C.
a Chromosome clustering results of hNAD trans interactions captured by nHi-C. The 5 NOR-bearing chromosomes were labeled in red. b Interaction heatmap of NOR-bearing chromosomes. The bottom panel represents cytoband staining of chromosomes: rDNA arms are colored in blue. c Box-plots (center line, median; box limits, the 25th and 75th percentiles) of trans interactions between the 5 NOR-bearing chromosomes and other chromosomes (n = 22 chromosomes). d Box-plots of trans interactions among the 5 NOR-bearing chromosomes (n = 4 chromosomes). e Number of rDNA-related interactions captured by in situ Hi-C and nHi-C. f Percentage of cis (rDNA-rDNA) and trans (rDNA-other genome regions) rDNA interactions in nHi-C. g Cis interaction heatmap of rDNA repeat units from nHi-C data. h The normalized number of rDNA-associated interactions in different chromosomes from in situ Hi-C and nHi-C data. The 5 NOR-bearing chromosomes were labeled in red.
Fig. 4
Fig. 4. Global properties of hNAD inter-chromosomal interactions.
a hNAD clustering results based on hNAD trans interactions captured by nHi-C. Circled out regions are hNAD-involved chromosome translocations. b Percentage of G1, G2, and G3 hNADs (inner layer) and their overlap percentage with LADs (outer layer). c Distance of G1, G2, and G3 hNADs from centromeres. de H3K9me3 (d) and H3K27me3 (e) signals in G1, G2, and G3 hNADs. f, g Trans (f) and cis (g) interaction levels of G1, G2, and G3 hNADs. h Composition and chromatin interactions of G3 hNADs. i Mean trans interaction level of chromosomal bins with other hNADs and the locations of G1, G2, and G3 hNADs. In all box-plots (cg), center line stands for median; box limits are  the 25th and 75th percentiles. n = 177 (G1), n = 22 (G2), n = 65 (G3). Statistically significant differences are indicated and were calculated with two-sided Wilcoxon test. *p < 0.05, **p < 0.01, ***p < 0.001. Source data are provided as a Source Data file.
Fig. 5
Fig. 5. Global distribution pattern of nucleolus-associated trans interactions.
a Sum of trans interactions with NAD regions for chromosomal bins. b, c Scatter plot of the number of trans interactions associated with NADs (y axis) and centromere distance (x axis) from nHi-C (b) and in situ Hi-C (c) data. Each point represents a chromosomal bin. Statistically significance was calculated with two-sided Pearson correlation test. d, e Interaction heatmap between chromosomes 2 and 6 from nHi-C (d) and in situ Hi-C (e) data. Source data are provided as a Source Data file.
Fig. 6
Fig. 6. Comparison of epigenetic signals between hNADs and TADs.
a Heatmap of histone modification signals (columns) in hNAD regions (rows). b Average H3K27me3 and H3K9me3 signals in hNAD, other NAD and surrounding regions. c Median insulation scores surrounding the boundaries of NADs and TADs. d Box-plots (center line, median; box limits, the 25th and 75th percentiles) of insulation scores at hNADs and other NADs. n = 588 TAD boundaries overlap with hNAD boundaries, n = 726 TAD boundaries overlap with the boundaries of other NADs. Statistically significant differences were calculated with two-sided Wilcoxon test. ***p < 0.001. e CTCF binding signals at hNADs, other NADs, and TAD boundaries. f An example of overlapping NAD and TAD boundaries. Source data are provided as a Source Data file.
Fig. 7
Fig. 7. Nucleolus disassembly results in genome reorganization.
a Interaction heatmap among all chromosomes showing the log2 fold-change in normalized interactions between ActD-treated (ActD) and untreated (Ctrl) HeLa cells. b Comparison of cis and trans interaction changes in all chromosomes after ActD treatment. c Comparison of trans A-A and trans B-B interaction changes in all chromosomes after ActD treatment. d Comparison of cis A-A and cis B-B interaction changes in all chromosomes after ActD treatment. e Most of the increased trans B-B interactions were related to hNADs. f Comparison of compartment strength in all chromosomes before and after ActD treatment. g Compartment saddle plot of A-A, B-B, and A-B interactions before and after ActD treatment. h An example of changes in inter-TAD interactions around hNADs after ActD treatment. i Inter-TAD interactions were significantly increased at hNAD-related TADs. n = 324 TAD boundaries overlap with hNAD boundaries, n = 528 TAD boundaries overlap with the boundaries of other NADs. In all box-plots (bd, f, i), center line stands for median; box limits are the 25th and 75th percentiles. Statistically significant differences were calculated with two-sided Wilcoxon test. *p < 0.05, **p < 0.01, ***p < 0.001. In box-plots bd, f, n = 23 chromosomes per group. Source data are provided as a Source Data file.
Fig. 8
Fig. 8. A model of nucleolus-associated chromosome interactions.
rRNAs, as well as other proteins, aggregate around competent NORs by phase separation after mitosis, and the NOR phase serves as a signal source to recruit other heterochromatin phases. Centromeres are more easily recruited to nucleoli due to their compact repressive epigenetic modifications; thus, hNAD inter-chromosomal interactions are organized around nucleoli in a centromere-proximal manner.

Similar articles

Cited by

References

    1. Boisvert FM, van Koningsbruggen S, Navascues J, Lamond AI. The multifunctional nucleolus. Nat. Rev. Mol. Cell Biol. 2007;8:574–585. doi: 10.1038/nrm2184. - DOI - PubMed
    1. Nemeth A, Langst G. Genome organization in and around the nucleolus. Trends Genet. 2011;27:149–156. doi: 10.1016/j.tig.2011.01.002. - DOI - PubMed
    1. Shiue CN, Arabi A, Wright AP. Nucleolar organization, growth control and cancer. Epigenetics. 2010;5:200–205. doi: 10.4161/epi.5.3.11376. - DOI - PubMed
    1. Stults DM, et al. Human rRNA gene clusters are recombinational hotspots in cancer. Cancer Res. 2009;69:9096–9104. doi: 10.1158/0008-5472.CAN-09-2680. - DOI - PubMed
    1. Nemeth A, et al. Initial genomics of the human nucleolus. PLoS Genet. 2010;6:e1000889. doi: 10.1371/journal.pgen.1000889. - DOI - PMC - PubMed

Publication types