

Microevolutionary dynamics of eccDNA in Chinese hamster ovary cells grown in fed-batch cultures under control and lactate-stressed conditions
- PMID: 36681715
- PMCID: PMC9862248
- DOI: 10.1038/s41598-023-27962-0
Microevolutionary dynamics of eccDNA in Chinese hamster ovary cells grown in fed-batch cultures under control and lactate-stressed conditions
Abstract
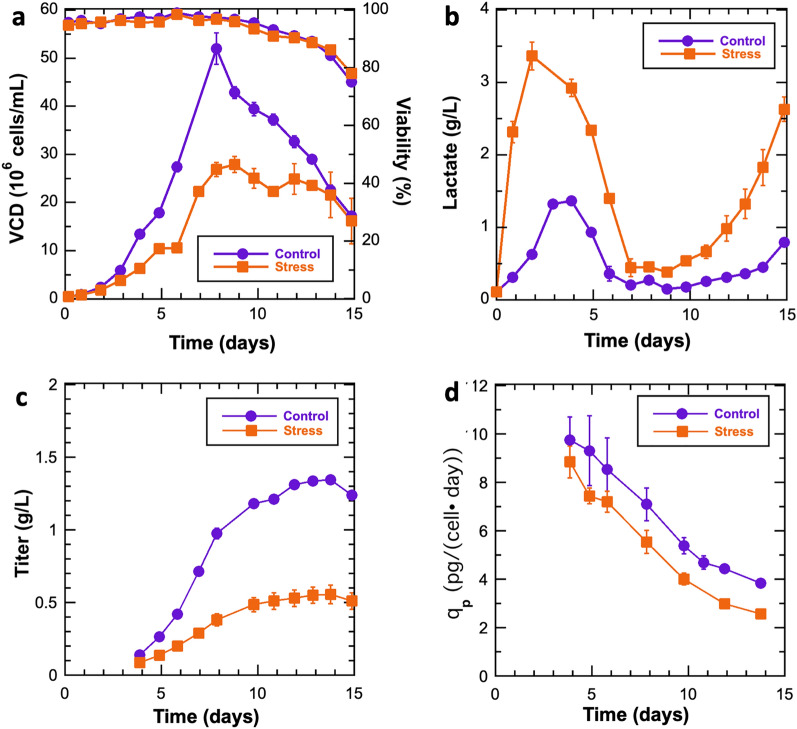
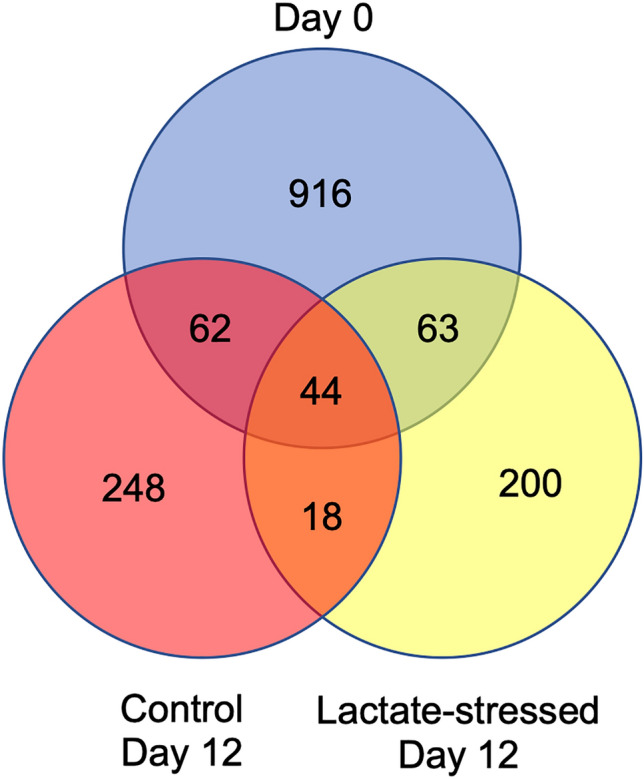
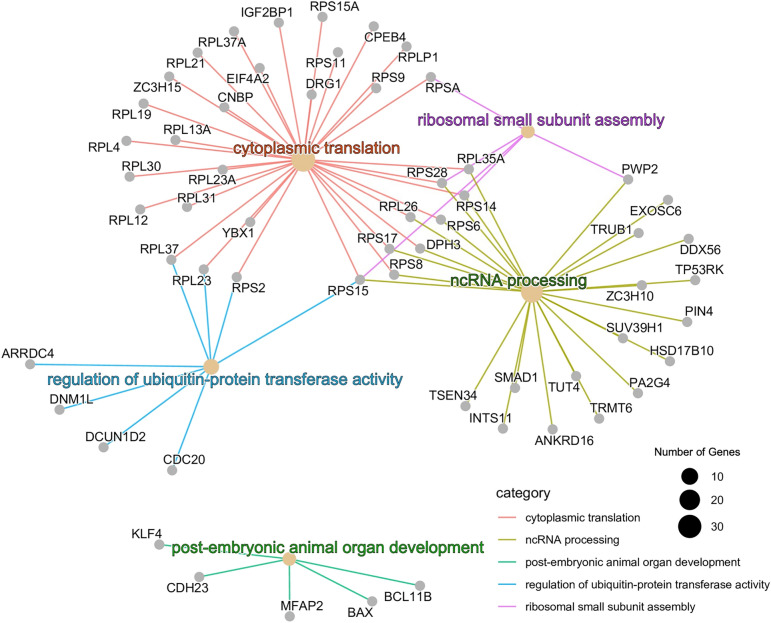
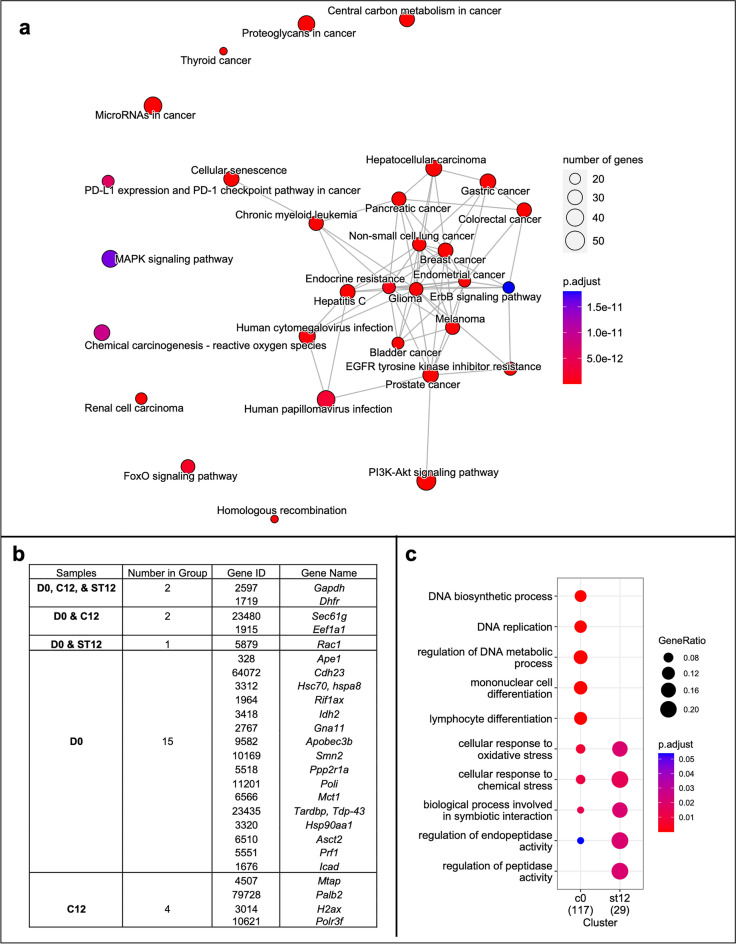
Chinese hamster ovary (CHO) cell lines are widely used to manufacture biopharmaceuticals. However, CHO cells are not an optimal expression host due to the intrinsic plasticity of the CHO genome. Genome plasticity can lead to chromosomal rearrangements, transgene exclusion, and phenotypic drift. A poorly understood genomic element of CHO cell line instability is extrachromosomal circular DNA (eccDNA) in gene expression and regulation. EccDNA can facilitate ultra-high gene expression and are found within many eukaryotes including humans, yeast, and plants. EccDNA confers genetic heterogeneity, providing selective advantages to individual cells in response to dynamic environments. In CHO cell cultures, maintaining genetic homogeneity is critical to ensuring consistent productivity and product quality. Understanding eccDNA structure, function, and microevolutionary dynamics under various culture conditions could reveal potential engineering targets for cell line optimization. In this study, eccDNA sequences were investigated at the beginning and end of two-week fed-batch cultures in an ambr®250 bioreactor under control and lactate-stressed conditions. This work characterized structure and function of eccDNA in a CHO-K1 clone. Gene annotation identified 1551 unique eccDNA genes including cancer driver genes and genes involved in protein production. Furthermore, RNA-seq data is integrated to identify transcriptionally active eccDNA genes.
© 2023. The Author(s).
Conflict of interest statement
The authors declare no competing interests.
Figures
Similar articles
-
Dynamics of Amino Acid Metabolism, Gene Expression, and Circulomics in a Recombinant Chinese Hamster Ovary Cell Line Adapted to Moderate and High Levels of Extracellular Lactate.Genes (Basel). 2023 Aug 2;14(8):1576. doi: 10.3390/genes14081576. Genes (Basel). 2023. PMID: 37628627 Free PMC article.
-
Characterization of metabolic responses, genetic variations, and microsatellite instability in ammonia-stressed CHO cells grown in fed-batch cultures.BMC Biotechnol. 2021 Jan 8;21(1):4. doi: 10.1186/s12896-020-00667-2. BMC Biotechnol. 2021. PMID: 33419422 Free PMC article.
-
Super7 passaging method to improve Chinese hamster ovary cell fed-batch performance.Biotechnol Bioeng. 2024 Oct;121(10):3068-3075. doi: 10.1002/bit.28723. Epub 2024 Apr 24. Biotechnol Bioeng. 2024. PMID: 38659198
-
Synthetic biology approaches for dynamic CHO cell engineering.Curr Opin Biotechnol. 2022 Dec;78:102806. doi: 10.1016/j.copbio.2022.102806. Epub 2022 Oct 1. Curr Opin Biotechnol. 2022. PMID: 36194920 Review.
-
Factors affecting the quality of therapeutic proteins in recombinant Chinese hamster ovary cell culture.Biotechnol Adv. 2022 Jan-Feb;54:107831. doi: 10.1016/j.biotechadv.2021.107831. Epub 2021 Sep 2. Biotechnol Adv. 2022. PMID: 34480988 Review.
Cited by
-
Identification of eccDNA in Extracellular Vesicles Derived from Human Dermal Fibroblasts Through Nanopore Sequencing.Int J Mol Sci. 2025 Apr 27;26(9):4144. doi: 10.3390/ijms26094144. Int J Mol Sci. 2025. PMID: 40362382 Free PMC article.
-
Sequence Characterization of Extra-Chromosomal Circular DNA Content in Multiple Blackgrass (Alopecurus myosuroides) Populations.Genes (Basel). 2023 Oct 4;14(10):1905. doi: 10.3390/genes14101905. Genes (Basel). 2023. PMID: 37895254 Free PMC article.
-
Dynamics of Amino Acid Metabolism, Gene Expression, and Circulomics in a Recombinant Chinese Hamster Ovary Cell Line Adapted to Moderate and High Levels of Extracellular Lactate.Genes (Basel). 2023 Aug 2;14(8):1576. doi: 10.3390/genes14081576. Genes (Basel). 2023. PMID: 37628627 Free PMC article.
References
Publication types
MeSH terms
Substances
LinkOut - more resources
Full Text Sources
