. 2023 Jan 21;13(1):1210.
doi: 10.1038/s41598-023-28198-8.

Energetic and behavioral consequences of migration: an empirical evaluation in the context of the full annual cycle

Affiliations

Energetic and behavioral consequences of migration: an empirical evaluation in the context of the full annual cycle

J Morgan Brown et al. Sci Rep. .

Abstract

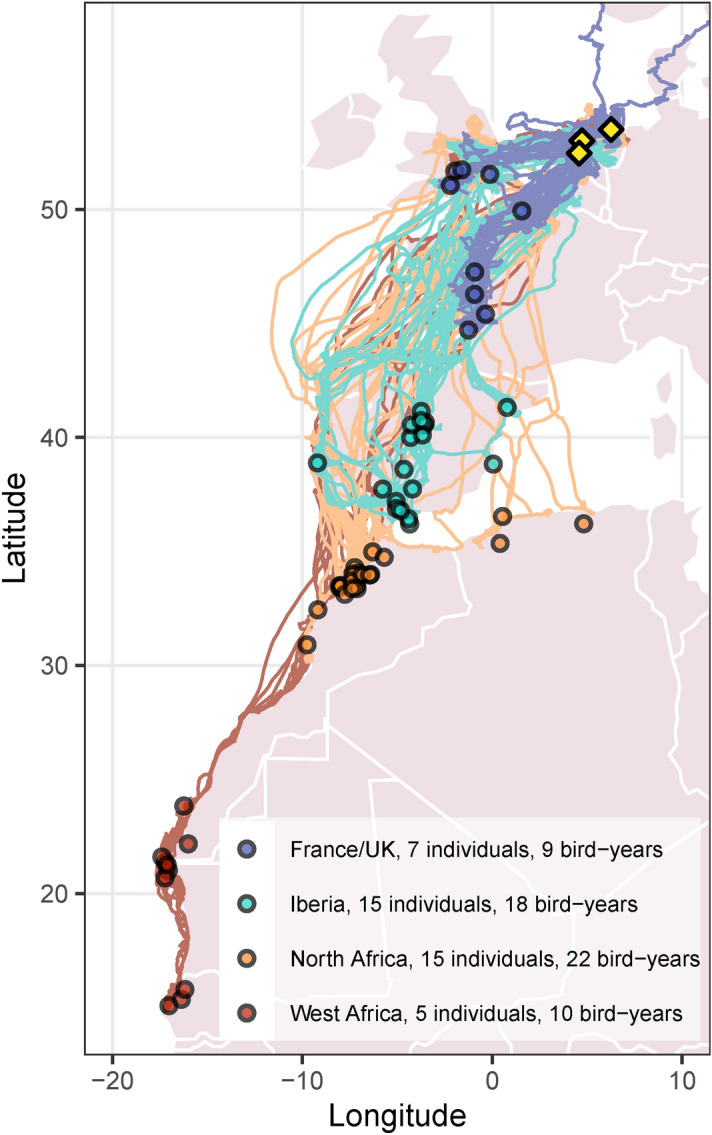
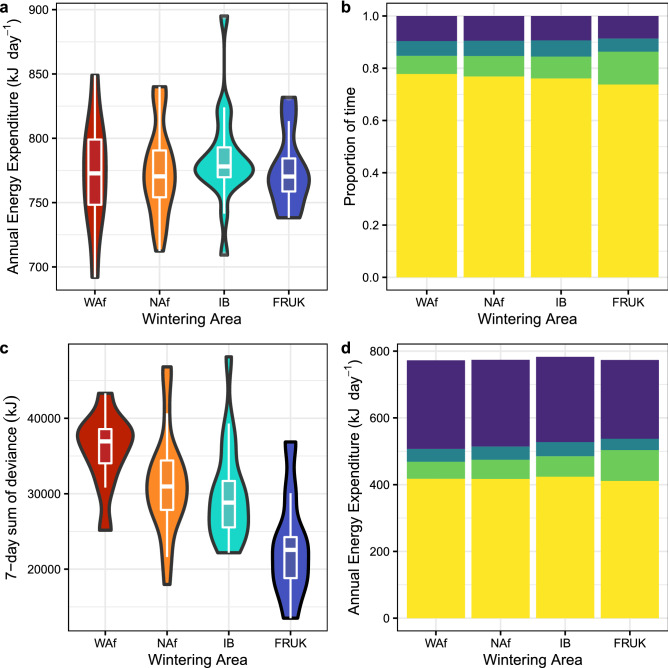
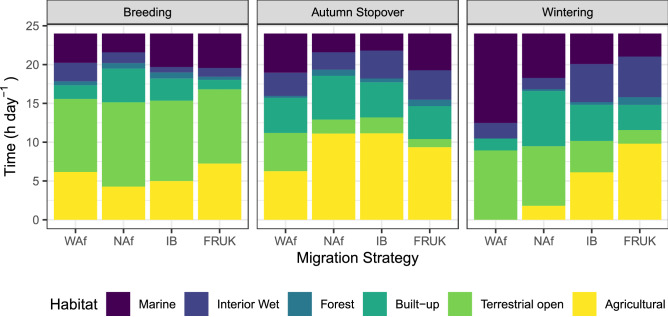
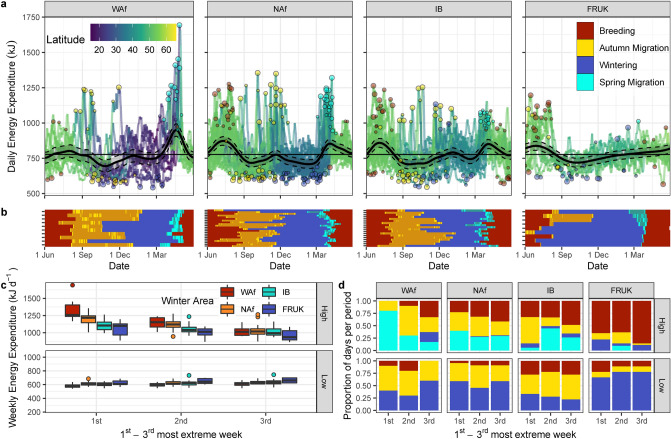
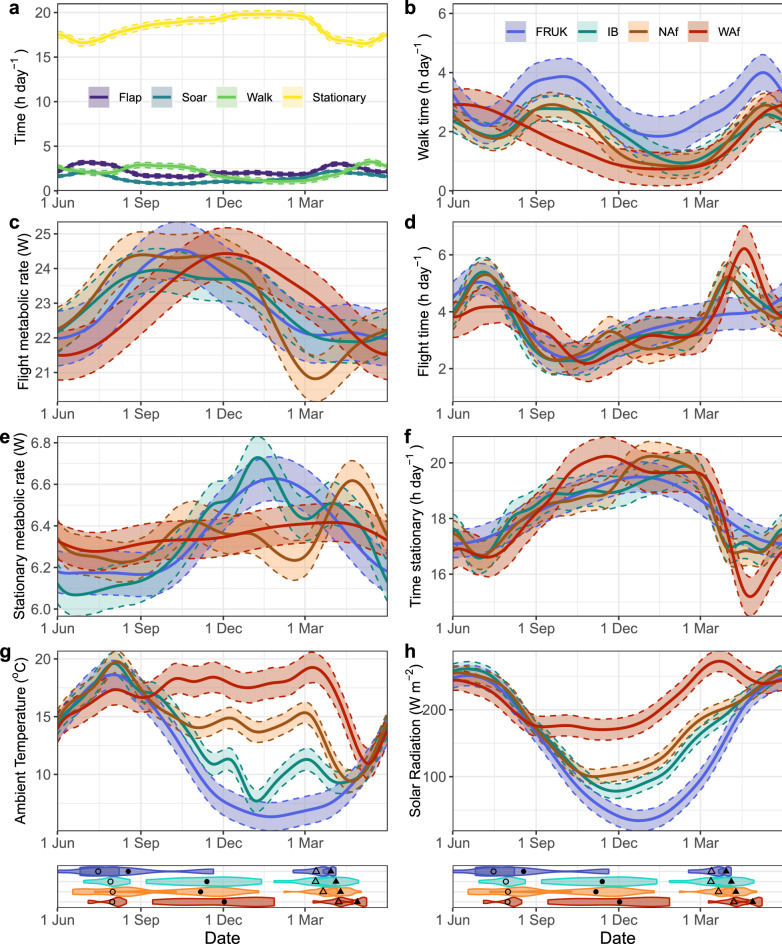
Seasonal migrations are used by diverse animal taxa, yet the costs and benefits of migrating have rarely been empirically examined. The aim of this study was to determine how migration influences two ecological currencies, energy expenditure and time allocated towards different behaviors, in a full annual cycle context. We compare these currencies among lesser black-backed gulls that range from short- (< 250 km) to long-distance (> 4500 km) migrants. Daily time-activity budgets were reconstructed from tri-axial acceleration and GPS, which, in conjunction with a bioenergetics model to estimate thermoregulatory costs, enabled us to estimate daily energy expenditure throughout the year. We found that migration strategy had no effect on annual energy expenditure, however, energy expenditure through time deviated more from the annual average as migration distance increased. Patterns in time-activity budgets were similar across strategies, suggesting migration strategy does not limit behavioral adjustments required for other annual cycle stages (breeding, molt, wintering). Variation among individuals using the same strategy was high, suggesting that daily behavioral decisions (e.g. foraging strategy) contribute more towards energy expenditure than an individual's migration strategy. These findings provide unprecedented new understanding regarding the relative importance of fine versus broad-scale behavioral strategies towards annual energy expenditures.


Conflict of interest statement

The authors declare no competing interests.

Figures

Figure 1
Figure 1
GPS tracks and wintering area centroids (open circles) of bird-years, colored by migration strategy. Breeding colonies are marked with yellow diamonds. Winter areas are jittered to avoid overlap. Map was produced using R packages ggplot and rworldmap using Natural Earth data.
Figure 2
Figure 2
Annual summary of energy expenditure and time-energy budgets by migration strategy. Violin and boxplots show variation in (a) annual energy expenditure (AEE) across bird-years, and (c) the sum of deviance between AEE and 7-day average DEE. Stacked bar plots show allocation of time (b) and energy (d) towards different behaviors where purple is proportion flapping, blue is soaring, green is walking and yellow is stationary. WAf = West Africa, 5 individuals, 10 bird-years; NAf = North Africa, 15 individuals, 22 bird-years; IB = Iberia, 15 individuals, 18 bird-years; FRUK = France and UK, 7 individuals, 9 bird-years.
Figure 3
Figure 3
Average time per day spent in each habitat by migration strategy during breeding, autumn stopover, and on wintering area. WAf = West Africa, 5 individuals, 10 bird-years; NAf = North Africa, 15 individuals, 22 bird-years; IB = Iberia, 15 individuals, 18 bird-years; FRUK = France and UK, 7 individuals, 9 bird-years.
Figure 4
Figure 4
Energy expenditure during the annual cycle. (a) Daily energy expenditure (DEE) of lesser black-backed gulls throughout the year by migration strategy (WAf = West Africa, 5 individuals, 10 bird-years; NAf = North Africa, 15 individuals, 22 bird-years; IB = Iberia, 15 individuals, 18 bird-years; FRUK = France and UK, 7 individuals, 9 bird-years). Bold black line shows results of the GAMM model per strategy with 95% point-wise confidence intervals around the fixed effect. Colored lines show 7-day mean DEE per bird-year, colored by latitude. Points mark the three highest and lowest 7-day mean DEEs per bird-year, with point size indicating rank (most extreme being larger), and color indicating the annual cycle stage of the central day of that week. The horizontal line indicates the annual mean DEE across all strategies. (b) Timing of annual cycle periods of each bird-year, ordered from longest (top) to shortest migration distance per strategy. Stopover days during autumn and spring are differentiated from migration days by the darker tone. (c) Boxplots showing value of three highest and lowest weeks per bird-year, by migration strategy (indicated by colored points in panel (a)). (d) Stacked bar plot showing distribution of annual cycle stages of the 7 days contributing to the three highest and lowest weeks per strategy.
Figure 5
Figure 5
Generalized additive mixed model results of time or energy allocated to different behaviors, and weather conditions throughout the year. (a) General pattern across all migration strategies (top model based on AIC), with behavior models distinguished by color. The top model for walking included strategy-specific intercepts, with the French/UK migration strategy walking 0.90–1.16 h day−1 more throughout the year compared to the other strategies (not shown). (b) Time walking, (c) flight metabolic rate. (d) Time flying, (e) stationary metabolic rate, (f) time stationary, (g) ambient temperature, and h) solar radiation, by migration strategy (distinguished by colour). Bottom panel shows violin plots of probability density for the start dates of annual cycle stages for each migration strategy, with points indicating the mean per strategy, where open circles are the start of autumn migration, filled circles are start of wintering, open triangle is start of spring migration, and filled triangle is start of breeding. WAf = West Africa, 5 individuals, 10 bird-years; NAf = North Africa, 15 individuals, 22 bird-years; IB = Iberia, 15 individuals, 18 bird-years; FRUK = France and UK, 7 individuals, 9 bird-years. Point-wise 95% confidence intervals around the fixed effects are shown.

References

    1. Alerstam T, Hedenström A, Åkesson S. Long-distance migration: Evolution and determinants. Oikos. 2003;103:247–260. doi: 10.1034/j.1600-0706.2003.12559.x. - DOI
    1. Somveille M, Rodrigues ASL, Manica A. Why do birds migrate? A macroecological perspective. Glob. Ecol. Biogeogr. 2015;24:664–674. doi: 10.1111/geb.12298. - DOI
    1. Tatner P, Bryant DM. Flight cost of a small passerine measured using doubly labeled water: Implications for energetics studies. Auk. 1986;103:169–180. doi: 10.2307/4086976. - DOI
    1. Boisclair D, Leggett WC. The importance of activity in bioenergetics models applied to actively foraging fishes. Can. J. Fish. Aquat. Sci. 1989;46:1859–1867. doi: 10.1139/f89-234. - DOI
    1. Karasov WH. Daily energy expenditure and the cost of activity in mammals. Am. Zool. 1992;32:238–248. doi: 10.1093/icb/32.2.238. - DOI - PubMed

Publication types