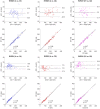
Deep learning can yield clinically useful right ventricular segmentations faster than fully manual analysis
- PMID: 36681759
- PMCID: PMC9867728
- DOI: 10.1038/s41598-023-28348-y
Deep learning can yield clinically useful right ventricular segmentations faster than fully manual analysis
Abstract
Right ventricular (RV) volumes are commonly obtained through time-consuming manual delineations of cardiac magnetic resonance (CMR) images. Deep learning-based methods can generate RV delineations, but few studies have assessed their ability to accelerate clinical practice. Therefore, we aimed to develop a clinical pipeline for deep learning-based RV delineations and validate its ability to reduce the manual delineation time. Quality-controlled delineations in short-axis CMR scans from 1114 subjects were used for development. Time reduction was assessed by two observers using 50 additional clinical scans. Automated delineations were subjectively rated as (A) sufficient for clinical use, or as needing (B) minor or (C) major corrections. Times were measured for manual corrections of delineations rated as B or C, and for fully manual delineations on all 50 scans. Fifty-eight % of automated delineations were rated as A, 42% as B, and none as C. The average time was 6 min for a fully manual delineation, 2 s for an automated delineation, and 2 min for a minor correction, yielding a time reduction of 87%. The deep learning-based pipeline could substantially reduce the time needed to manually obtain clinically applicable delineations, indicating ability to yield right ventricular assessments faster than fully manual analysis in clinical practice. However, these results may not generalize to clinics using other RV delineation guidelines.
© 2023. The Author(s).
Conflict of interest statement
EH is the CTO and founder of Medviso AB that produces the software Segment that was used throughout this study. All other authors declare that they have no competing interests.
Figures


Similar articles
-
Deep learning for elective neck delineation: More consistent and time efficient.Radiother Oncol. 2020 Dec;153:180-188. doi: 10.1016/j.radonc.2020.10.007. Epub 2020 Oct 14. Radiother Oncol. 2020. PMID: 33065182
-
Fully automated intracardiac 4D flow MRI post-processing using deep learning for biventricular segmentation.Eur Radiol. 2022 Aug;32(8):5669-5678. doi: 10.1007/s00330-022-08616-7. Epub 2022 Feb 17. Eur Radiol. 2022. PMID: 35175379
-
Right ventricular strain and volume analyses through deep learning-based fully automatic segmentation based on radial long-axis reconstruction of short-axis cine magnetic resonance images.MAGMA. 2022 Dec;35(6):911-921. doi: 10.1007/s10334-022-01017-3. Epub 2022 May 18. MAGMA. 2022. PMID: 35585430
-
Fully automated quantification of left ventricular volumes and function in cardiac MRI: clinical evaluation of a deep learning-based algorithm.Int J Cardiovasc Imaging. 2020 Nov;36(11):2239-2247. doi: 10.1007/s10554-020-01935-0. Epub 2020 Jul 16. Int J Cardiovasc Imaging. 2020. PMID: 32677023 Free PMC article.
-
A deep learning pipeline for automatic analysis of multi-scan cardiovascular magnetic resonance.J Cardiovasc Magn Reson. 2021 Apr 26;23(1):47. doi: 10.1186/s12968-020-00695-z. J Cardiovasc Magn Reson. 2021. PMID: 33896419 Free PMC article.
Cited by
-
Generalizable deep learning framework for 3D medical image segmentation using limited training data.3D Print Med. 2025 Mar 6;11(1):9. doi: 10.1186/s41205-025-00254-1. 3D Print Med. 2025. PMID: 40045095 Free PMC article.
-
Noninvasive Pressure-Volume Loops Predict Major Adverse Cardiac Events in Heart Failure With Reduced Ejection Fraction.JACC Adv. 2024 May 4;3(6):100946. doi: 10.1016/j.jacadv.2024.100946. eCollection 2024 Jun. JACC Adv. 2024. PMID: 38938852 Free PMC article.
-
Accelerated Cardiac MRI with Deep Learning-based Image Reconstruction for Cine Imaging.Radiol Cardiothorac Imaging. 2024 Dec;6(6):e230419. doi: 10.1148/ryct.230419. Radiol Cardiothorac Imaging. 2024. PMID: 39540821 Free PMC article.
-
Revolutionizing Cardiac Imaging: A Scoping Review of Artificial Intelligence in Echocardiography, CTA, and Cardiac MRI.J Imaging. 2024 Aug 8;10(8):193. doi: 10.3390/jimaging10080193. J Imaging. 2024. PMID: 39194982 Free PMC article.
-
Artificial intelligence for cardiac imaging is ready for widespread clinical use: Pro Con debate AI for cardiac imaging.BJR Open. 2025 Jun 6;7(1):tzaf015. doi: 10.1093/bjro/tzaf015. eCollection 2025 Jan. BJR Open. 2025. PMID: 40831572 Free PMC article. Review.
References
-
- Miao, Y. et al. A right ventricle segmentation method based on U-net with weighted convolution and dense connection. In Proceedings of the 2020 2nd International Conference on Intelligent Medicine and Image Processing 40–46 (ACM, 2020).
Publication types
MeSH terms
LinkOut - more resources
Full Text Sources
Medical

