. 2023 Jan 21;13(1):1227.
doi: 10.1038/s41598-023-28412-7.

A proteome scale study reveals how plastic surfaces and agitation promote protein aggregation

Affiliations

A proteome scale study reveals how plastic surfaces and agitation promote protein aggregation

Marion Schvartz et al. Sci Rep. .

Abstract

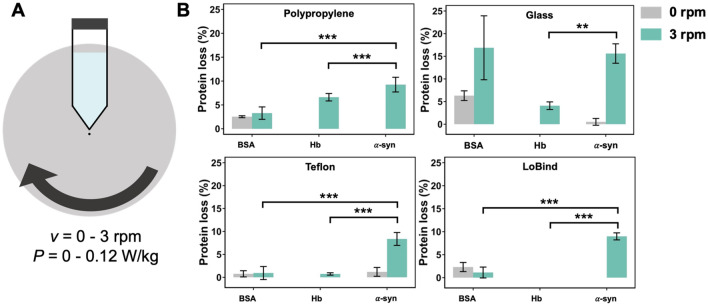
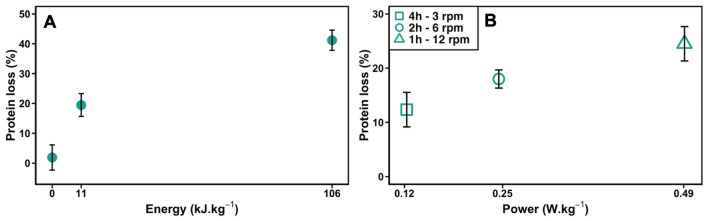
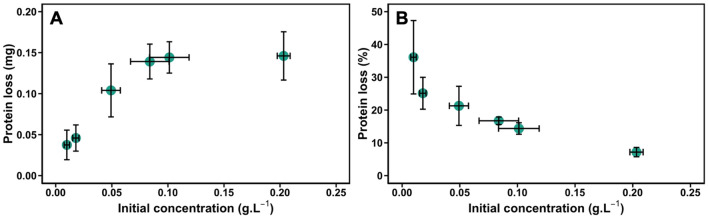
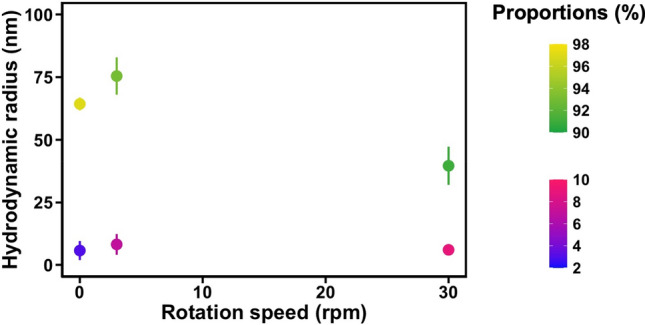
Protein aggregation in biotherapeutics can reduce their activity and effectiveness. It may also promote immune reactions responsible for severe adverse effects. The impact of plastic materials on protein destabilization is not totally understood. Here, we propose to deconvolve the effects of material surface, air/liquid interface, and agitation to decipher their respective role in protein destabilization and aggregation. We analyzed the effect of polypropylene, TEFLON, glass and LOBIND surfaces on the stability of purified proteins (bovine serum albumin, hemoglobin and α-synuclein) and on a cell extract composed of 6000 soluble proteins during agitation (P = 0.1-1.2 W/kg). Proteomic analysis revealed that chaperonins, intrinsically disordered proteins and ribosomes were more sensitive to the combined effects of material surfaces and agitation while small metabolic oligomers could be protected in the same conditions. Protein loss observations coupled to Raman microscopy, dynamic light scattering and proteomic allowed us to propose a mechanistic model of protein destabilization by plastics. Our results suggest that protein loss is not primarily due to the nucleation of small aggregates in solution, but to the destabilization of proteins exposed to material surfaces and their subsequent aggregation at the sheared air/liquid interface, an effect that cannot be prevented by using LOBIND tubes. A guidance can be established on how to minimize these adverse effects. Remove one of the components of this combined stress - material, air (even partially), or agitation - and proteins will be preserved.


Conflict of interest statement

The authors declare no competing interests.

Figures

Figure 1
Figure 1
(A) Scheme of the experimental setup designed to measure protein loss during agitation of purified protein solutions with a rotating wheel. The speed ranged from 0 to 3 rpm, corresponding to a power from 0 to 0.12 W/kg. Tubes made of PP, glass, TEFLON, LOBIND were used. A conical PP FISHERBRAND tube is represented. (B) Protein loss of BSA, Hb, α-syn solutions measured in PP, glass, TEFLON and LOBIND tubes after 24 h at 6 °C without (grey) and with agitation at 3 rpm (green) on a rotating wheel. The initial protein concentration was C0 = 0.1 g/L (V = 10 mL). Significant differences are determined using the Tukey’s “honestly significant difference” test realized from variance analysis (Anova) (*** p-value < 0.001; ** p-value < 0.01). To observe the effect of the protein nature, only the differences at 3 rpm are shown, all the statistical results are available in Table S3.
Figure 2
Figure 2
(A) Scheme of the experimental setup designed to measure protein loss during agitation of a protein solution with a rotating wheel. The speed ranged from 3 to 30 rpm corresponding to a power of 0.12 to 1.23 W/kg. Tubes made of PP, glass, TEFLON, LOBIND were used. A conical PP FISHERBRAND tube is represented. (B) Protein losses measured after 24 h agitation of YPE cell extract at 6 °C and 3 rpm in each tube. The initial protein concentration was C0 = 0.1 g/L and filled volume 60%. The error corresponds to the standard deviation for three biological replicates. Significant differences are determined using the Tukey’s “honestly significant difference” test realized from variance analysis (Anova) (*** p-value < 0.001).
Figure 3
Figure 3
Evolution of protein loss for YPE in PP tubes under agitation as a function of (A) the energy supplied to the system for a fixed duration of 24 h and a fixed power of 1.23 W/kg, (B) the power applied for a fixed energy of 1.8 kJ/kg. All samples were mixed at 6 °C on a rotating wheel.
Figure 4
Figure 4
Effect of the initial protein concentration on the protein loss for YPE cell extract. (A) Absolute protein loss in mg. (B) Percentage of protein loss. Samples were gently mixed in PP tubes on a rotating wheel at 3 rpm during 4 h at 6 °C.
Figure 5
Figure 5
Scheme picturing the three interfaces considered during protein agitation. (A) Solid/liquid interface at the material surface. (B) Air/liquid interface. (C) Triple air/liquid/solid line interface defining the meniscus. Proteins, represented as green dots, could adsorb to one or several of these interfaces during mixing.
Figure 6
Figure 6
Amount of adsorbed proteins on PP tubes in mg/m2 as a function of the rotational speed for YPE cell extracts. The power (P) and energy (E) are indicated for each condition. The adsorbed proteins were removed using 0.1% v/v sodium dodecyl sulfate (SDS) and the amount of proteins measured by UV spectroscopy. Significant differences are determined using the Tukey “honestly significant difference” test realized from variance analysis (Anova) (** p-value < 0.01).
Figure 7
Figure 7
In situ imaging in solution and biochemical analysis of the protein aggregates. (A) Optical images using reflected light and contour reconstruction. (B) Raman images of the particles P2, P3. Images corresponding to the Raman spectra of the protein aggregate and solution are shown in red and green, respectively. The overlay is shown at the bottom. Two biological replicates were analyzed for each condition.
Figure 8
Figure 8
Raman spectra of protein aggregates and YPE solution. (A) Average Raman spectra of aggregates formed in YPE solution at 0.1 g/L (red) and YPE solution at 0.1 g/L after mixing (blue). The individual spectra of protein aggregates are shown in grey. (B) Normalized Raman spectra of protein aggregates formed in YPE solution at 0.1 g/L (red) and YPE stock solution at 25 g/L (green). The spectra were normalized to the OH band of water at 3406 cm−1. * The Raman bands that are present in YPE solution but absent in protein aggregates are highlighted in grey.
Figure 9
Figure 9
Analysis of the hydrodynamic radius of particles formed in YPE solution after mixing in PP tubes on a rotating wheel as a function of the speed. The intensity size distribution was measured by DLS after filtration of the solutions at 1.2 µm to remove the larger aggregates. The percentage of each population (in intensity) is coded in color.
Figure 10
Figure 10
Model of protein destabilization by contact with plastic surfaces under agitation. (A) The affinity of the container surface for unfolded protein destabilizes the protein in solution through a conformational drift. This process is more important in case of fresh A/L and S/L interfaces. (B) The destabilized proteins adsorb at the A/L interface. Variations of interface quantity induce compression and decompression forces, promoting protein aggregation. (C) Shear forces may facilitate the transfer from and to interfaces in step A and break the protein films formed in step B. Adapted from Sluzky et al..
Figure 11
Figure 11
Quantitative proteomic analysis of protein depleted from and enriched in the solution after mixing YPE in PP, TEFLON, glass, LOBIND tubes at 3 rpm for 24 h at 6 °C. The color gradient indicates the status of the proteins: depleted (red) to enriched (green). The protein characteristics are issued from the Uniprot database. A list of all considered proteins is given in supporting file Proteomic-SI2.
Figure 12
Figure 12
Calculated number of depleted proteins as a function of the mass loss. The result of the Monte Carlo simulations is represented by the green line. The measured protein loss and the number of depleted proteins identified by proteomic analysis for PP surface is shown by a blue cross.

References

    1. Lundahl MLE, Fogli S, Colavita PE, Scanlan EM. Aggregation of protein therapeutics enhances their immunogenicity: Causes and mitigation strategies. RSC Chem. Biol. 2021;2:1004–1020. doi: 10.1039/D1CB00067E. - DOI - PMC - PubMed
    1. Rajan R, et al. Review of the current state of protein aggregation inhibition from a materials chemistry perspective: Special focus on polymeric materials. Mater. Adv. 2021;2:1139–1176. doi: 10.1039/D0MA00760A. - DOI
    1. Thomas CR, Geer D. Effects of shear on proteins in solution. Biotech. Lett. 2011;33:443–456. doi: 10.1007/s10529-010-0469-4. - DOI - PubMed
    1. Vroman L, Adams AL. Findings with the recording ellipsometer suggesting rapid exchange of specific plasma proteins at liquid/solid interfaces. Surf. Sci. 1969;16:438–446. doi: 10.1016/0039-6028(69)90037-5. - DOI
    1. Angioletti-Uberti S, Ballauff M, Dzubiella J. Competitive adsorption of multiple proteins to nanoparticles: The Vroman effect revisited. Mol. Phys. 2018;116:3154–3163. doi: 10.1080/00268976.2018.1467056. - DOI

Publication types