

Artificial neural network identified the significant genes to distinguish Idiopathic pulmonary fibrosis
- PMID: 36681777
- PMCID: PMC9867697
- DOI: 10.1038/s41598-023-28536-w
Artificial neural network identified the significant genes to distinguish Idiopathic pulmonary fibrosis
Abstract
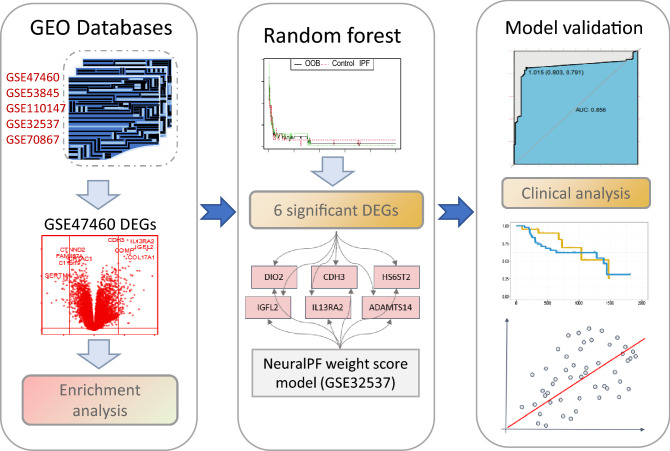
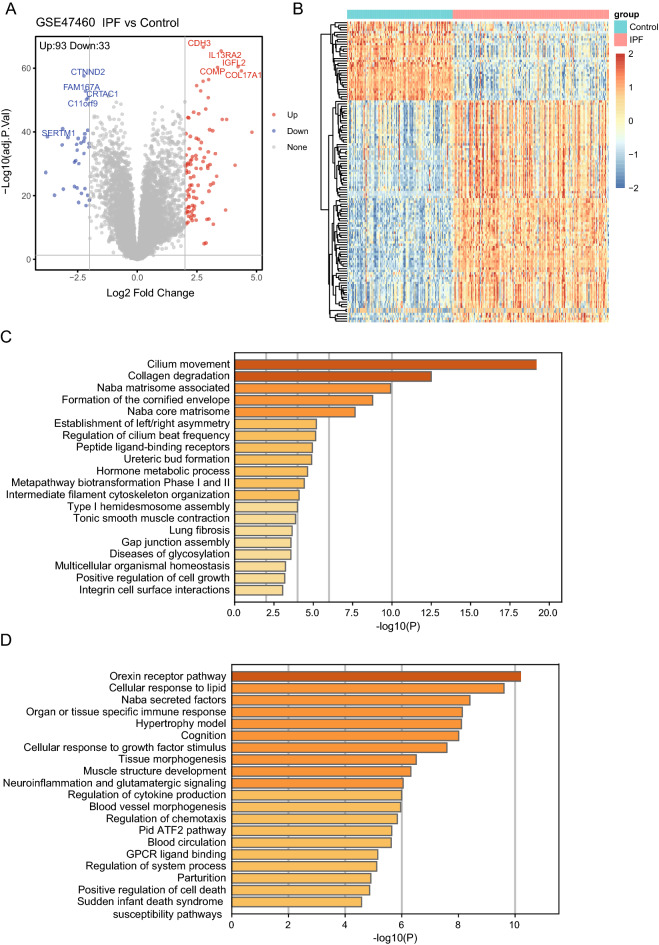
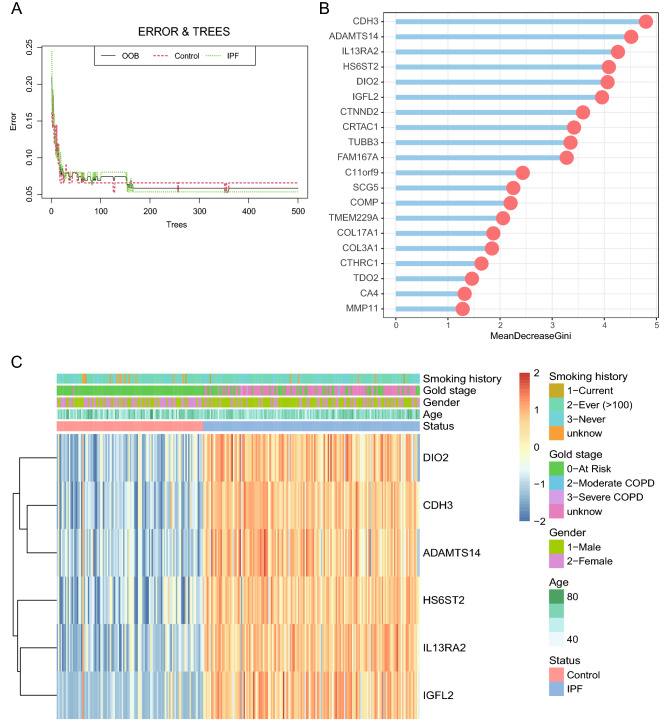
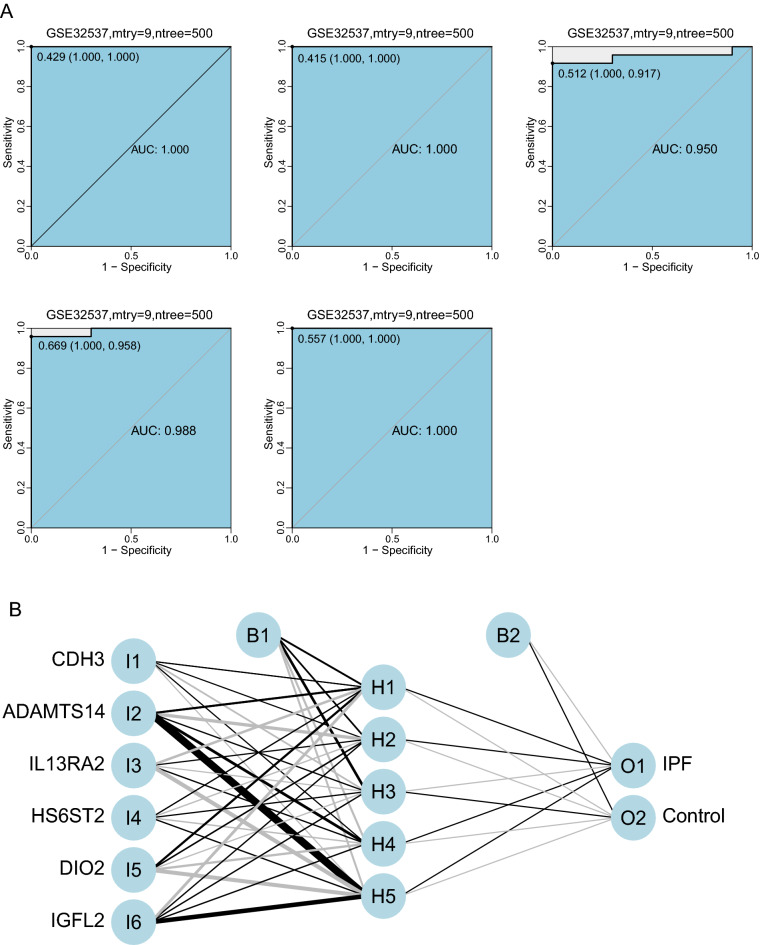
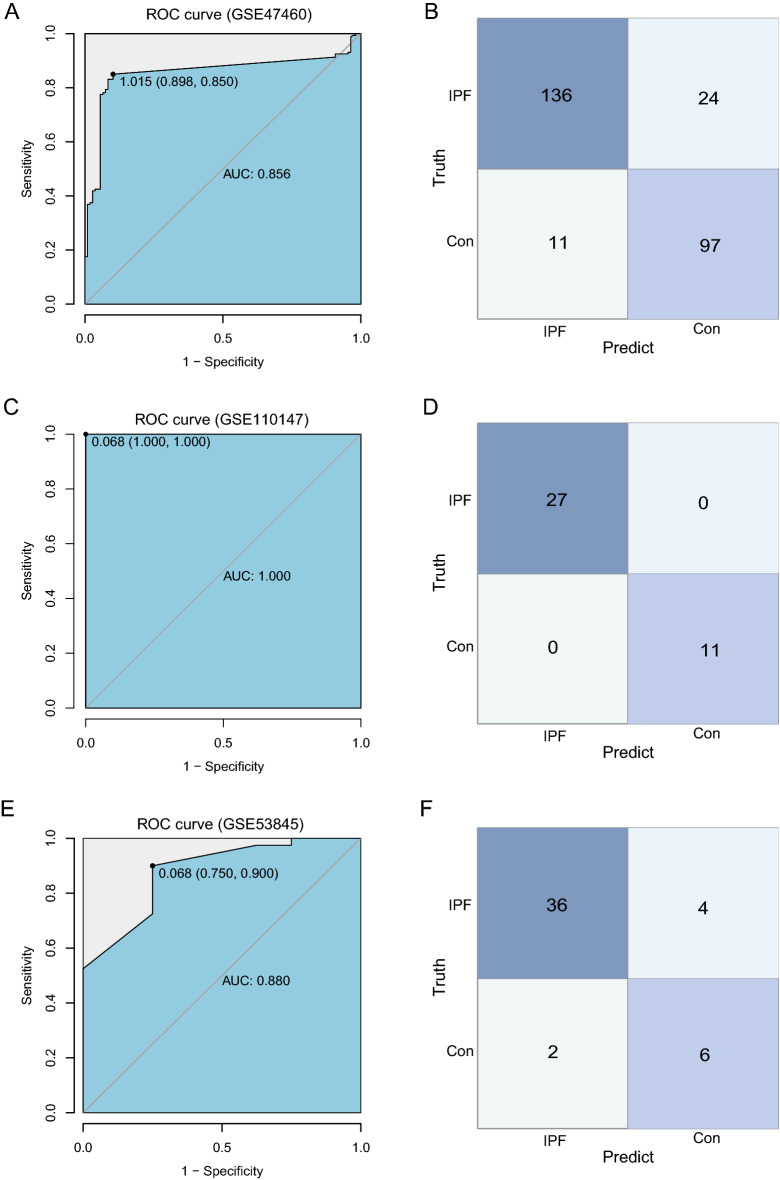
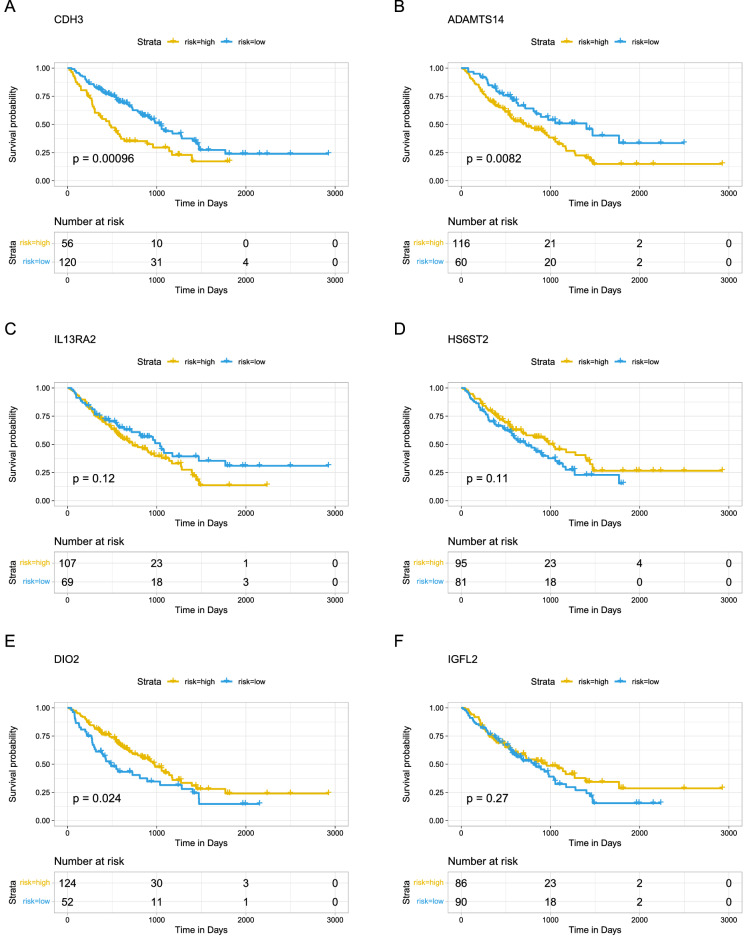
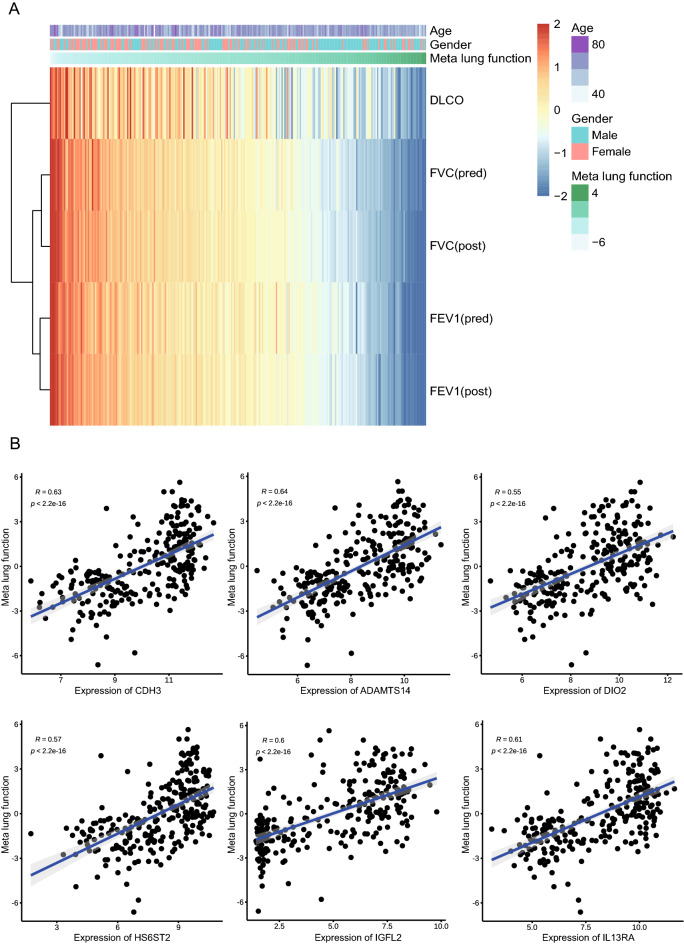
Idiopathic pulmonary fibrosis (IPF) is a progressive interstitial lung disease that causes irreversible damage to lung tissue characterized by excessive deposition of extracellular matrix (ECM) and remodeling of lung parenchyma. The current diagnosis of IPF is complex and usually completed by a multidisciplinary team including clinicians, radiologists and pathologists they work together and make decision for an effective treatment, it is imperative to introduce novel practical methods for IPF diagnosis. This study provided a new diagnostic model of idiopathic pulmonary fibrosis based on machine learning. Six genes including CDH3, DIO2, ADAMTS14, HS6ST2, IL13RA2, and IGFL2 were identified based on the differentially expressed genes in IPF patients compare to healthy subjects through a random forest classifier with the existing gene expression databases. An artificial neural network model was constructed for IPF diagnosis based these genes, and this model was validated by the distinctive public datasets with a satisfactory diagnostic accuracy. These six genes identified were significant correlated with lung function, and among them, CDH3 and DIO2 were further determined to be significantly associated with the survival. Putting together, artificial neural network model identified the significant genes to distinguish idiopathic pulmonary fibrosis from healthy people and it is potential for molecular diagnosis of IPF.
© 2023. The Author(s).
Conflict of interest statement
The authors declare no competing interests.
Figures
Similar articles
-
Construction of an artificial neural network diagnostic model and investigation of immune cell infiltration characteristics for idiopathic pulmonary fibrosis.BMC Pulm Med. 2024 Sep 17;24(1):458. doi: 10.1186/s12890-024-03249-6. BMC Pulm Med. 2024. PMID: 39289672 Free PMC article.
-
Multi-scale, domain knowledge-guided attention + random forest: a two-stage deep learning-based multi-scale guided attention models to diagnose idiopathic pulmonary fibrosis from computed tomography images.Med Phys. 2023 Feb;50(2):894-905. doi: 10.1002/mp.16053. Epub 2022 Nov 5. Med Phys. 2023. PMID: 36254789 Free PMC article.
-
Multicentre evaluation of multidisciplinary team meeting agreement on diagnosis in diffuse parenchymal lung disease: a case-cohort study.Lancet Respir Med. 2016 Jul;4(7):557-565. doi: 10.1016/S2213-2600(16)30033-9. Epub 2016 May 11. Lancet Respir Med. 2016. PMID: 27180021
-
Challenges in the diagnosis of idiopathic pulmonary fibrosis: the importance of a multidisciplinary approach.Expert Rev Respir Med. 2023 Apr;17(4):1-11. doi: 10.1080/17476348.2023.2199156. Epub 2023 Apr 26. Expert Rev Respir Med. 2023. PMID: 37005289 Review.
-
Potential biomarkers for diagnosis and disease evaluation of idiopathic pulmonary fibrosis.Chin Med J (Engl). 2023 Jun 5;136(11):1278-1290. doi: 10.1097/CM9.0000000000002171. Chin Med J (Engl). 2023. PMID: 37130223 Free PMC article. Review.
Cited by
-
A deep generative model for deciphering cellular dynamics and in silico drug discovery in complex diseases.Nat Biomed Eng. 2025 Jun 20. doi: 10.1038/s41551-025-01423-7. Online ahead of print. Nat Biomed Eng. 2025. PMID: 40542107
-
Construction of an artificial neural network diagnostic model and investigation of immune cell infiltration characteristics for idiopathic pulmonary fibrosis.BMC Pulm Med. 2024 Sep 17;24(1):458. doi: 10.1186/s12890-024-03249-6. BMC Pulm Med. 2024. PMID: 39289672 Free PMC article.
-
Recent Advances of Artificial Intelligence Applications in Interstitial Lung Diseases.Diagnostics (Basel). 2023 Jul 6;13(13):2303. doi: 10.3390/diagnostics13132303. Diagnostics (Basel). 2023. PMID: 37443696 Free PMC article. Review.
-
Matrix-free human lung organoids derived from induced pluripotent stem cells to model lung injury.Stem Cell Res Ther. 2024 Dec 18;15(1):468. doi: 10.1186/s13287-024-04106-3. Stem Cell Res Ther. 2024. PMID: 39696649 Free PMC article.
-
Genome-wide CRISPR/Cas9 screening identifies key profibrotic regulators of TGF-β1-induced epithelial-mesenchymal transformation and pulmonary fibrosis.Front Mol Biosci. 2025 Feb 17;12:1507163. doi: 10.3389/fmolb.2025.1507163. eCollection 2025. Front Mol Biosci. 2025. PMID: 40034336 Free PMC article.
References
-
- Hogan BL, Barkauskas CE, Chapman HA, Epstein JA, Jain R, Hsia CC, Niklason L, Calle E, Le A, Randell SH, et al. Repair and regeneration of the respiratory system: Complexity, plasticity, and mechanisms of lung stem cell function. Cell Stem Cell. 2014;15:123–138. doi: 10.1016/j.stem.2014.07.012. - DOI - PMC - PubMed
Publication types
MeSH terms
Substances
LinkOut - more resources
Full Text Sources
Medical
