

A novel machine learning model based on ubiquitin-related gene pairs and clinical features to predict prognosis and treatment effect in colon adenocarcinoma
- PMID: 36681855
- PMCID: PMC9863211
- DOI: 10.1186/s40001-023-00993-z
A novel machine learning model based on ubiquitin-related gene pairs and clinical features to predict prognosis and treatment effect in colon adenocarcinoma
Abstract
Background: Ubiquitin and ubiquitin-like (UB/UBL) conjugations are essential post-translational modifications that contribute to cancer onset and advancement. In colon adenocarcinoma (COAD), nonetheless, the biological role, as well as the clinical value of ubiquitin-related genes (URGs), is unclear. The current study sought to design and verify a ubiquitin-related gene pairs (URGPs)-related prognostic signature for predicting COAD prognoses.
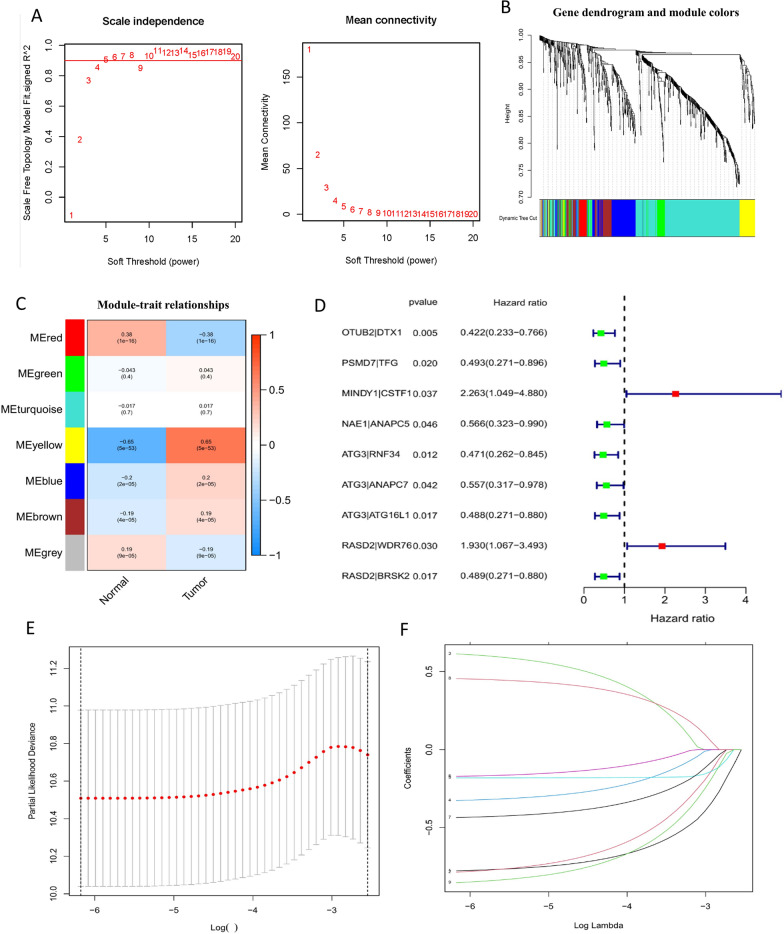
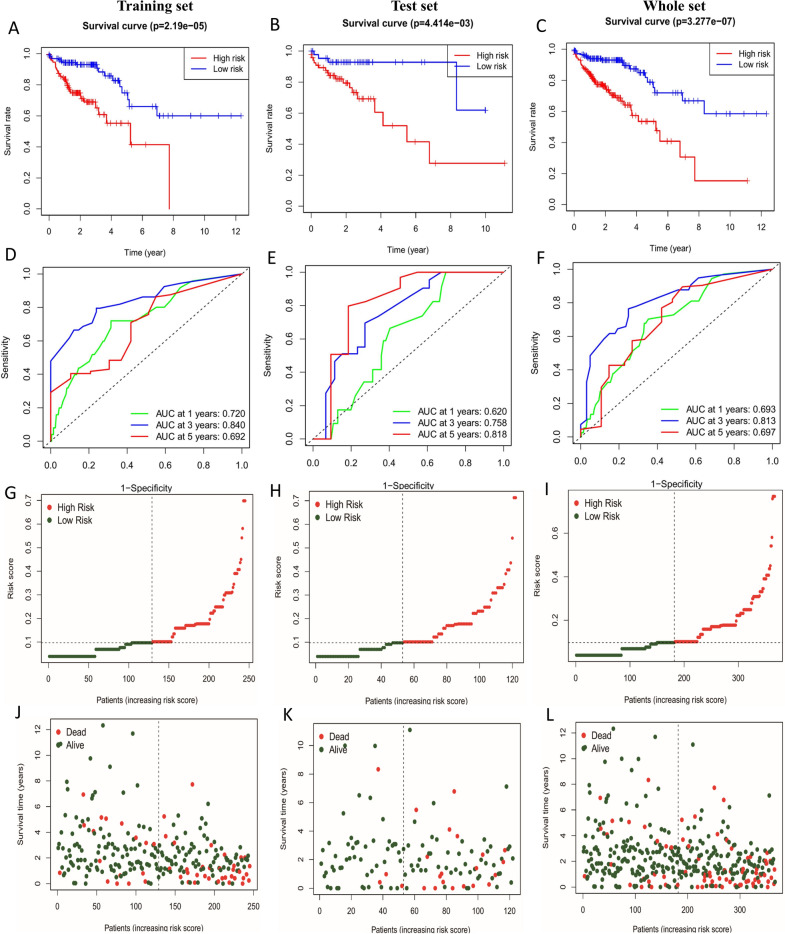
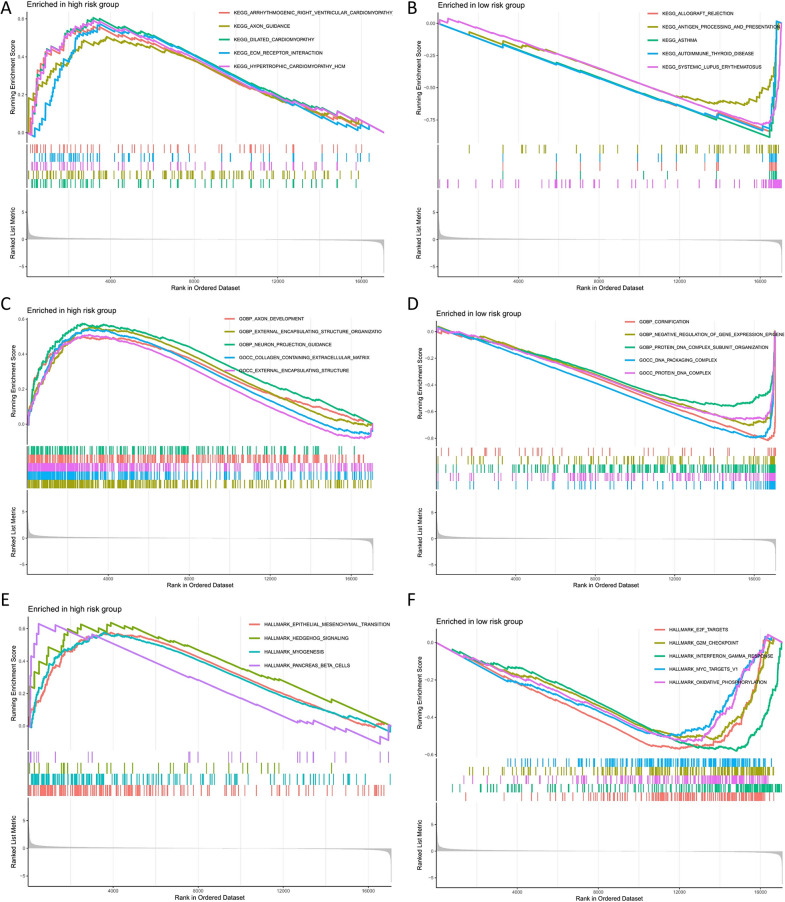
Methods: Using univariate, least absolute shrinkage and selection operator (LASSO), and multivariate Cox regression, URGP's predictive signature was discovered. Signatures differentiated high-risk and low-risk patients. ROC and Kaplan-Meier assessed URGPs' signature. Gene set enrichment analysis (GSEA) examined biological nomogram enrichment. Chemotherapy and tumor immune microenvironment were also studied.
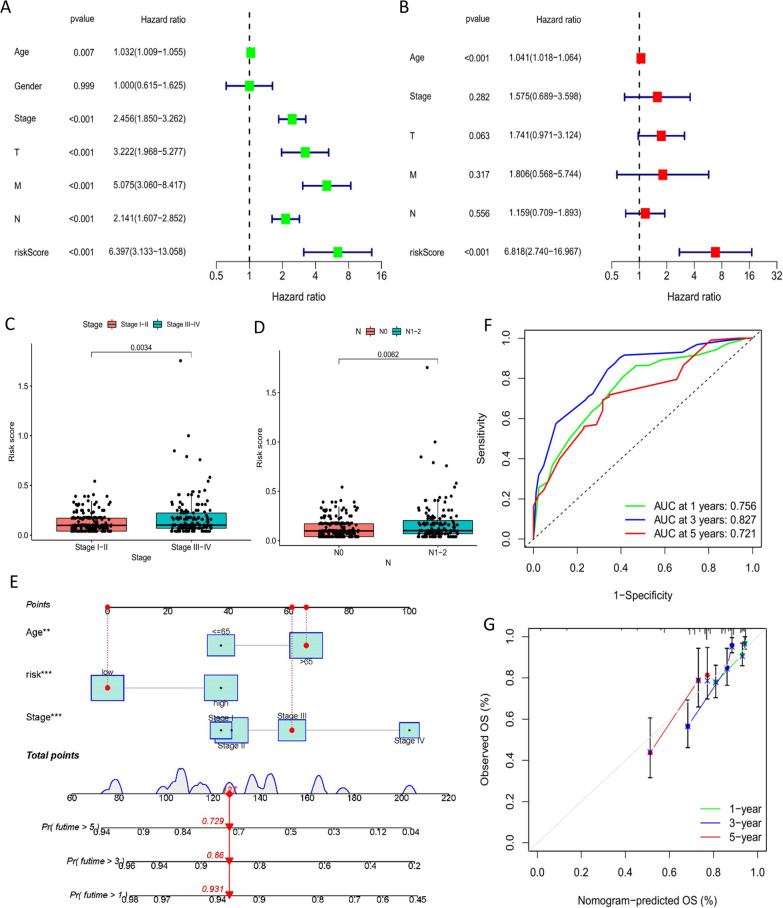
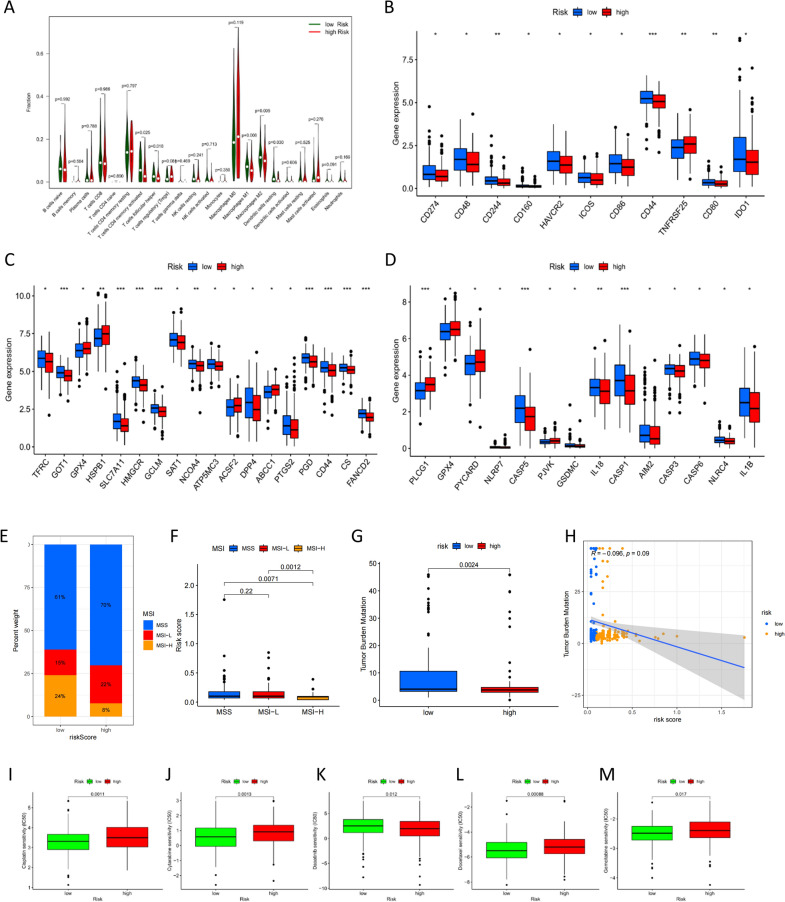
Results: The predictive signature used six URGPs. High-risk patients had a worse prognosis than low-risk patients, according to Kaplan-Meier. After adjusting for other clinical characteristics, the URGPs signature could reliably predict COAD patients. In the low-risk group, we found higher amounts of invading CD4 memory-activated T cells, follicular helper T cells, macrophages, and resting dendritic cells. Moreover, low-risk group had higher immune checkpoint-related gene expression and chemosensitivity.
Conclusion: Our research developed a nomogram and a URGPs prognostic signature to predict COAD prognosis, which may aid in patient risk stratification and offer an effective evaluation method of individualized treatment in clinical settings.
Keywords: Colon adenocarcinoma; Prognostic signature; Tumor immune microenvironment.
© 2023. The Author(s).
Conflict of interest statement
The authors state that there were no commercial or financial relationships that may be considered as a potential competing interest during the research.
Figures

Similar articles
-
Identification of a glycolysis- and lactate-related gene signature for predicting prognosis, immune microenvironment, and drug candidates in colon adenocarcinoma.Front Cell Dev Biol. 2022 Aug 23;10:971992. doi: 10.3389/fcell.2022.971992. eCollection 2022. Front Cell Dev Biol. 2022. PMID: 36081904 Free PMC article.
-
Construction of a novel choline metabolism-related signature to predict prognosis, immune landscape, and chemotherapy response in colon adenocarcinoma.Front Immunol. 2022 Nov 14;13:1038927. doi: 10.3389/fimmu.2022.1038927. eCollection 2022. Front Immunol. 2022. PMID: 36451813 Free PMC article.
-
Lactate Metabolism-Associated lncRNA Pairs: A Prognostic Signature to Reveal the Immunological Landscape and Mediate Therapeutic Response in Patients With Colon Adenocarcinoma.Front Immunol. 2022 Jul 11;13:881359. doi: 10.3389/fimmu.2022.881359. eCollection 2022. Front Immunol. 2022. PMID: 35911752 Free PMC article.
-
An Intratumor Heterogeneity-Related Signature for Predicting Prognosis, Immune Landscape, and Chemotherapy Response in Colon Adenocarcinoma.Front Med (Lausanne). 2022 Jul 7;9:925661. doi: 10.3389/fmed.2022.925661. eCollection 2022. Front Med (Lausanne). 2022. PMID: 35872794 Free PMC article.
-
A novel signature model based on mitochondrial-related genes for predicting survival of colon adenocarcinoma.BMC Med Inform Decis Mak. 2022 Oct 22;22(1):277. doi: 10.1186/s12911-022-02020-3. BMC Med Inform Decis Mak. 2022. PMID: 36273131 Free PMC article.
Cited by
-
A novel model based on protein post-translational modifications comprising the immune landscape and prediction of colorectal cancer prognosis.J Gastrointest Oncol. 2024 Aug 31;15(4):1592-1612. doi: 10.21037/jgo-24-45. Epub 2024 Jul 16. J Gastrointest Oncol. 2024. PMID: 39279963 Free PMC article.
References
-
- Kriegsmann M, Longuespee R, Wandernoth P, Mohanu C, Lisenko K, Weichert W, Warth A, Dienemann H, De Pauw E, Katzenberger T, Aust D, Baretton G, Kriegsmann J, Casadonte R. Typing of colon and lung adenocarcinoma by high throughput imaging mass spectrometry. Biochim Biophys Acta Proteins Proteom. 2017;1865:858–864. doi: 10.1016/j.bbapap.2016.11.018. - DOI - PubMed
-
- Cass AW, Million RR, Pfaff WW. Patterns of recurrence following surgery alone for adenocarcinoma of the colon and rectum. Cancer AM Cancer Soc. 1976;37:2861–2865. - PubMed
MeSH terms
Substances
Grants and funding
LinkOut - more resources
Full Text Sources
Research Materials
