

Thermosensitive Biodegradable Hydrogels for Local and Controlled Cerebral Delivery of Proteins: MRI-Based Monitoring of In Vitro and In Vivo Protein Release
- PMID: 36681938
- PMCID: PMC9930091
- DOI: 10.1021/acsbiomaterials.2c01224
Thermosensitive Biodegradable Hydrogels for Local and Controlled Cerebral Delivery of Proteins: MRI-Based Monitoring of In Vitro and In Vivo Protein Release
Abstract
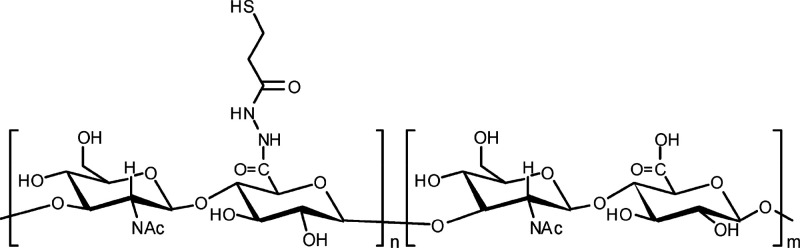
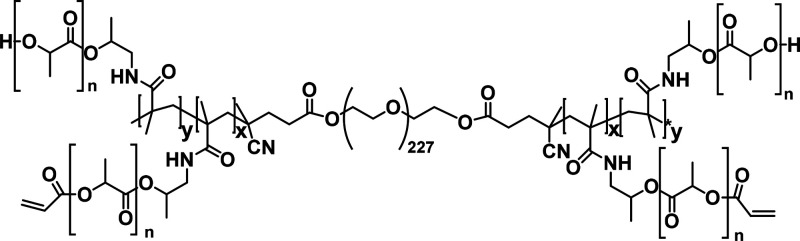
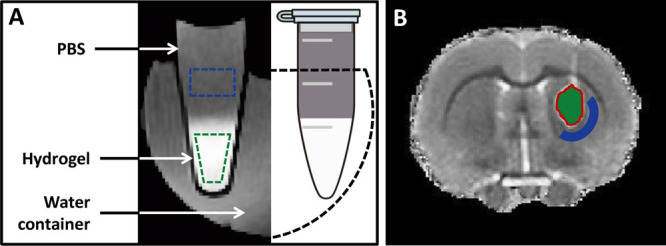
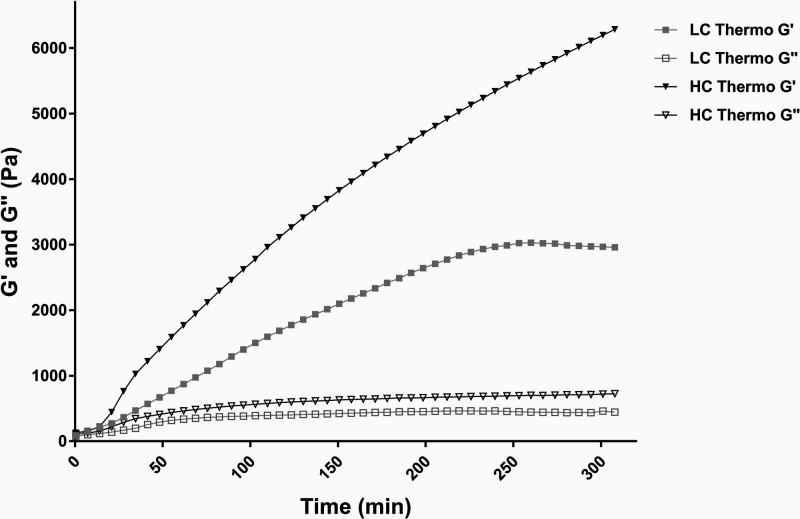
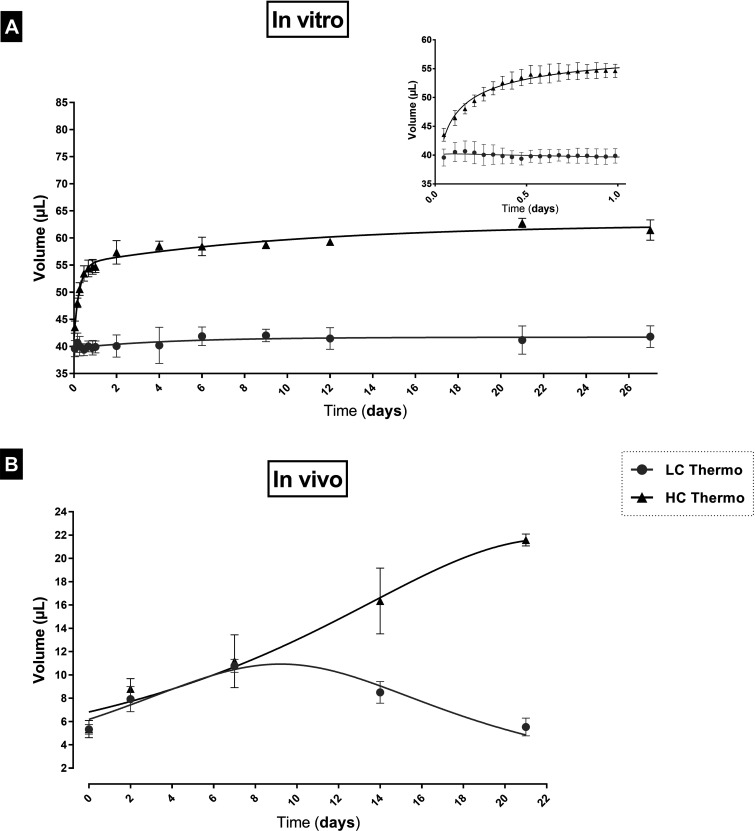
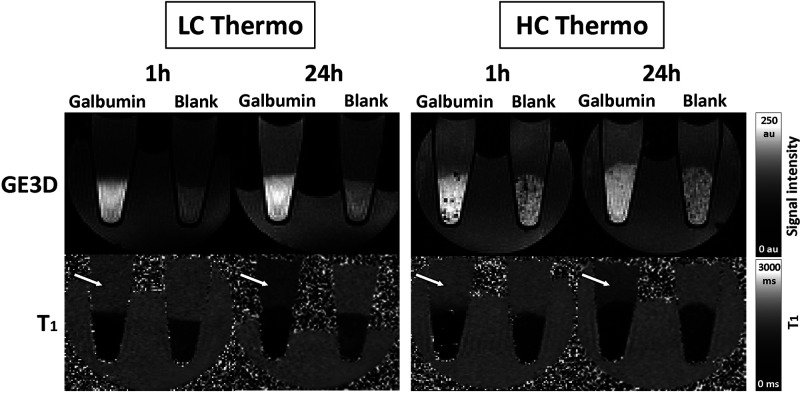
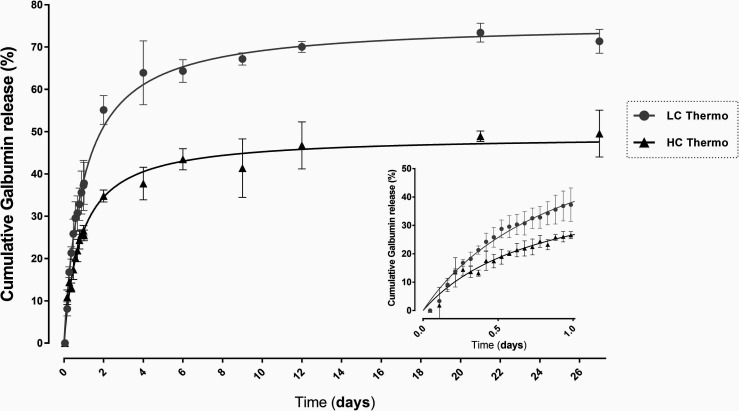
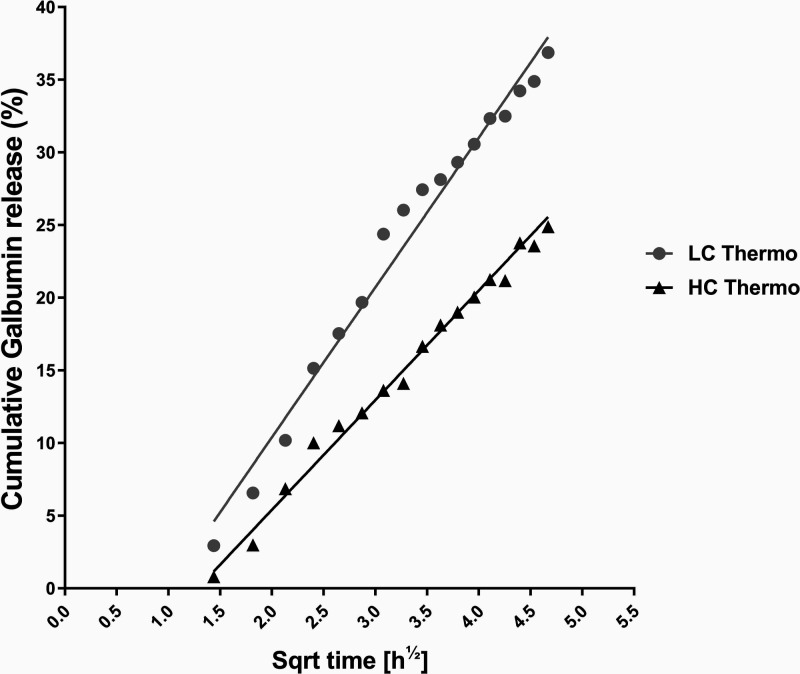
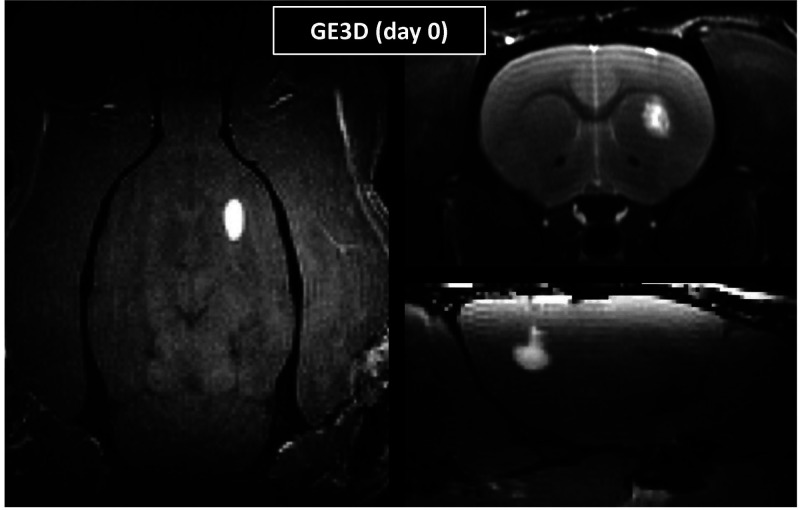
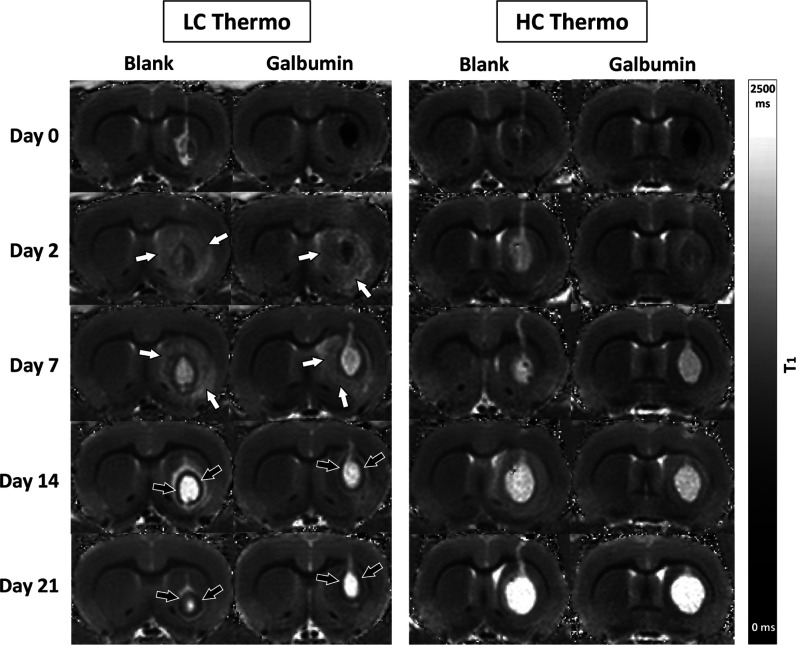
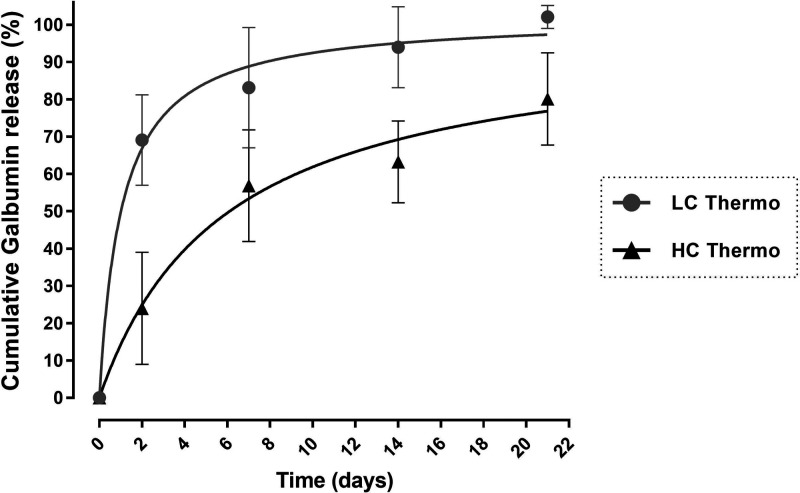
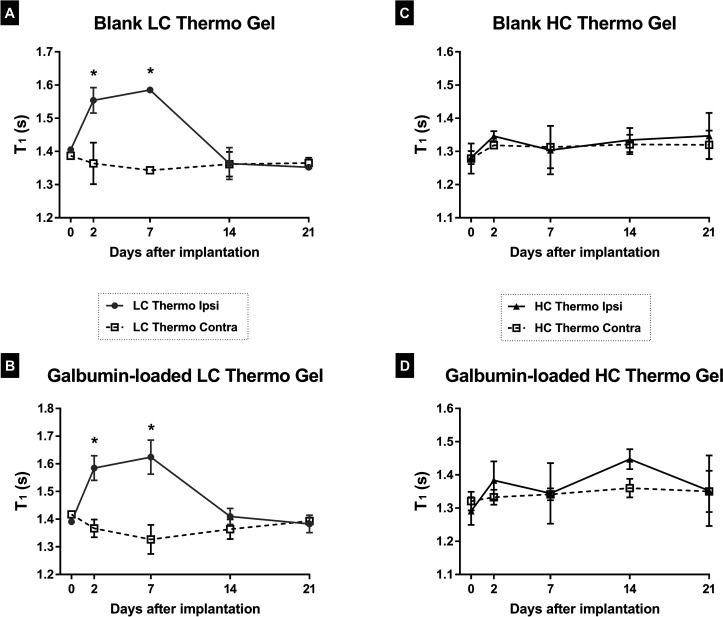
Hydrogels have been suggested as novel drug delivery systems for sustained release of therapeutic proteins in various neurological disorders. The main advantage these systems offer is the controlled, prolonged exposure to a therapeutically effective dose of the released drug after a single intracerebral injection. Characterization of controlled release of therapeutics from a hydrogel is generally performed in vitro, as current methods do not allow for in vivo measurements of spatiotemporal distribution and release kinetics of a loaded protein. Importantly, the in vivo environment introduces many additional variables and factors that cannot be effectively simulated under in vitro conditions. To address this, in the present contribution, we developed a noninvasive in vivo magnetic resonance imaging (MRI) method to monitor local protein release from two injected hydrogels of the same chemical composition but different initial water contents. We designed a biodegradable hydrogel formulation composed of low and high concentration thermosensitive polymer and thiolated hyaluronic acid, which is liquid at room temperature and forms a gel due to a combination of physical and chemical cross-linking upon injection at 37 °C. The in vivo protein release kinetics from these gels were assessed by MRI analysis utilizing a model protein labeled with an MR contrast agent, i.e. gadolinium-labeled albumin (74 kDa). As proof of principle, the release kinetics of the hydrogels were first measured with MRI in vitro. Subsequently, the protein loaded hydrogels were administered in male Wistar rat brains and the release in vivo was monitored for 21 days. In vitro, the thermosensitive hydrogels with an initial water content of 81 and 66% released 64 ± 3% and 43 ± 3% of the protein loading, respectively, during the first 6 days at 37 °C. These differences were even more profound in vivo, where the thermosensitive hydrogels released 83 ± 16% and 57 ± 15% of the protein load, respectively, 1 week postinjection. Measurement of volume changes of the gels over time showed that the thermosensitive gel with the higher polymer concentration increased more than 4-fold in size in vivo after 3 weeks, which was substantially different from the in vitro behavior where a volume change of 35% was observed. Our study demonstrates the potential of MRI to noninvasively monitor in vivo intracerebral protein release from a locally administered in situ forming hydrogel, which could aid in the development and optimization of such drug delivery systems for brain disorders.
Keywords: IVIVR; contrast MRI; drug delivery; in situ hydrogel; protein release; sustained release.
Conflict of interest statement
The authors declare no competing financial interest.
Figures
Similar articles
-
Pharmacokinetic Evaluation of Thermosensitive Sustained Release Formulations Developed for Subcutaneous Delivery of Protein Therapeutics.J Pharm Sci. 2023 Mar;112(3):868-876. doi: 10.1016/j.xphs.2022.11.022. Epub 2022 Dec 2. J Pharm Sci. 2023. PMID: 36470345
-
Thermo-responsive Diels-Alder stabilized hydrogels for ocular drug delivery of a corticosteroid and an anti-VEGF fab fragment.J Control Release. 2023 Sep;361:334-349. doi: 10.1016/j.jconrel.2023.07.052. Epub 2023 Aug 10. J Control Release. 2023. PMID: 37532147
-
Updates on thermosensitive hydrogel for nasal, ocular and cutaneous delivery.Int J Pharm. 2019 Mar 25;559:86-101. doi: 10.1016/j.ijpharm.2019.01.030. Epub 2019 Jan 21. Int J Pharm. 2019. PMID: 30677480
-
Thermosensitive polymeric hydrogels as drug delivery systems.Curr Med Chem. 2013;20(1):79-94. Curr Med Chem. 2013. PMID: 23092130 Review.
-
Preparation, thermal response mechanisms and biomedical applications of thermosensitive hydrogels for drug delivery.Expert Opin Drug Deliv. 2023 May;20(5):641-672. doi: 10.1080/17425247.2023.2217377. Epub 2023 Jun 1. Expert Opin Drug Deliv. 2023. PMID: 37218585 Review.
Cited by
-
A Comprehensive Review of Hydrogel-Based Drug Delivery Systems: Classification, Properties, Recent Trends, and Applications.AAPS PharmSciTech. 2024 Mar 21;25(4):64. doi: 10.1208/s12249-024-02786-x. AAPS PharmSciTech. 2024. PMID: 38514495 Review.
-
Introductory Review of Soft Implantable Bioelectronics Using Conductive and Functional Hydrogels and Hydrogel Nanocomposites.Gels. 2024 Sep 25;10(10):614. doi: 10.3390/gels10100614. Gels. 2024. PMID: 39451267 Free PMC article. Review.
-
The role of hydrogels in the management of brain tumours: a narrative review.Ann Med Surg (Lond). 2024 Feb 8;86(4):2004-2010. doi: 10.1097/MS9.0000000000001809. eCollection 2024 Apr. Ann Med Surg (Lond). 2024. PMID: 38576913 Free PMC article. Review.
-
Development of a local controlled release system for therapeutic proteins in the treatment of skeletal muscle injuries and diseases.Cell Death Dis. 2024 Jul 2;15(7):470. doi: 10.1038/s41419-024-06645-2. Cell Death Dis. 2024. PMID: 38956034 Free PMC article.
-
A Simple Method to Determine Diffusion Coefficients in Soft Hydrogels for Drug Delivery and Biomedical Applications.ACS Omega. 2025 Mar 11;10(11):10852-10865. doi: 10.1021/acsomega.4c06984. eCollection 2025 Mar 25. ACS Omega. 2025. PMID: 40160789 Free PMC article.
References
Publication types
MeSH terms
Substances
LinkOut - more resources
Full Text Sources
Research Materials
