. 2023:37:103327.
doi: 10.1016/j.nicl.2023.103327. Epub 2023 Jan 18.

Hippocampal subfield viscoelasticity in amnestic mild cognitive impairment evaluated with MR elastography

Affiliations

Hippocampal subfield viscoelasticity in amnestic mild cognitive impairment evaluated with MR elastography

Peyton L Delgorio et al. Neuroimage Clin. 2023.

Abstract

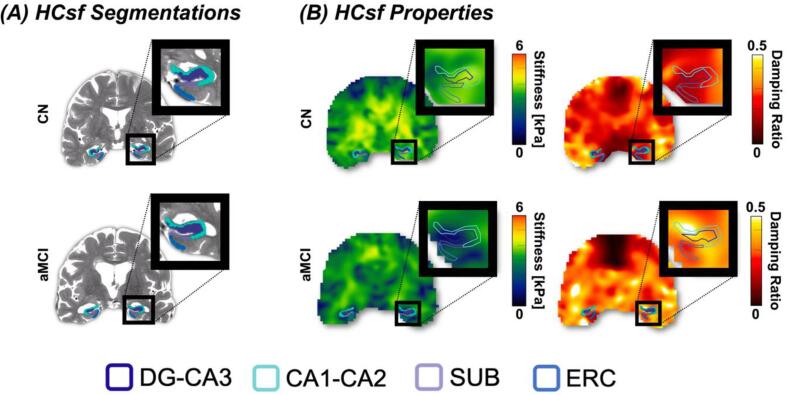
Hippocampal subfields (HCsf) are brain regions important for memory function that are vulnerable to decline with amnestic mild cognitive impairment (aMCI), which is often a preclinical stage of Alzheimer's disease. Studies in aMCI patients often assess HCsf tissue integrity using measures of volume, which has little specificity to microstructure and pathology. We use magnetic resonance elastography (MRE) to examine the viscoelastic mechanical properties of HCsf tissue, which is related to structural integrity, and sensitively detect differences in older adults with aMCI compared to an age-matched control group. Group comparisons revealed HCsf viscoelasticity is differentially affected in aMCI, with CA1-CA2 and DG-CA3 exhibiting lower stiffness and CA1-CA2 exhibiting higher damping ratio, both indicating poorer tissue integrity in aMCI. Including HCsf stiffness in a logistic regression improves classification of aMCI beyond measures of volume alone. Additionally, lower DG-CA3 stiffness predicted aMCI status regardless of DG-CA3 volume. These findings showcase the benefit of using MRE in detecting subtle pathological tissue changes in individuals with aMCI via the HCsf particularly affected in the disease.

Keywords: Brain; Hippocampus; Mechanical Properties; Mild Cognitive Impairment; Neurodegeneration; Stiffness.


Conflict of interest statement

Declaration of Competing Interest The authors declare that they have no known competing financial interests or personal relationships that could have appeared to influence the work reported in this paper.

Figures

Fig. 1
Fig. 1
Overview of the HCsf regions from the MRE Pipeline (Delgorio et al., 2021). (A) Volume Segmentations of the HCsf regions of interest: Dentate Gyrus-Cornu Ammonis 3 (DG-CA3), Cornu Ammonis 1–2 (CA1-CA2), Subiculum (SUB), and Entorhinal Cortex (ERC) using Automated Segmentation of Hippocampal Subfields (ASHS). (B) Generating the shear stiffness and damping ratio property maps. Examples for both MRE metrics are shown for a CN participant (77 y, female) and an aMCI participant (74 y, female).
Fig. 2
Fig. 2
HCsf μ differences between CN and aMCI groups. (A) Normalized HCsf μ plots showing significant differences in both the CA1-CA2 μ (p = 0.007) and DG-CA3 μ (p = 0.034) regions between groups. Cohen’s d effect sizes for each region are shown on the plot, with medium effect sizes shown for the DG-CA3 and CA1-CA2 regions, while SUB displayed a small-medium effect size and ERC displayed a small effect size. *: p < 0.05; **: p < 0.01. (B) Illustration of significant group × HCsf interaction where group μ differences significantly varied between regions.
Fig. 3
Fig. 3
HCsf ξ differences between CN and aMCI groups. (A) Normalized HCsf ξ plots showing significant differences in CA1-CA2 ξ (p = 0.025) between groups. Cohen’s d effect sizes for each region are shown on the plot, with a medium-large effect size shown for CA1-CA2, while the other HCsf regions displayed small-medium effect sizes. *: p < 0.05. (B) Illustration of significant group × HCsf interaction where group ξ differences significantly varied between regions.
Fig. 4
Fig. 4
HCsf volume differences between CN and aMCI groups. (A) Normalized HCsf volume plots showing significant differences in all HCsf (p < 0.05) between groups. Cohen’s d effect sizes for each region are shown on the plot, with large effect sizes shown for DG-CA3, CA1-CA2, and SUB, while ERC displayed a medium effect size. *: p < 0.05; ***: p < 0.001. (B) Illustration of significant group × HCsf interaction where group volume differences significantly varied between regions.
Fig. 5
Fig. 5
Receiver operating characteristic (ROC) curves for significant HCsf predictors in classifying group differences between CN and aMCI, with area under the curve (AUC) included as a measure of predictive performance. (A) CA1-CA2 ROC curves: CA1-CA2 μ, CA1-CA2 volume, and combined CA1-CA2 μ and volume predictors from the logistic regression, with the combined ROC curve performing the best of the three (AUC = 0.85). (B) DG-CA3 ROC curves: DG-CA3 μ, DG-CA3 volume, and combined DG-CA3 μ and volume predictors from the logistic regression, with the combined ROC curve performing the best of the three (AUC = 0.83).
Fig. 6
Fig. 6
Overview of the relationship between predicted probability of aMCI classification and DG-CA3 μ for both the low-volume group (purple line) and high-volume group (turquoise line). Both groups show that higher predicted probabilities significantly associated with lower DG-CA3 μ for both groups. The low volume group displayed a significant, linear relationship between predicted probability of aMCI (Pr-aMCI) and DG-CA3 μ (B = -0.11, p < 0.001), while the high volume group displayed a significant non-linear relationship between Pr-aMCI and DG-CA3 μ ([DG-CA3 μ: B = -2.94, p < 0.001]; [DG-CA3 μ2: B = 0.43, p < 0.001]).

References

    1. Albert M.S., DeKosky S.T., Dickson D., Dubois B., Feldman H.H., Fox N.C., Gamst A., Holtzman D.M., Jagust W.J., Petersen R.C., Snyder P.J., Carrillo M.C., Thies B., Phelps C.H. The diagnosis of mild cognitive impairment due to Alzheimer’s disease: Recommendations from the National Institute on Aging-Alzheimer’s Association workgroups on diagnostic guidelines for Alzheimer’s disease. Alzheimer’s Dement. 2011;7:270–279. doi: 10.1016/j.jalz.2011.03.008. - DOI - PMC - PubMed
    1. Arani A., Murphy M.C., Glaser K.J., Manduca A., Lake D.S., Kruse S.A., Jack C.R., Ehman R.L., Huston J. Measuring the effects of aging and sex on regional brain stiffness with MR elastography in healthy older adults. Neuroimage. 2015;111:59–64. - PMC - PubMed
    1. Benedict R.H.B., Schretlen D., Groninger L., Brandt J. Hopkins verbal learning test - Revised: Normative data and analysis of inter-form and test-retest reliability. Clin. Neuropsychol. 1998;12:43–55. doi: 10.1076/clin.12.1.43.1726. - DOI
    1. Bigot M., Chauveau F., Amaz C., Sinkus R., Beuf O., Lambert S.A. The apparent mechanical effect of isolated amyloid-β and α-synuclein aggregates revealed by multi-frequency MRE. NMR Biomed. 2020;33:e4174. - PubMed
    1. Braak H., Braak E. Neuropathological stageing of Alzheimer-related changes. Acta Neuropathol. 1991;82(4):239–259. - PubMed

Publication types