

AutoRG: An automatized reach-to-grasp platform technology for assessing forelimb motor function, neural circuit activation, and cognition in rodents
- PMID: 36682731
- PMCID: PMC10071513
- DOI: 10.1016/j.jneumeth.2023.109798
AutoRG: An automatized reach-to-grasp platform technology for assessing forelimb motor function, neural circuit activation, and cognition in rodents
Abstract
Background: Rodent reach-to-grasp function assessment is a translationally powerful model for evaluating neurological function impairments and recovery responses. Existing assessment platforms are experimenter-dependent, costly, or low-throughput with limited output measures. Further, a direct histologic comparison of neural activation has never been conducted between any novel, automated platform and the well-established single pellet skilled reach task (SRT).
New method: To address these technological and knowledge gaps, we designed an open-source, low-cost Automatized Reach-to-Grasp (AutoRG) pull platform that reduces experimenter interventions and variability. We assessed reach-to-grasp function in rats across seven progressively difficult stages using AutoRG. We mapped AutoRG and SRT-activated motor circuitries in the rat brain using volumetric imaging of the immediate early gene-encoded Arc (activity-regulated cytoskeleton-associated) protein.
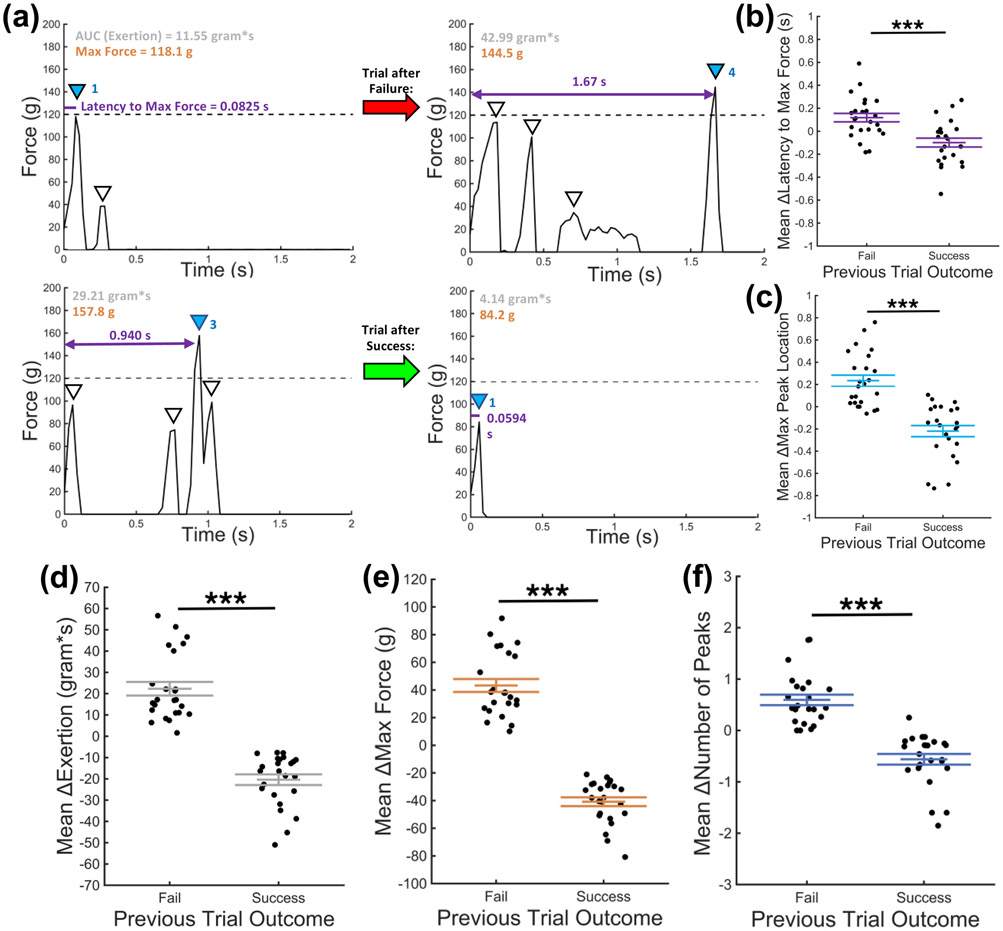
Results: Rats demonstrated robust forelimb reaching and pulling behavior after training in AutoRG. Reliable force versus time responses were recorded for individual reach events in real time, which were used to derive several secondary functional measures of performance. Moreover, we provide the first demonstration that for a training period of 30 min, AutoRG and SRT both engage similar neural responses in the caudal forelimb area (CFA), rostral forelimb area (RFA), and sensorimotor area (S1).
Conclusion: AutoRG is the first low-cost, open-source pull system designed for the scale-up of volitional forelimb motor function testing and characterization of rodent reaching behavior. The similarities in neuronal activation patterns observed in the rat motor cortex after SRT and AutoRG assessments validate the AutoRG as a rigorously characterized, scalable alternative to the conventional SRT and expensive commercial systems.
Keywords: Immediate early gene; Motor circuitry; Open-source; Reach-to-grasp; Rodents; Volumetric brain imaging.
Copyright © 2023 The Authors. Published by Elsevier B.V. All rights reserved.
Conflict of interest statement
Declaration of Competing Interest None.
Figures


Similar articles
-
Improved single pellet grasping using automated ad libitum full-time training robot.Behav Brain Res. 2015 Mar 15;281:137-48. doi: 10.1016/j.bbr.2014.11.048. Epub 2014 Dec 16. Behav Brain Res. 2015. PMID: 25523027
-
An automated behavioral box to assess forelimb function in rats.J Neurosci Methods. 2015 May 15;246:30-7. doi: 10.1016/j.jneumeth.2015.03.008. Epub 2015 Mar 10. J Neurosci Methods. 2015. PMID: 25769277 Free PMC article.
-
Prolonged acute intermittent hypoxia improves forelimb reach-to-grasp function in a rat model of chronic cervical spinal cord injury.Exp Neurol. 2021 Jun;340:113672. doi: 10.1016/j.expneurol.2021.113672. Epub 2021 Feb 27. Exp Neurol. 2021. PMID: 33652030 Review.
-
Evolution of Gross Forelimb and Fine Digit Kinematics during Skilled Reaching Acquisition in Rats.eNeuro. 2021 Oct 27;8(5):ENEURO.0153-21.2021. doi: 10.1523/ENEURO.0153-21.2021. Print 2021 Sep-Oct. eNeuro. 2021. PMID: 34625461 Free PMC article.
-
Neurostimulation and Reach-to-Grasp Function Recovery Following Acquired Brain Injury: Insight From Pre-clinical Rodent Models and Human Applications.Front Neurol. 2020 Jul 21;11:835. doi: 10.3389/fneur.2020.00835. eCollection 2020. Front Neurol. 2020. PMID: 32849253 Free PMC article. Review.
Cited by
-
An Open-Source Joystick Platform for Investigating Forelimb Motor Control, Auditory-Motor Integration, and Value-Based Decision-Making in Head-Fixed Mice.bioRxiv [Preprint]. 2025 Jan 23:2025.01.23.634598. doi: 10.1101/2025.01.23.634598. bioRxiv. 2025. Update in: eNeuro. 2025 Apr 28;12(4):ENEURO.0038-25.2025. doi: 10.1523/ENEURO.0038-25.2025. PMID: 39896607 Free PMC article. Updated. Preprint.
-
Neuritogenic glycosaminoglycan hydrogels promote functional recovery after severe traumatic brain injury.J Neural Eng. 2024 Jun 27;21(3):036058. doi: 10.1088/1741-2552/ad5108. J Neural Eng. 2024. PMID: 38806019 Free PMC article.
-
An Open-Source Joystick Platform for Investigating Forelimb Motor Control, Auditory-Motor Integration, and Value-Based Decision-Making in Head-Fixed Mice.eNeuro. 2025 Apr 28;12(4):ENEURO.0038-25.2025. doi: 10.1523/ENEURO.0038-25.2025. Print 2025 Apr. eNeuro. 2025. PMID: 40295100 Free PMC article.
-
Corticocortical connections of the rostral forelimb area in rats: a quantitative tract-tracing study.Cereb Cortex. 2024 Jan 31;34(2):bhad530. doi: 10.1093/cercor/bhad530. Cereb Cortex. 2024. PMID: 38265300 Free PMC article.
References
-
- Alstermark B, Ogawa J, Isa T, 2004. Lack of monosynaptic corticomotoneuronal EPSPs in Rats: disynaptic EPSPs mediated via reticulospinal neurons and polysynaptic EPSPs via segmental interneurons. J. Neurophysiol 91 (4), 1832–1839. - PubMed
-
- Arnold BM, et al., 2021. Prolonged acute intermittent hypoxia improves forelimb reach-to-grasp function in a rat model of chronic cervical spinal cord injury. Exp. Neurol 340. - PubMed
Publication types
MeSH terms
Grants and funding
LinkOut - more resources
Full Text Sources
