. 2023 Apr 3;191(4):2570-2587.
doi: 10.1093/plphys/kiad030.

Alternative 3'-untranslated regions regulate high-salt tolerance of Spartina alterniflora

Affiliations

Alternative 3'-untranslated regions regulate high-salt tolerance of Spartina alterniflora

Taotao Wang et al. Plant Physiol. .

Erratum in

Abstract

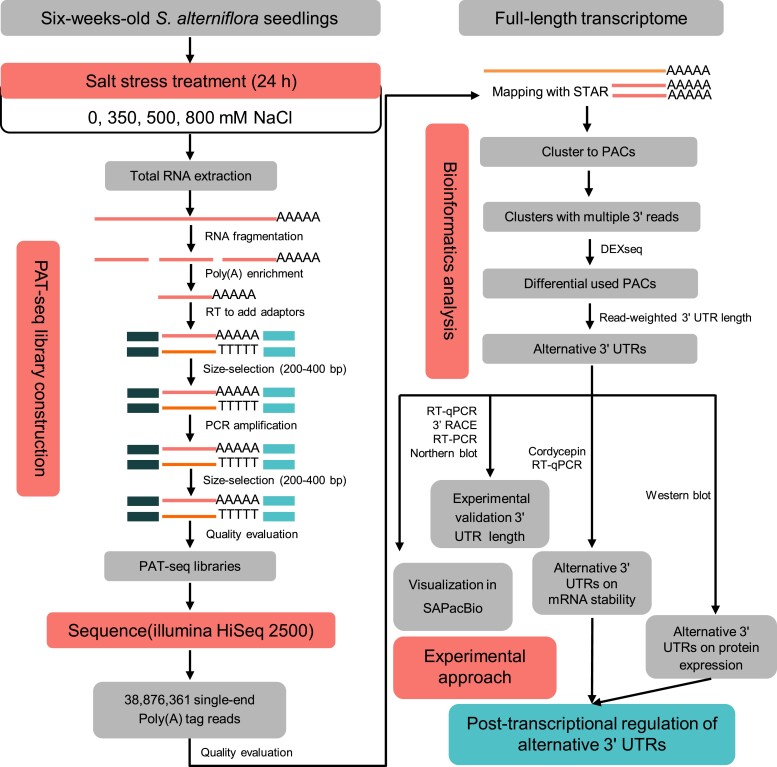
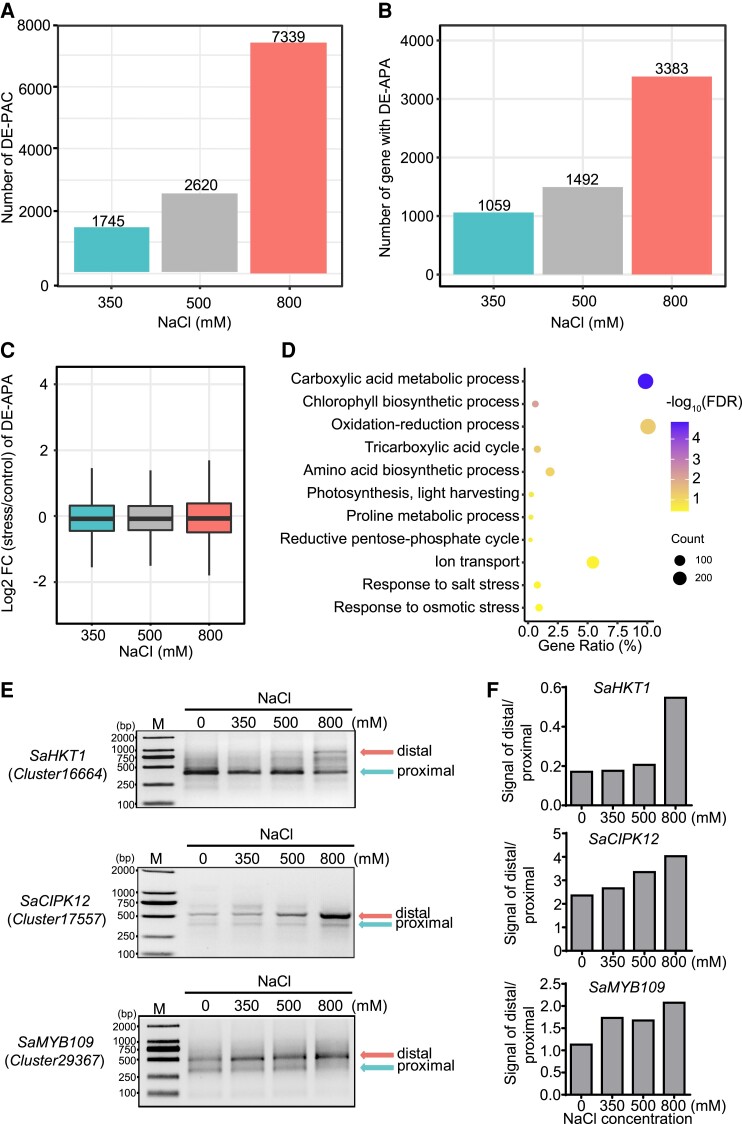
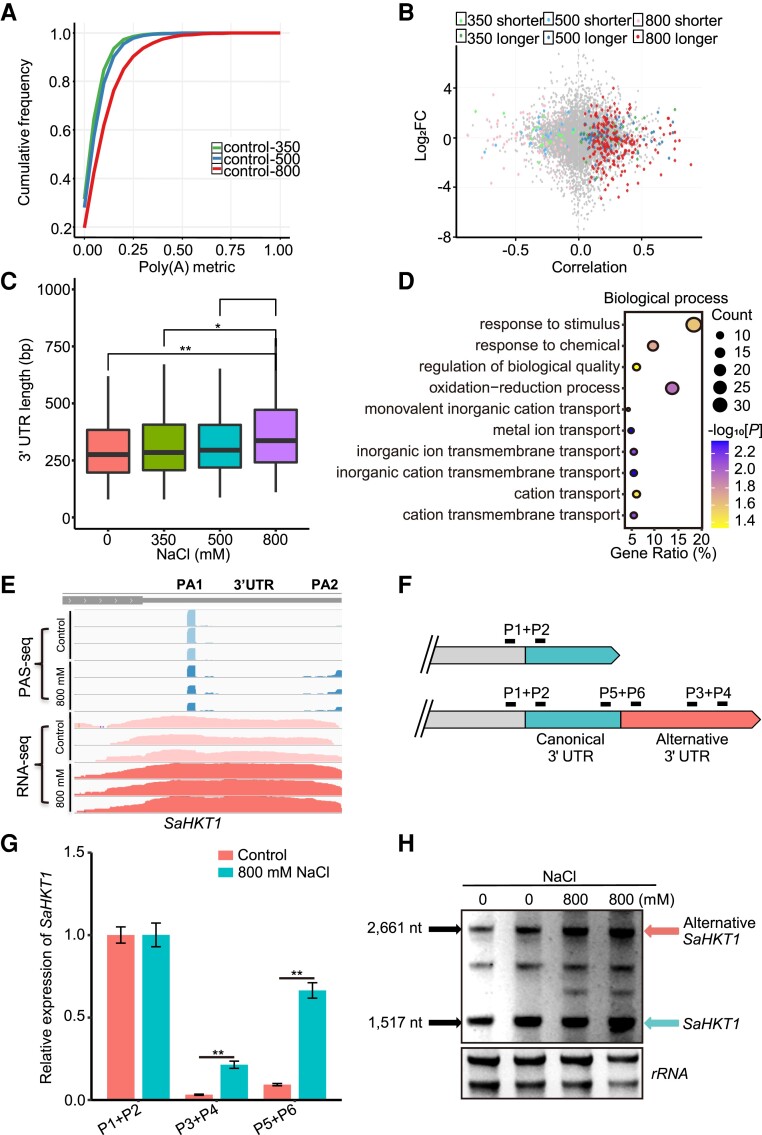
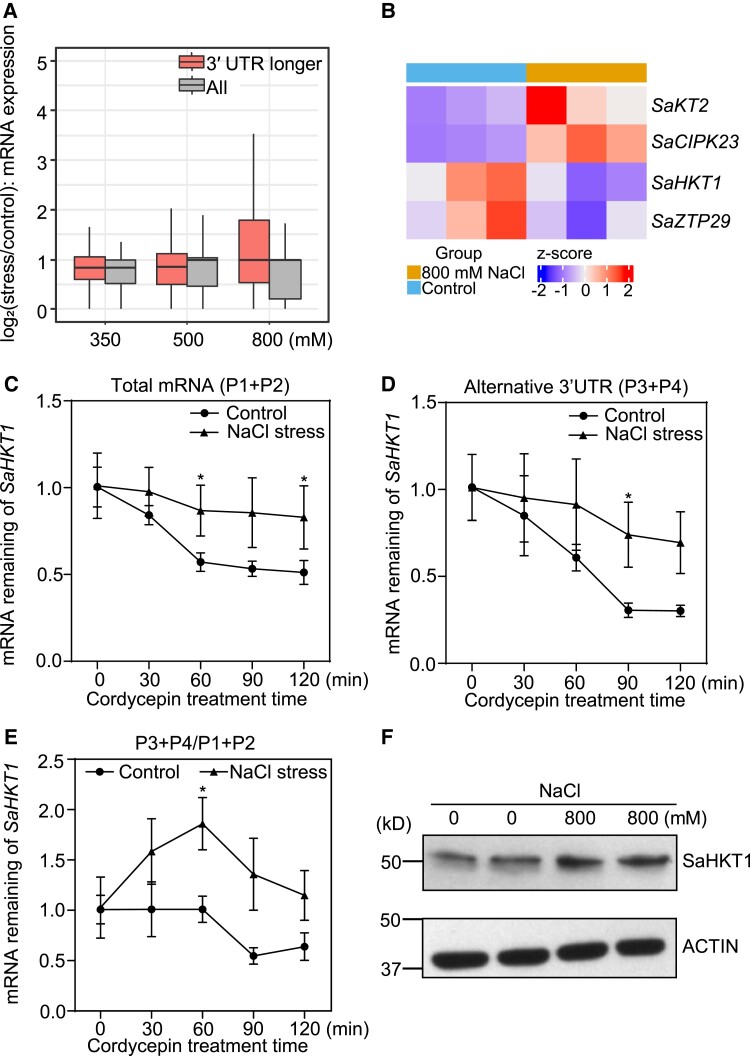
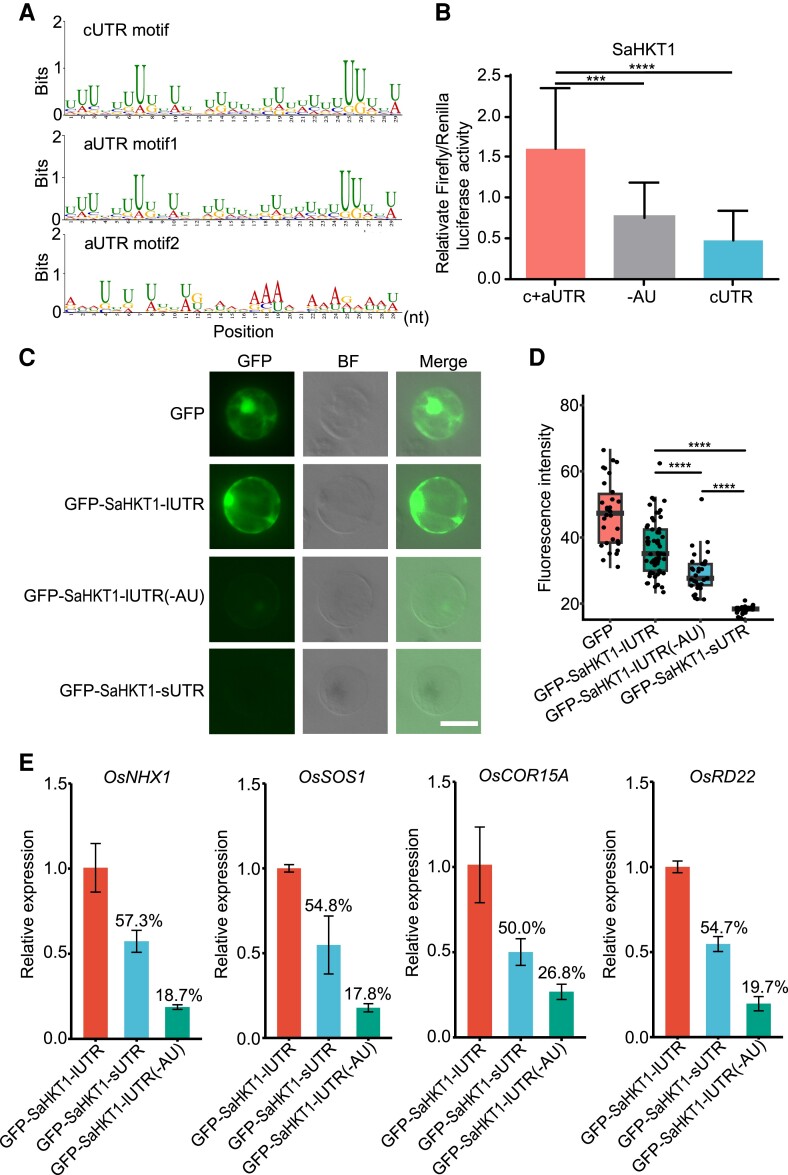
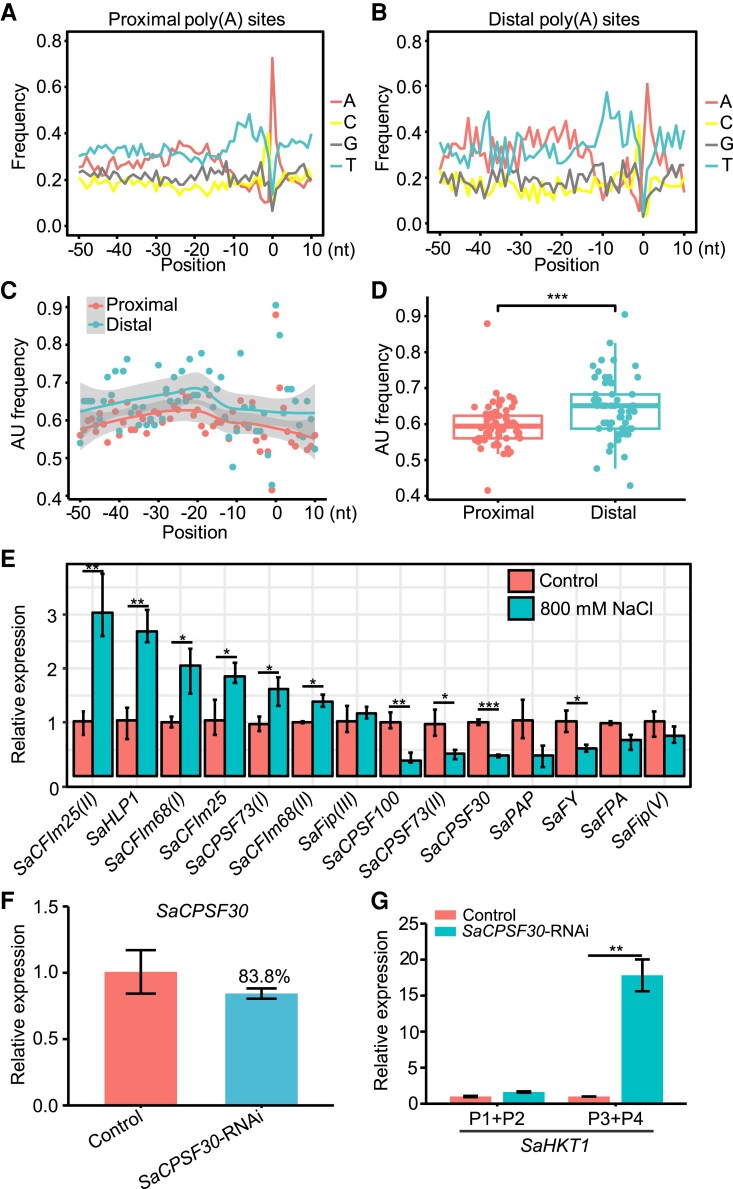
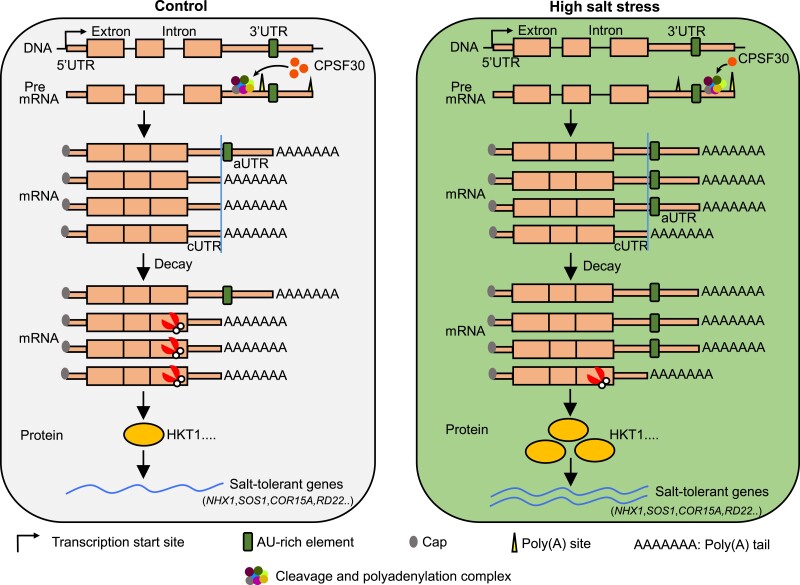
High-salt stress continues to challenge the growth and survival of many plants. Alternative polyadenylation (APA) produces mRNAs with different 3'-untranslated regions (3' UTRs) to regulate gene expression at the post-transcriptional level. However, the roles of alternative 3' UTRs in response to salt stress remain elusive. Here, we report the function of alternative 3' UTRs in response to high-salt stress in S. alterniflora (Spartina alterniflora), a monocotyledonous halophyte tolerant of high-salt environments. We found that high-salt stress induced global APA dynamics, and ∼42% of APA genes responded to salt stress. High-salt stress led to 3' UTR lengthening of 207 transcripts through increasing the usage of distal poly(A) sites. Transcripts with alternative 3' UTRs were mainly enriched in salt stress-related ion transporters. Alternative 3' UTRs of HIGH-AFFINITY K+ TRANSPORTER 1 (SaHKT1) increased RNA stability and protein synthesis in vivo. Regulatory AU-rich elements were identified in alternative 3' UTRs, boosting the protein level of SaHKT1. RNAi-knock-down experiments revealed that the biogenesis of 3' UTR lengthening in SaHKT1 was controlled by the poly(A) factor CLEAVAGE AND POLYADENYLATION SPECIFICITY FACTOR 30 (SaCPSF30). Over-expression of SaHKT1 with an alternative 3' UTR in rice (Oryza sativa) protoplasts increased mRNA accumulation of salt-tolerance genes in an AU-rich element-dependent manner. These results suggest that mRNA 3' UTR lengthening is a potential mechanism in response to high-salt stress. These results also reveal complex regulatory roles of alternative 3' UTRs coupling APA and regulatory elements at the post-transcriptional level in plants.


Conflict of interest statement

Conflict of interest statement. None declared.

Figures

Figure 1
Figure 1
Overview of the experimental and bioinformatics workflow. Major procedures in this study include: (1) salt stress treatment; (2) PAT-seq libraries construction; (3) bioinformatics analysis; (4) experimental approaches such as experimental validation, RNA stability assay, western blot, and poly(A) tag sequencing (PAT-seq). 3′ RACE: Rapid Amplification of cDNA 3′ ends; UTR: untranslated region; PACs: poly(A) site clusters.
Figure 2
Figure 2
Characterization of poly(A) signals. A, Single-nucleotide profile of sequences surrounding poly(A) sites. Y axis denotes the fractional nucleotide content at each position. On the x axis, “0” denotes the poly(A) site, and “−” denotes the upstream region; the numbers represent the nucleotide distance between the poly(A) site and motifs analyzed. nt: nucleotide. B, Distribution of canonical AAUAAA and its 1-nt variants in near upstream regions of poly(A) sites among different plants.
Figure 3
Figure 3
Differentially expressed APA in response to high-salt stress. A, Number of differentially expressed PACs (DE-PACs) under different salt stress treatments (n = 3 independent biological replicates for each sample). B, Number of differentially expressed APA (DE-APA) genes under salinity gradients (n = 3 independent biological replicates for each sample). The PAC expression level was estimated from the PAT-seq data. C, The effect of DE-APA on the RNA accumulation level (n = 3 independent biological replicates for each sample). The RNA accumulation value of each sample is calculated as the log2 (fold change) of gene expression between the treated sample and the control. The RNA accumulation level was estimated from the RNA-seq data. The limits of the box represent the 75th, 50th, and 25th percentiles. D, GO analysis of DE-APA unigenes associated with high-salt stress (P < 0.05). E, Salt-related DE-APA were validated by 3′ RACE. F, The gray value ratio of proximal to distal poly(A) sites in 3′ RACE agarose gel of D was calculated by Image J. SaHKT1: HIGH-AFFINITY K+ TRANSPORTER 1; SaCIPK12: CBL-INTERACTING PROTEIN KINASE 12; SaMYB109: MYB TRANSCRIPTION FACTOR 109; distal: distal poly(A) sites; proximal: proximal poly(A) sites.
Figure 4
Figure 4
3′ UTR lengthening induced by high-salt stress. A, Plot of the running sum of genes with increasing differences in the poly(A) site usage between conditions (Wilcoxon test, P = 8.3e−21 for control-350 mM vs. control-500, P = 1.7e−233 control-350 mM vs. control-800 mM, and P = 9.8e−130 for control-500 mM vs. control-800 mM, respectively). B, Statistical significant 3′ UTR lengthening and shortening events between each salt treatment and the control. Pearson product–moment correlation coefficient is plotted against the log2 (fold change) between conditions. Genes with statistical significant switching to longer or shorter 3′ UTRs are colored (linear trend test, adjusted P < 0.05). C, Distribution of 3′ UTR lengths for unigenes with significant lengthening in 800 mM NaCl treatment across different conditions; “*” represents a significant weighted 3′ UTR length difference (P < 0.05); “**” represents a significant weighted 3′ UTR length difference (P < 0.01). The limits of the box represent the 75th, 50th, and 25th percentiles. D, GO analysis of unigenes with 3′ UTR lengthening under high-salt stress (800 mM NaCl). E, Visualization of RNA-seq read coverages in alternative 3′ UTR of SaHKT1 transcripts under high-salt stress. F, Schematic showing the experimental strategy to validate 3′ UTR lengthening with three pairs of primers: the P1 + P2 primer pair detects the expression of both cUTRs and aUTRs; the P3 + P4 pair detects the expression of aUTRs only; the P5 + P6 pairs detects the expression of flanking 3′ UTR. G, 3′ UTR lengthening under high-salt stress was validated by RT-qPCR with P3 + P4 and P5 + P6 primers (n = 3 independent biological replicates for control and high-salt stress-treated samples); “**” represents significant expression difference (Student's t test, P < 0.01). Bar graphs represent mean gene expression and error bars represent the standard deviation. H, Northern-blot assay detecting the mRNA level of SaHKT1 transcripts under high-salt stress in two technical replicates. SaHKT1 represents SaHKT1 transcripts with both aUTR and cUTR; alternative SaHKT1 represents SaHKT1 transcripts with only aUTR; cUTRs: canonical 3′ UTRs; aUTRs: alternative 3′ UTRs; SaHKT1: HIGH-AFFINITY K+ TRANSPORTER 1.
Figure 5
Figure 5
The effect of 3′ UTR lengthening. A, Variation in the expression of genes with longer or shorter 3′ UTR. The expression value of each sample is calculated as the log2 (fold change) of gene expression value between the treated sample and the control. The RNA accumulation level was estimated from the RNA-seq data. “All” denotes expression levels of all expressed genes without change of 3′ UTR in the respective sample. The x axis represents different salinity conditions: 300: 300 mM NaCl-treated seedlings, etc. The limits of the box represent the 75th, 50th, and 25th percentiles. B, Heatmap showed the relative expression of SaKT2, SaCIPK23, SaHKT1, and SaZTP29 under high-salt stress. C–E, The effect of high-salt stress on RNA stability of remaining total transcripts (cUTR + aUTR) (C), 3′ UTR transcripts (aUTR) (D), and remaining transcripts ratio (P3 + P4/P1 + P2) of SaHKT1 (E) (n = 3 independent biological replicates for each time point); “*” represents significant RNA level difference (Student's t test, P < 0.05). Error bars represent the standard deviation. F, Western blot detecting the protein level of SaHKT1 under both control and high-salt stress in two technical replicates, SaACTIN (Cluster 4283) was used as the loading control; the gray value was calculated with Gel-Pro Analyzer 4.
Figure 6
Figure 6
The function of alternative 3′ UTRs and AU-rich elements. A, Motif analysis of canonical 3′ UTRs and alternative 3′ UTRs with MEME. B, Dual-luciferase assay of short (canonical, cUTR) 3′ UTRs, long (canonical + alternative, cUTR + aUTR) 3′ UTRs, and 3′ UTRs with deleted AU-rich elements (-AU) of SaHKT1 in S. alterniflora protoplast using PEG-calcium-dependent transient expression assay (n = 3 independent protoplast transient transformation experiments). The ratio of Firefly/Renilla represents the effects of 3′ UTR length on protein expression. “***” represents significant luciferase activity difference (Student's t test, P < 0.001); “****” represents significant luciferase activity difference (Student's t test, P < 0.0001). Bar graphs represent the mean value of the ratio and error bars represent the standard deviation. C, The protein was expressed by transforming 35S::GFP, 35S::GFP-HKT1-lUTR, 35S::GFP-HKT1-sUTR, and 35S::GFP-HKT1-lUTR(-AU) into Oryza sativa L. cv. Nipponbare protoplast, scale bar represents 20 µm. D, Fluorescence intensity statistics of the protein expression in cells of C. “****” represents a significant expression difference (Student's t test, P < 0.0001); the number of cells calculated was >30 in each of the conditions using Image J (Jensen, 2013). The limits of the box represent the 75th, 50th, and 25th percentiles. Error bars represent the standard deviation. E, Relative expression of OsNHX1, OsSOS1, OsCOR15A, and OsRD22 in 35S::GFP-HKT1-lUTR, 35S::GFP-HKT1-sUTR and 35S::GFP-HKT1-lUTR(-AU) transformed Oryza sativa protoplasts (n = 3 independent protoplast transient transformation experiments). Bar graphs represent mean gene expression and error bars represent the standard deviation. lUTR: long 3′ UTR with alternative 3′ UTR region; sUTR: short 3′ UTR without alternative 3′ UTR region; lUTR(-AU): long 3′ UTR without AU-rich element, 3′ UTR with AU-rich element depleted alternative 3′ UTR region. OsNHX1: NA+/H+ EXCHANGER 1; OsSOS1: SALT OVERLY SENSITIVE 1; OsCOR15A: COLD-REGULATED 15A; OsRD22: RESPONSIVE TO DESICCATION 22; SaHKT1: HIGH-AFFINITY K+ TRANSPORTER 1.
Figure 7
Figure 7
The biogenesis of 3′ UTR lengthening. A, Nucleotide compositions of sequences surrounding proximal poly(A) sites of transcripts with 3′ UTR lengthening. Y axis denotes the fractional nucleotide content at each position. On the x axis, “0” denotes the poly(A) site. B, As in A but for distal poly(A) sites. C, The distribution of AU frequency surrounding the proximal and distal poly(A) sites of the 3′ UTR lengthening transcripts using local polynomial regression fitting. The gray bands represent 95% confidence intervals. D, The distribution of AU frequency surrounding the proximal and distal poly(A) sites of the 3′ UTR lengthening transcripts, “***” represents a significant AU frequency difference (Wilcoxon rank sum test, P < 0.001). The limits of the box represent the 75th, 50th, and 25th percentiles. E, The relative expression of S. alterniflora poly(A) factors detected by RT-qPCR (n = 3 independent biological replicates). “*” represents P < 0.05, “**” represent P < 0.01, and “***” represents P < 0.001 using Student's t test. F, Relative expression of SaCPSF30 in control and SaCPSF30-RNAi transformed S. alterniflora protoplast (n = 3 independent protoplast transient transformation experiments). G, 3′ UTR lengthening of SaHKT1 in SaCPSF30-RNAi S. alterniflora protoplast was validated by RT-qPCR with P3 + P4 primers (n = 3 independent protoplast transient transformation experiments). E–G, Bar graphs represent mean gene expression and error bars represent the standard deviation. The significance was calculated by Student's t test in (E–G). “*” represents a significant expression difference (P < 0.05), “**” represents a significant expression difference (P < 0.01), and “***” represents a significant expression difference (P < 0.001). SaHKT1: HIGH-AFFINITY K+ TRANSPORTER 1; SaCPSF30: CLEAVAGE AND POLYADENYLATION SPECIFICITY FACTOR 30.
Figure 8
Figure 8
Model of alternative 3′ UTR mediated salt-tolerance mechanism under high-salt stress in S. alterniflora. In normal conditions, the CPSF30 protein expression is higher and increases the binding and cleavage efficiency of salt-tolerance genes by cleavage and polyadenylation complex in proximal poly(A) sites. As a result, the majority of transcripts produced are short transcripts without AU-rich elements, which are vulnerable to RNA decay pathways. Thus, the decrease of HKT1 leads to the reduction of HKT1 protein and ultimately down-regulates the gene expression of other salt-tolerance genes such as NHX1, SOS1, COR15A, and RD22. Under high-salt stress, the expression of CPSF30 decreases, which reduces the efficiency of cleavage and polyadenylation complex binding to the proximal poly(A) sites. As a result, more mRNAs with long 3′ UTRs are produced. The mRNA with AU-rich element will be translated to proteins and ultimately increase the expression of salt-tolerance genes. HKT1: HIGH-AFFINITY K+ TRANSPORTER 1; CPSF30: CLEAVAGE AND POLYADENYLATION SPECIFICITY FACTOR 30; NHX1: NA+/H+ EXCHANGER 1; SOS1: SALT OVERLY SENSITIVE 1; COR15A: COLD-REGULATED 15A; RD22: RESPONSIVE TO DESICCATION 22; UTR: untranslated region; aUTR: alternative 3′UTR; cUTR: canonical 3′UTR.

Similar articles

Cited by

References

    1. Ali A, Khan IU, Jan M, Khan HA, Hussain S, Nisar M, Chung WS, Yun D-J (2018) The high-affinity potassium transporter EpHKT1; 2 from the extremophile Eutrema parvula mediates salt tolerance. Front Plant Sci 9: 1108. - PMC - PubMed
    1. Anders S, Reyes A, Huber W (2012) Detecting differential usage of exons from RNA-seq data. Genome Res 22(10): 2008–2017 - PMC - PubMed
    1. Bedre R, Mangu VR, Srivastava S, Sanchez LE, Baisakh N (2016) Transcriptome analysis of smooth cordgrass (Spartina alterniflora Loisel), a monocot halophyte, reveals candidate genes involved in its adaptation to salinity. BMC Genom 17(1): 657 - PMC - PubMed
    1. Chen C-Y, Gherzi R, Ong S-E, Chan EL, Raijmakers R, Pruijn GJ, Stoecklin G, Moroni C, Mann M, Karin M (2001) AU binding proteins recruit the exosome to degrade ARE-containing mRNAs. Cell 107(4): 451–464 - PubMed
    1. Chen M, Lyu G, Han M, Nie H, Shen T, Chen W, Niu Y, Song Y, Li X, Li H, (2018) 3′ UTR lengthening as a novel mechanism in regulating cellular senescence. Genome Res 28(3): 285–294 - PMC - PubMed

Publication types

MeSH terms

LinkOut - more resources