. 2023 Jan 23;13(1):20.
doi: 10.1038/s41398-023-02318-4.

Whole-brain tracking of cocaine and sugar rewards processing

Affiliations

Whole-brain tracking of cocaine and sugar rewards processing

Łukasz Bijoch et al. Transl Psychiatry. .

Abstract

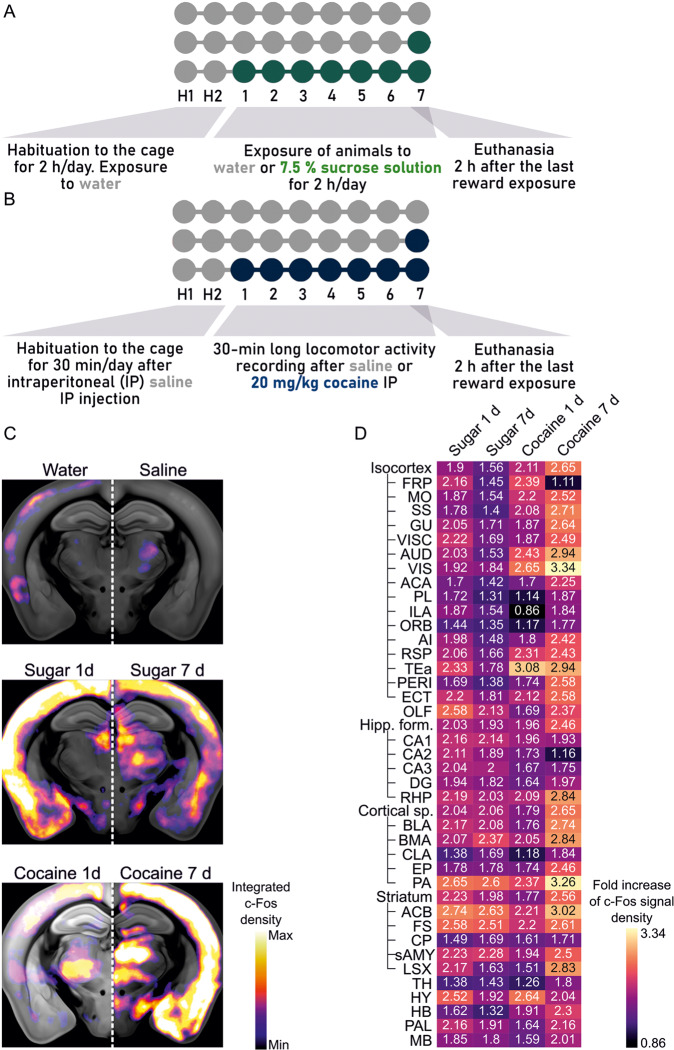
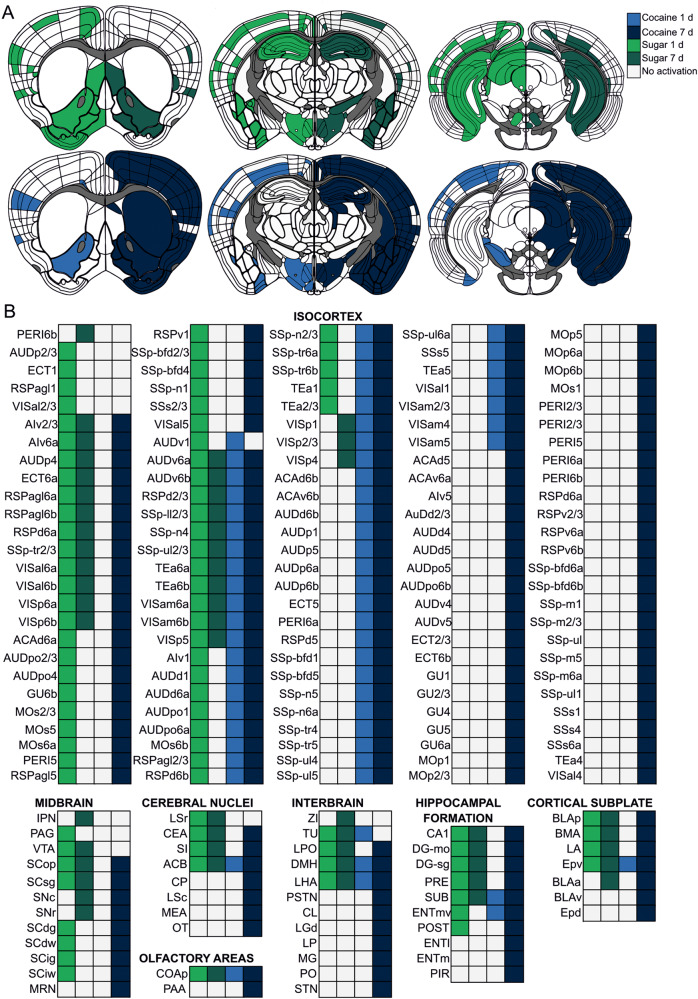
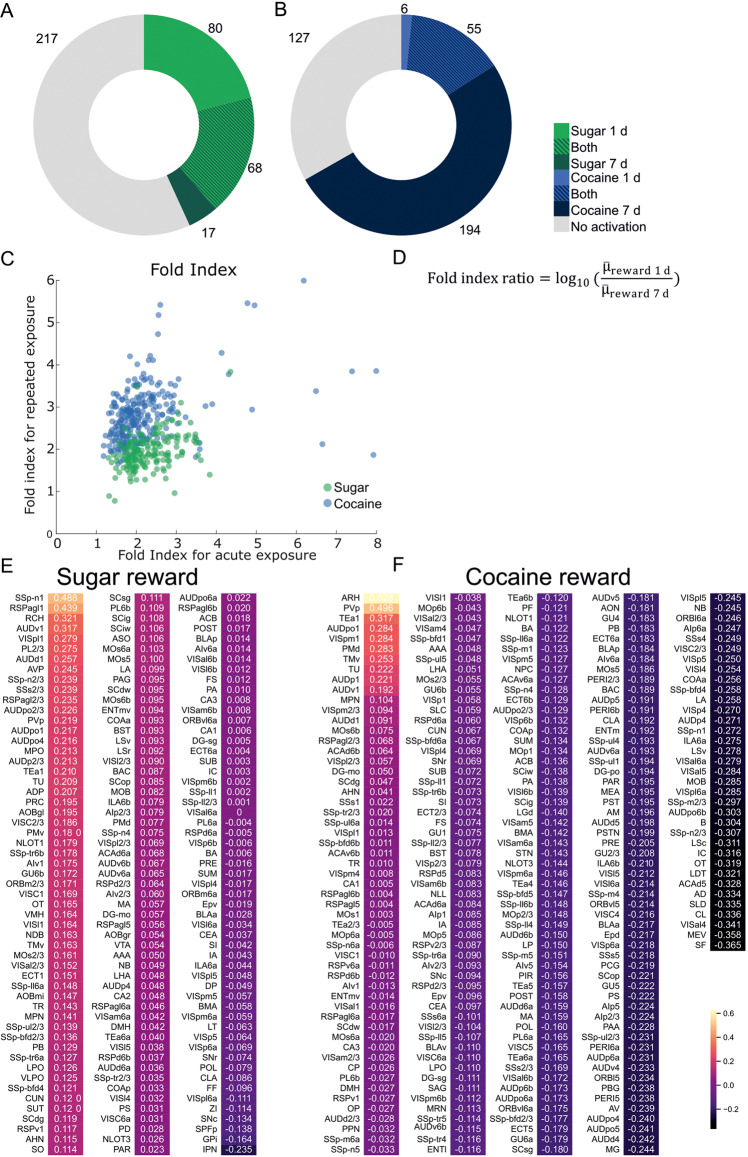
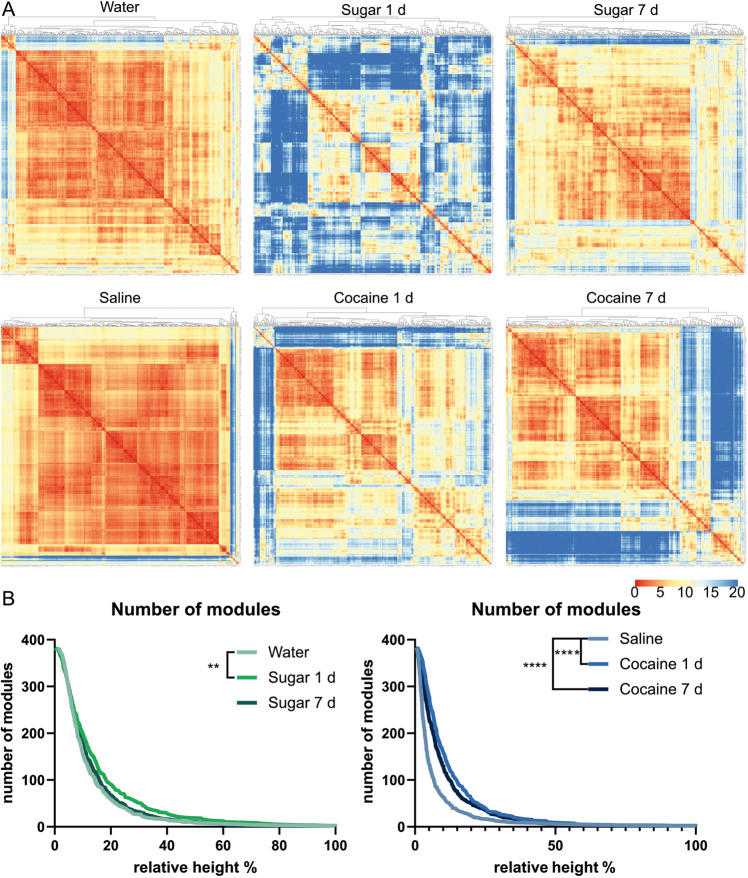
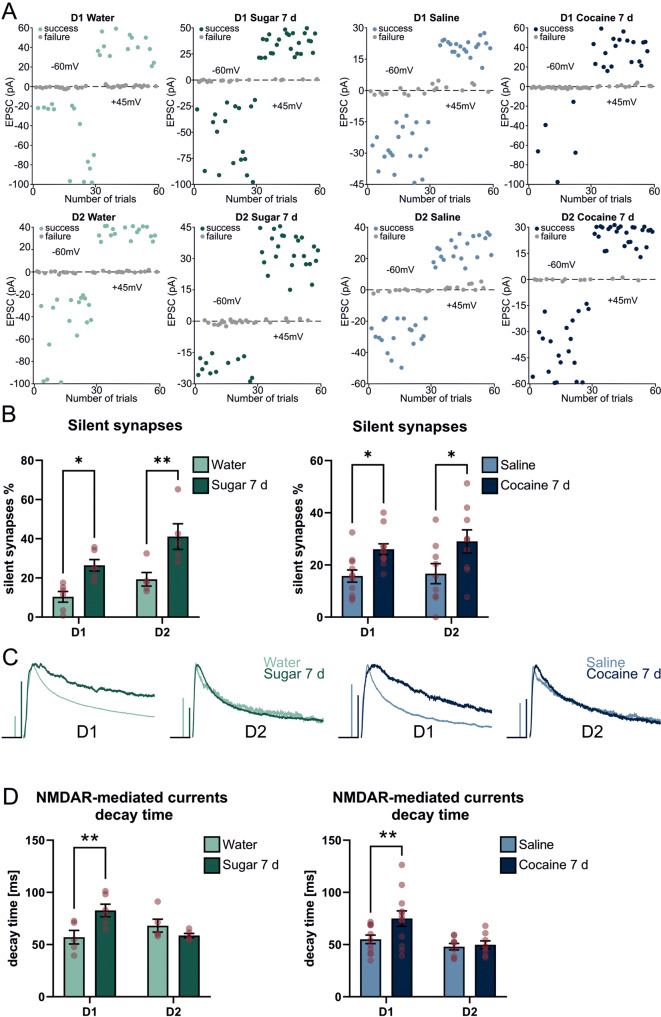
Natural rewards, such as food, and sex are appetitive stimuli available for animals in their natural environment. Similarly, addictive rewards such as drugs of abuse possess strong, positive valence, but their action relies on their pharmacological properties. Nevertheless, it is believed that both of these kinds of rewards activate similar brain circuitry. The present study aimed to discover which parts of the brain process the experience of natural and addictive rewards. To holistically address this question, we used a single-cell whole-brain imaging approach to find patterns of activation for acute and prolonged sucrose and cocaine exposure. We analyzed almost 400 brain structures and created a brain-wide map of specific, c-Fos-positive neurons engaged by these rewards. Acute but not prolonged sucrose exposure triggered a massive c-Fos expression throughout the brain. Cocaine exposure on the other hand potentiated c-Fos expression with prolonged use, engaging more structures than sucrose treatment. The functional connectivity analysis unraveled an increase in brain modularity after the initial exposure to both types of rewards. This modularity was increased after repeated cocaine, but not sucrose, intake. To check whether discrepancies between the processing of both types of rewards can be found on a cellular level, we further studied the nucleus accumbens, one of the most strongly activated brain structures by both sucrose and cocaine experience. We found a high overlap between natural and addictive rewards on the level of c-Fos expression. Electrophysiological measurements of cellular correlates of synaptic plasticity revealed that natural and addictive rewards alike induce the accumulation of silent synapses. These results strengthen the hypothesis that in the nucleus accumbens drugs of abuse cause maladaptive neuronal plasticity in the circuitry that typically processes natural rewards.


Conflict of interest statement

The authors declare no competing interests.

Figures

Fig. 1
Fig. 1. Design of the behavioral procedure and c-Fos mapping in the brain.
A, B Behavioral paradigm for sucrose (A) and cocaine exposure (B). C Heatmaps of the c-Fos density averaged from mice exposed to natural and addictive rewards. The warmer color, the more robust c-Fos expression in the brain region. D Fold increase of the c-Fos signal density, where the reward-treated groups are normalized to controls (either water- or saline-treated groups). Frontal pole (FRP), somatomotor areas (MO), somatosensory areas (SS), gustatory areas (GU), visceral area (VISC), auditory areas (AUD), visual areas (VIS), anterior cingulate area (ACA), prelimbic area (PL), infralimbic area (ILA), orbital area (ORB), agranular insular area (AI), retrosplenial area (RSP), temporal association area (Tea), perirhinal area (PERI), ectorhinal area (ECT), olfactory areas (OLF), hippocampal formation (Hipp f.), hippocampal CA1 (CA1), hippocampal CA2 (CA2), hippocampal CA3 (CA3), dentate gyrus (DG), retrohippocampal region (RHP), cortical subplate (Cortical sp.), basolateral amygdala (BLA), basomedial amygdalar nucleus (BMA), claustrum (CLA), endopiriform nucleus (EP), posterior amygdalar nucleus (PA), nucleus accumbens (ACB), fundus of striatum (FS), caudoputamen (CP), striatum-like amygdalar nuclei (sAMY), lateral septal complex (LSX), thalamus (TH), hypothalamus (HY), hindbrain (HB), pallidum (PAL), midbrain (MB).
Fig. 2
Fig. 2. c-Fos expression mapped in the reward system of the brain.
A Brain schemes based on Allen Brain Atlas with colored structures with significantly elevated c-Fos levels. B List of brain structures from schemes in A with significantly elevated c-Fos levels. N Water = 7, N Sugar 1 d = 5, N Sugar 7 d = 7, N Saline = 7, N Cocaine 1 d = 6, N Cocaine 7 d = 6.
Fig. 3
Fig. 3. c-Fos expression in the brain after acute and prolonged exposure to reward.
A, B Number of structures with elevated c-Fos level after natural (A) or pharmacological reward (B) treatment. C Graph shows fold indices for structures after either acute or prolonged exposure to either natural (green) or pharmacological (blue) reward exposure. D Fold index ratio equation used to compare effects of acute and prolonged reward exposure. E, F Individual fold indexes ratios for natural (E) and pharmacological (F) rewards. Fold index ratios were calculated for structures, which compared to control groups had a p-value < 0.1 either for 1 day or 7 days of reward treatment. For each structure p-value was calculated. First, a generalized linear model (GLM) was calculated. For each GLM a Dunnett’s test was performed. Finally, due to a large number of structures a Benjamin-Hochberg false discovery rate correction was performed on p-values with a 0.1 cut-off. N Water = 7, N Sugar 1 d = 5, N Sugar 7 d = 7, N Saline = 7, N Cocaine 1 d = 6, N Cocaine 7 d = 6.
Fig. 4
Fig. 4. Global pattern of the reorganization of the brain activity after sugar or cocaine exposure.
A Hierarchical organization of sub-networks of brains of mice exposed to natural and pharmacological rewards. The Euclidean distance between brain structures was calculated to find modules of similar brain structures. Graphs showing sub networks among brain structures created based on the distance between brain regions. Warmer colors indicate a shorter Euclidean distance, indicating that two structures have similar c -Fos signal density correlation patterns with other structures. On the top of each graph are dendrograms created based on Euclidean distances between structures (indicating the similarity of co-activation between structures). B Number of modules per group based on cutting the dendrograms at different percentages of tree heights (indicating different similarities between co-activated structures). Statistical difference was calculated with the Mantel-Cox test; Saline vs. Cocaine 1 d and Saline vs. Cocaine 7 d ****=p < 0.0001; Water vs. Sugar 1 d **=p = 0.0013; Water vs. Sugar 7 d p = 0.2426.
Fig. 5
Fig. 5. Electrophysiological determination of plastic changes of D1- and D2-positive cells in Nucleus Accumbens.
A Exemplary recordings of AMPAR and NMDAR-mediated EPSCs from D1- (upper) and D2-positive (lower) cells from mice exposed to water (light green), sucrose (dark green), saline (light blue), and cocaine (dark blue). Each dot on the graph represents the amplitude of a single EPSC at resting membrane potential -60 mV (for AMPAR-mediated currents) and +45 mV (for NMDAR-mediated currents). Note almost ~50% success and ~50% failures in control groups at both -60 mV and + 40 mV. This ratio was disrupted in reward-exposed groups and more successes were observed at +45 mV for equal strength of electrical stimulation. B Percentage of silent synapses after natural (green) and pharmacological (blue) treatment. C Exemplary traces of NMDAR-mediated currents recorded from D1- (upper) and D2-positive (lower) cells from mice exposed to water (light green), sucrose (dark green), saline (light blue), and cocaine (dark blue). Horizontal bars are 25 ms. Vertical bars are 100 pA for D1: Water, Sugar 7d, Saline and 25 pA for D1 Cocaine 7d and D2 Water, Sugar 7 d, Saline, Cocaine 7 d. D Decay time of NMDAR-mediated EPSCs after natural (green) and pharmacological (blue) reward treatment. For silent synapses in D1-positive cells N Water = 6(16); N Sugar 7 d = 6(24); N Saline = 11(28), N Cocaine 7 d = 11(30) and for D2-positive cells N Water = 5(21); N Sugar 7 d = 5(26); N Saline = 9(28), N Cocaine 7d = 9(22), where N/n = Number of mice/ number of recorded neurons. For decay time in D1-positive cells N Water = 5(9); N Sugar 7 d = 6(11); N Saline = 11(25), N Cocaine 7 d = 12(21) and for D2-positive cells N Water = 5(20); N Sugar 7 d = 5(26); N Saline = 9(30), N Cocaine 7 d = 8(22), where N = Number of mice(Number of neurons). p-values were determined with the Two-way ANOVA test. *p < 0.05; **p < 0.01. For silent synapses p-value D1 Water vs. D1 Sugar 7 d = 0.0158; D2 Water vs. D2 Sugar 7 d = 0.0033; D1 Saline vs. D1 Cocaine 7 d = 0.0307; D2 Saline vs. D2 Cocaine 7 d = 0.0088. For decay time p-value D1 Water vs. D1 Sugar 7 d = 0.0084; D2 Water vs. D2 Sugar 7 d = 0.4475, D1 Saline vs. D1 Cocaine 7 d = 0.0056, D2 Saline vs. D2 Cocaine 7 d = 0.9701.

Similar articles

Cited by

References

    1. Wood S, Sage JR, Shuman T, Anagnostaras SG. Psychostimulants and cognition: a continuum of behavioral and cognitive activation. Pharm Rev. 2014;66:193–221. - PMC - PubMed
    1. Bisagno V, Gonzalez B, Urbano FJ. Cognitive enhancers versus addictive psychostimulants: the good and bad side of dopamine on prefrontal cortical circuits. Pharm Res. 2016;109:108–18. - PubMed
    1. Luscher C, Malenka RC. Drug-evoked synaptic plasticity in addiction: from molecular changes to circuit remodeling. Neuron. 2011;69:650–63. - PMC - PubMed
    1. Kelley AE, Berridge KC. The neuroscience of natural rewards: relevance to addictive drugs. J Neurosci. 2002;22:3306–11. - PMC - PubMed
    1. Martin C. Contributions and complexities from the use of in vivo animal models to improve understanding of human neuroimaging signals. Front Neurosci. 2014;8:211. - PMC - PubMed

Publication types

LinkOut - more resources