. 2023 Jan 23;23(1):48.
doi: 10.1186/s12870-022-04017-6.

Comparative and expression analyses of AP2/ERF genes reveal copy number expansion and potential functions of ERF genes in Solanaceae

Affiliations

Comparative and expression analyses of AP2/ERF genes reveal copy number expansion and potential functions of ERF genes in Solanaceae

Jin-Wook Choi et al. BMC Plant Biol. .

Abstract

Background: The AP2/ERF gene family is a superfamily of transcription factors that are important in the response of plants to abiotic stress and development. However, comprehensive research of the AP2/ERF genes in the Solanaceae family is lacking.

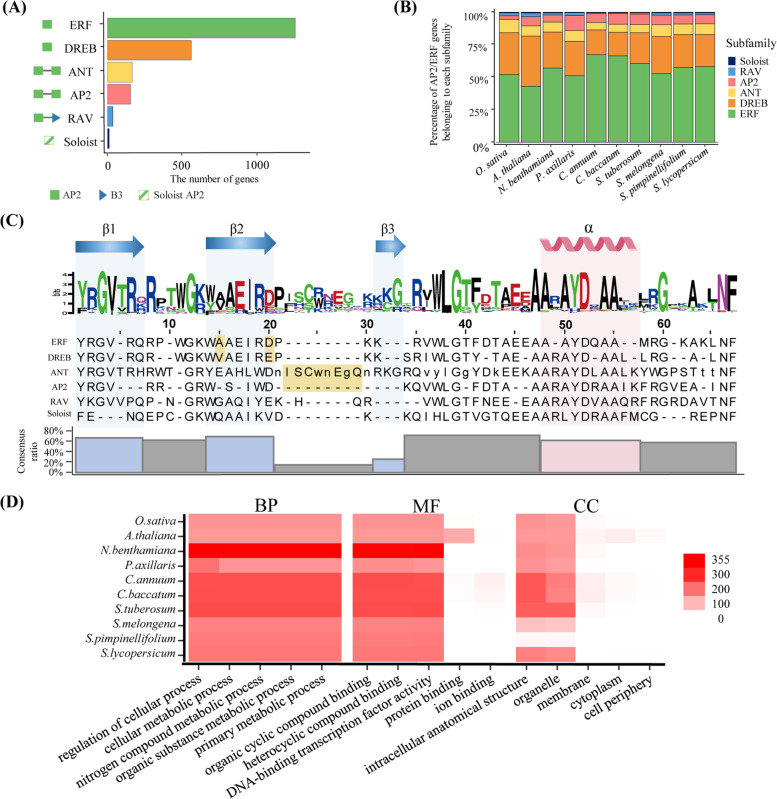
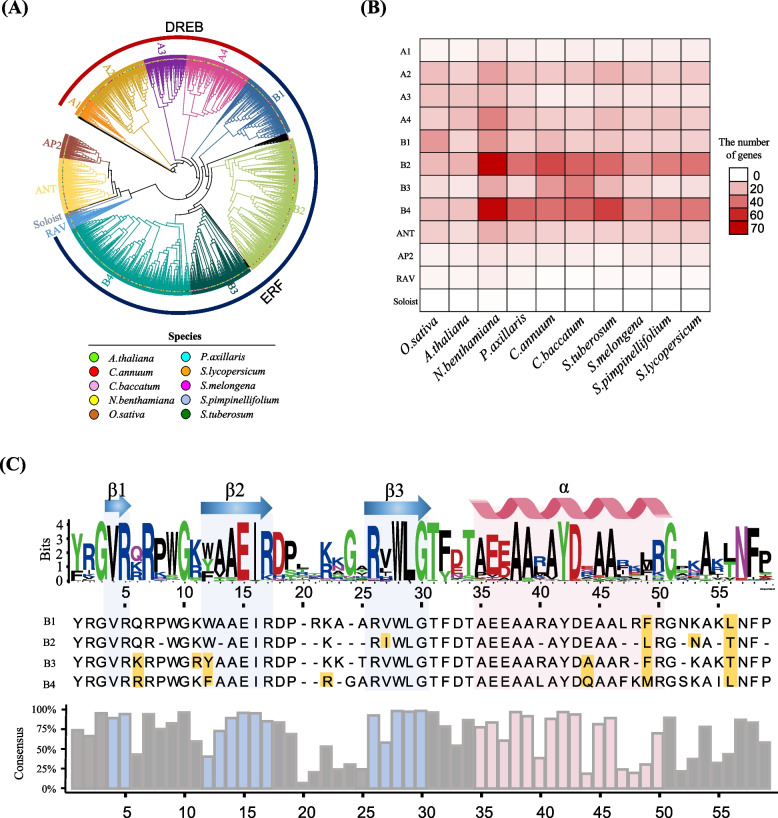
Results: Here, we updated the annotation of AP2/ERF genes in the genomes of eight Solanaceae species, as well as Arabidopsis thaliana and Oryza sativa. We identified 2,195 AP2/ERF genes, of which 368 (17%) were newly identified. Based on phylogenetic analyses, we observed expansion of the copy number of these genes, especially those belonging to specific Ethylene-Responsive Factor (ERF) subgroups of the Solanaceae. From the results of chromosomal location and synteny analyses, we identified that the AP2/ERF genes of the pepper (Capsicum annuum), the tomato (Solanum lycopersicum), and the potato (Solanum tuberosum) belonging to ERF subgroups form a tandem array and most of them are species-specific without orthologs in other species, which has led to differentiation of AP2/ERF gene repertory among Solanaceae. We suggest that these genes mainly emerged through recent gene duplication after the divergence of these species. Transcriptome analyses showed that the genes have a putative function in the response of the pepper and tomato to abiotic stress, especially those in ERF subgroups.

Conclusions: Our findings will provide comprehensive information on AP2/ERF genes and insights into the structural, evolutionary, and functional understanding of the role of these genes in the Solanaceae.

Keywords: AP2/ERF; Abiotic stress; Re-annotation; Solanaceae; Transcription factors; species-specific duplication.


Conflict of interest statement

The authors declare that they have no competing interests.

Figures

Fig. 1
Fig. 1
Characteristics of AP2/ERF genes in Solanaceae. A The number of AP2/ERF genes from six subfamilies in 10 plant genomes. The domain repertoires of six subfamilies are represented by symbols positioned on the left side of the bar graph. The color of each bar indicates the subfamily. B The proportion of genes from subfamilies in the 10 species. The color of each bar indicates the subfamily. C Representation of the amino acid sequence and secondary structures in the AP2 domain from 10 species. The x- and y-axes in the diagram of the amino acid logo indicate the position of amino acids in the AP2 domain and the relative frequency of amino acids at each position, respectively. The location of the secondary structure is depicted on the upper side of the amino acid logo. The alignment of amino acid sequences positioned below the logo shows the most conserved amino acids in each position. For the sequence in uppercase, more than half of the genes contain specific amino acids in that position; if this is not the case, the sequence is lowercase. The specific amino acid residues that are critical in distinguishing the subfamily are highlighted in yellow. The bar graph below the alignment shows the consensus ratio of eight divisions considering the secondary structure of the AP2 domain. The colors of the bar display different divisions: pink bar indicates division in α-helix, blue bars indicate divisions in β-sheets, and grey bars indicate the interval regions. D Heat map of the number of the top five gene ontology (GO) terms of AP2/ERF genes. Three GO categories are listed over the heat map. The number of GO terms is indicated by the color of the boxes next to the heatmap
Fig. 2
Fig. 2
Phylogenetic relationship and subgroup classification of AP2/ERF genes in 10 species. A Phylogenetic tree, in which species are represented by different colors of dots on the end of the branch. The color of each branch and the strap outside of colored dots display different subgroups. The outer ring identifies ERF subgroups (B1-B4) and DREB subgroups (A1-A4). B Heat map showing the number of AP2/ERF genes in subgroups from each species. C The conserved amino acid sequence of AP2 domain in ERF subgroups. The stacked logo depicts multiple amino acids in a specific position. The height of the logo indicates the frequency of amino acids. The letter under the logo indicates the most conserved amino acid in each position. The different conserved residues between ERF subgroups are highlighted in yellow. The position of α-helices and β-sheets are displayed on the upper side of the logos. The calculated consensus ratio of each position is shown as the bar with the color of the secondary structure of the AP2 domain
Fig. 3
Fig. 3
Comparison of the syntenic region and duplication history of the AP2/ERF pepper, tomato, and potato genes. A-B Micro-synteny analysis of AP2/ERF genes in the subgroup B2 A and B3 B on chromosomes 1 and 4. The gene IDs in the syntenic region are represented and the orthologous gene is linked with the line. The genes colored with grey indicate orthologous genes that are not AP2/ERF genes. C Heat map of the number of genes with orthologous relationships. The number of genes having orthologs in three, and two species are displayed on A and B, respectively. The number of genes with no orthologs is represented on the C. D Histogram showing the duplication history of AP2/ERF genes. The color of the bar indicates an ortholog relationship between the three species. E The distribution of duplication history of AP2/ERF. The shapes and colors indicate species and ortholog relationships between the three species, respectively
Fig. 4
Fig. 4
Transcriptome analyses with gene ontology (GO) enrichment test in differentially expressed genes (DEGs) of pepper under abiotic stress. A For each stress, expression patterns of whole DEGs, including AP2/ERFs are represented in four clusters. B Heat map showing the distribution of AP2/ERF genes in each subgroup. C Dot plot showing the top five GO descriptions abundance in specific clusters. The shape and size of the symbols illustrate the type and frequency of the GO description, respectively
Fig. 5
Fig. 5
Expression and putative functions of AP2/ERF genes in tomato exposed to abiotic stress. A Differentially expressed genes under four abiotic stresses are shown as a volcano plot. The color of scattered points represents the expression difference of AP2/ERF genes (grey: whole genes; red: up-regulated AP2/ERF DEGs; blue: down-regulated AP2/ERF DEGs). B Heatmap showing the number of AP2/ERF DEGs in each subgroup. The scale bar on the right side of the heatmap indicates the heatmap value. C Depiction of results of the GO-enrichment test. The top five enriched GO terms in each group are listed under the plot. The different shapes and sizes of symbols indicate different categories and the frequency of GO descriptions (DEGs; differentially expressed genes; GO, gene ontology)

Similar articles

Cited by

References

    1. Verma V, Ravindran P, Kumar PP. Plant hormone-mediated regulation of stress responses. Bmc Plant Biol. 2016;16:86. doi: 10.1186/s12870-016-0771-y. - DOI - PMC - PubMed
    1. Ahanger MA, Akram NA, Ashraf M, Alyemeni MN, Wijaya L, Ahmad P. Plant responses to environmental stresses-from gene to biotechnology. Aob Plants. 2017;9:plx025. doi: 10.1093/aobpla/plx025. - DOI - PMC - PubMed
    1. Schmitz RJ, Grotewold E, Stam M. Cis-regulatory sequences in plants: their importance, discovery, and future challenges. Plant Cell. 2022;34(2):718–741. doi: 10.1093/plcell/koab281. - DOI - PMC - PubMed
    1. Bilas R, Szafran K, Hnatuszko-Konka K, Kononowicz AK. Cis-regulatory elements used to control gene expression in plants. Plant Cell Tiss Org. 2016;127(2):269–287. doi: 10.1007/s11240-016-1057-7. - DOI
    1. Xie ZL, Nolan ROR, Jiang H, Tang BY, Zhang MC, Li ZH, Yin YH. The AP2/ERF Transcription factor TINY modulates brassinosteroid-regulated plant growth and drought responses in Arabidopsis. Plant Cell. 2019;31(8):1788–1806. doi: 10.1105/tpc.18.00918. - DOI - PMC - PubMed