

Single-nucleus RNA sequencing and deep tissue proteomics reveal distinct tumour microenvironment in stage-I and II cervical cancer
- PMID: 36683048
- PMCID: PMC9869594
- DOI: 10.1186/s13046-023-02598-0
Single-nucleus RNA sequencing and deep tissue proteomics reveal distinct tumour microenvironment in stage-I and II cervical cancer
Abstract
Background: Cervical cancer (CC) is the 3rd most common cancer in women and the 4th leading cause of deaths in gynaecological malignancies, yet the exact progression of CC is inconclusive, mainly due to the high complexity of the changing tumour microenvironment (TME) at different stages of tumorigenesis. Importantly, a detailed comparative single-nucleus transcriptomic analysis of tumour microenvironment (TME) of CC patients at different stages is lacking.
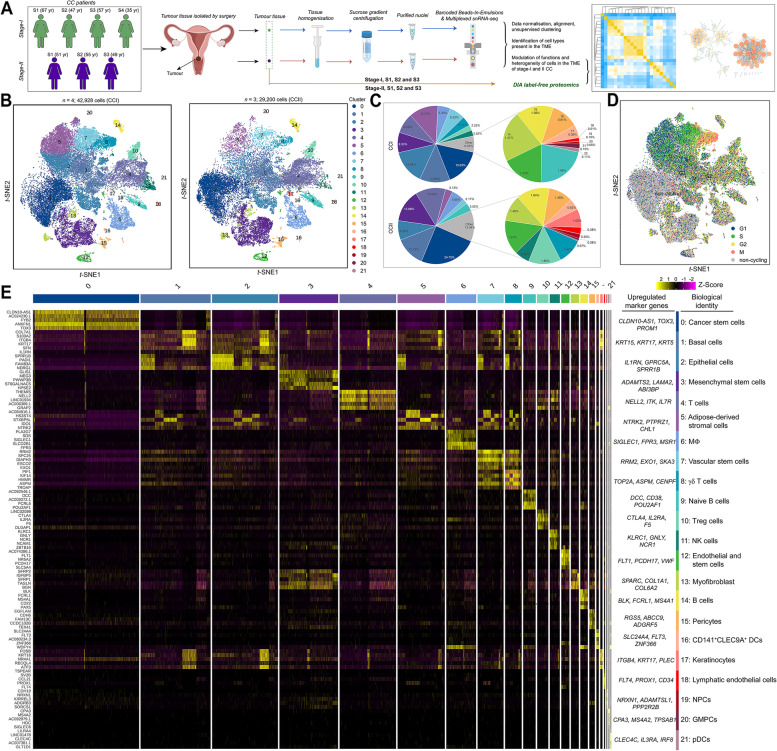
Methods: In this study, a total of 42,928 and 29,200 nuclei isolated from the tumour tissues of stage-I and II CC patients and subjected to single-nucleus RNA sequencing (snRNA-seq) analysis. The cell heterogeneity and functions were comparatively investigated using bioinformatic tools. In addition, label-free quantitative mass spectrometry based proteomic analysis was carried out. The proteome profiles of stage-I and II CC patients were compared, and an integrative analysis with the snRNA-seq was performed.
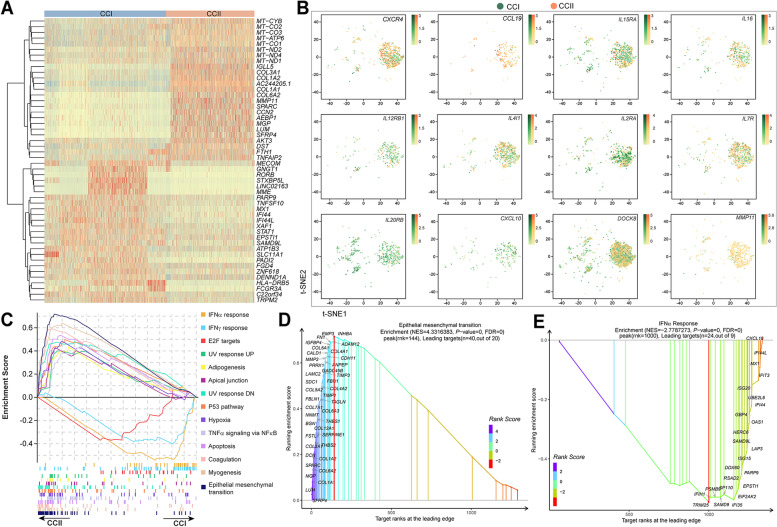
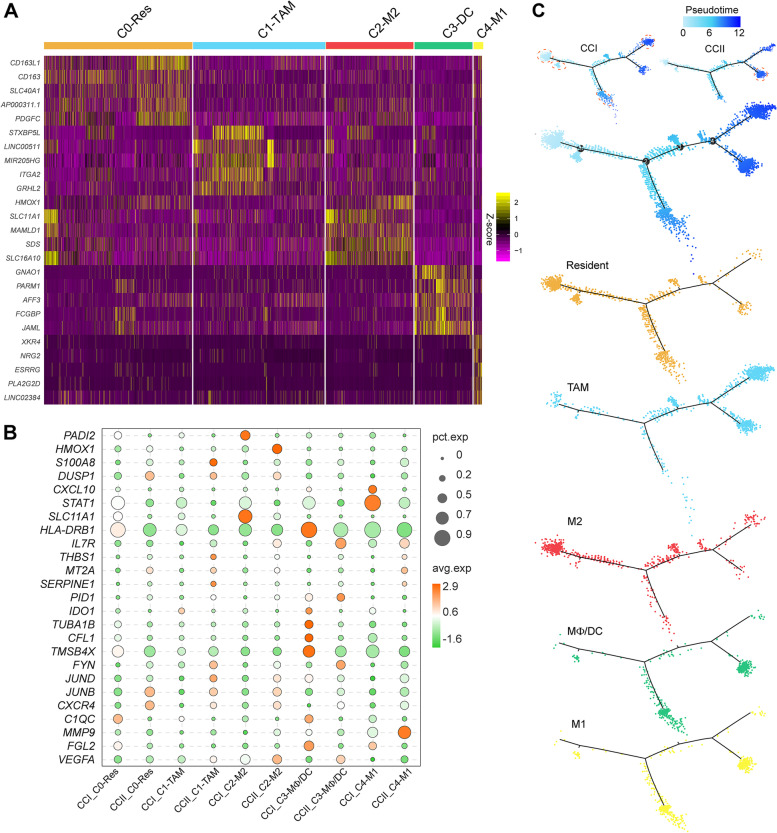
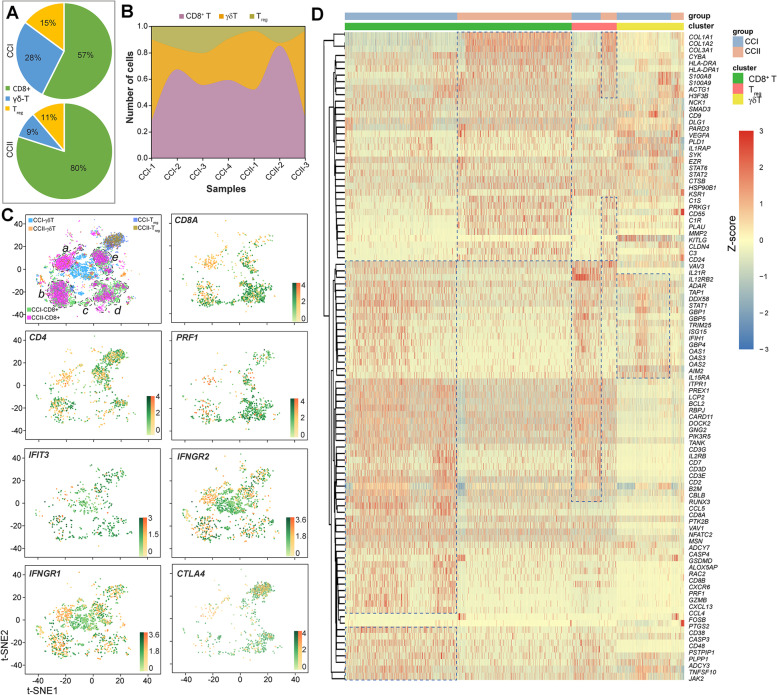
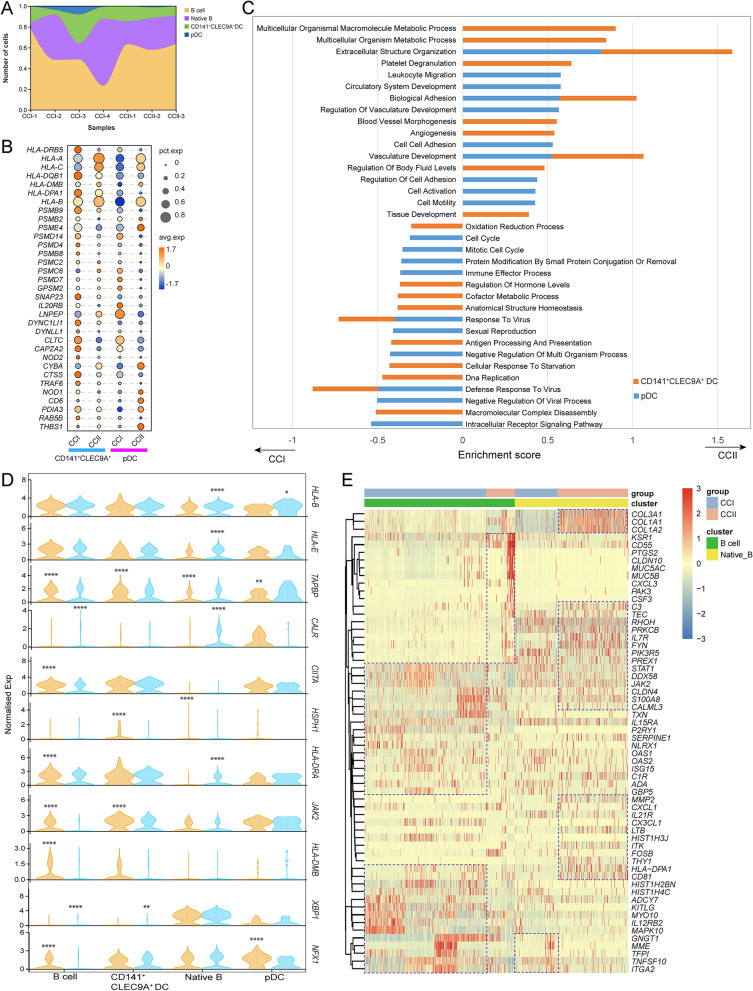
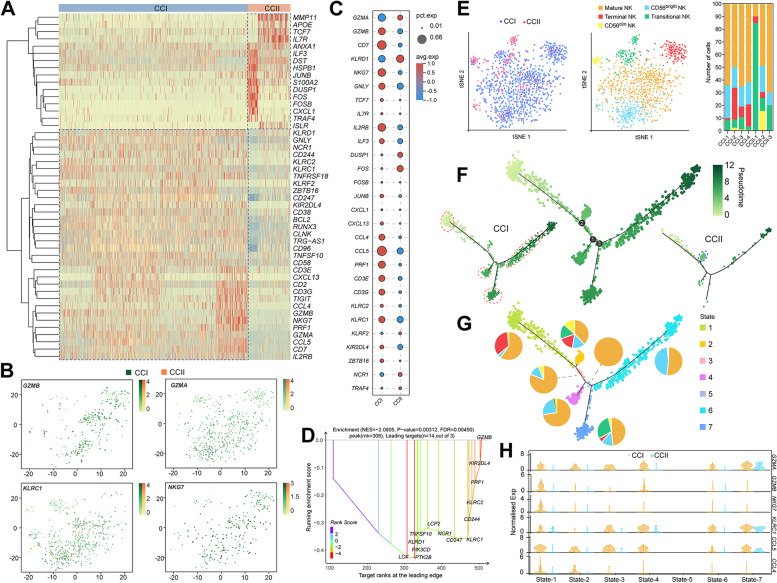
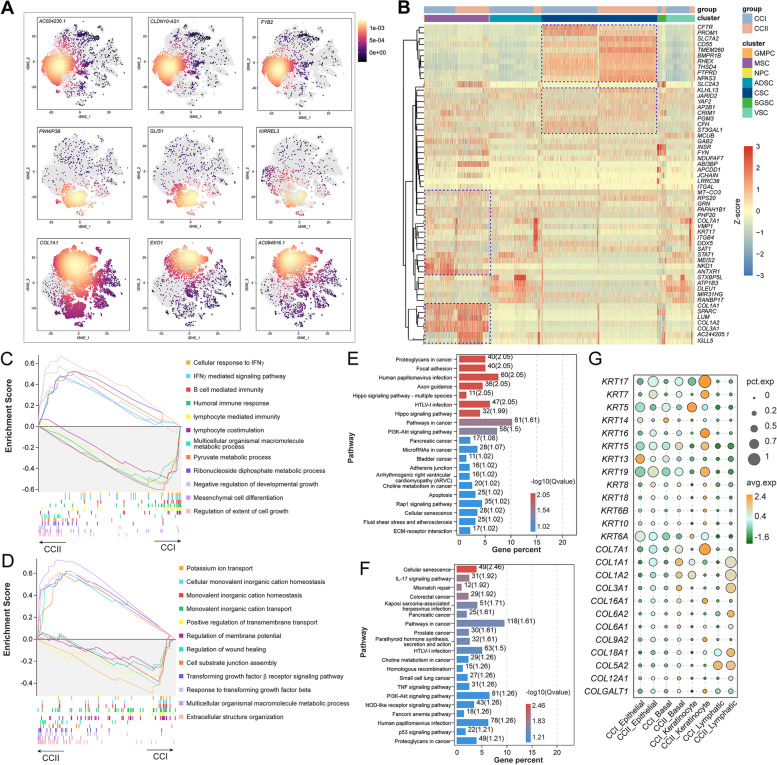
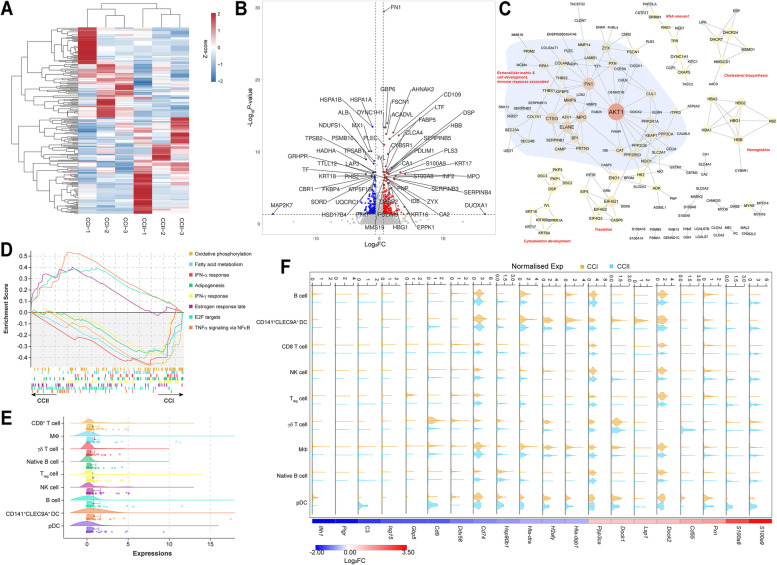
Results: Compared with the stage-I CC (CCI) patients, the immune response relevant signalling pathways were largely suppressed in various immune cells of the stage-II CC (CCII) patients, yet the signalling associated with cell and tissue development was enriched, as well as metabolism for energy production suggested by the upregulation of genes associated with mitochondria. This was consistent with the quantitative proteomic analysis that showed the dominance of proteins promoting cell growth and intercellular matrix development in the TME of CCII group. The interferon-α and γ responses appeared the most activated pathways in many cell populations of the CCI patients. Several collagens, such as COL12A1, COL5A1, COL4A1 and COL4A2, were found significantly upregulated in the CCII group, suggesting their roles in diagnosing CC progression. A novel transcript AC244205.1 was detected as the most upregulated gene in CCII patients, and its possible mechanistic role in CC may be investigated further.
Conclusions: Our study provides important resources for decoding the progression of CC and set the foundation for developing novel approaches for diagnosing CC and tackling the immunosuppressive TME.
Keywords: Cervical cancer; Collagen; Macrophage; Quantitative proteomics; Single-nucleus RNA sequencing; Tumour microenvironment.
© 2023. The Author(s).
Conflict of interest statement
The authors declare no competing interests.
Figures
Similar articles
-
Dissecting the Single-Cell Transcriptome Network of Immune Environment Underlying Cervical Premalignant Lesion, Cervical Cancer and Metastatic Lymph Nodes.Front Immunol. 2022 Jun 24;13:897366. doi: 10.3389/fimmu.2022.897366. eCollection 2022. Front Immunol. 2022. PMID: 35812401 Free PMC article.
-
Decoding the tumor microenvironment and molecular mechanism: unraveling cervical cancer subpopulations and prognostic signatures through scRNA-Seq and bulk RNA-seq analyses.Front Immunol. 2024 Feb 28;15:1351287. doi: 10.3389/fimmu.2024.1351287. eCollection 2024. Front Immunol. 2024. PMID: 38482016 Free PMC article.
-
Single-cell RNA sequencing revealed changes in the tumor microenvironment induced by radiotherapy for cervical cancer and the molecular mechanism of mast cells in immunosuppression.Funct Integr Genomics. 2025 Mar 14;25(1):63. doi: 10.1007/s10142-025-01564-7. Funct Integr Genomics. 2025. PMID: 40082276
-
Progress of single-cell RNA sequencing combined with spatial transcriptomics in tumour microenvironment and treatment of pancreatic cancer.J Transl Med. 2024 Jun 12;22(1):563. doi: 10.1186/s12967-024-05307-3. J Transl Med. 2024. PMID: 38867230 Free PMC article. Review.
-
Understanding Cervical Cancer through Proteomics.Cells. 2021 Jul 22;10(8):1854. doi: 10.3390/cells10081854. Cells. 2021. PMID: 34440623 Free PMC article. Review.
Cited by
-
Unveiling diagnostic and therapeutic strategies for cervical cancer: biomarker discovery through proteomics approaches and exploring the role of cervical cancer stem cells.Front Oncol. 2024 Jan 24;13:1277772. doi: 10.3389/fonc.2023.1277772. eCollection 2023. Front Oncol. 2024. PMID: 38328436 Free PMC article. Review.
-
The tumor microenvironment across four dimensions: assessing space and time in cancer biology.Front Immunol. 2025 Jun 23;16:1554114. doi: 10.3389/fimmu.2025.1554114. eCollection 2025. Front Immunol. 2025. PMID: 40625731 Free PMC article. Review.
-
CCL21 Induces Plasmacytoid Dendritic Cell Migration and Activation in a Mouse Model of Glioblastoma.Cancers (Basel). 2024 Oct 12;16(20):3459. doi: 10.3390/cancers16203459. Cancers (Basel). 2024. PMID: 39456552 Free PMC article.
-
EPB41L4A-AS1 regulates cervical cancer by proliferative cells: mendelian randomization and single-cell transcriptomics analyses.Transl Cancer Res. 2025 Jan 31;14(1):354-370. doi: 10.21037/tcr-24-949. Epub 2025 Jan 23. Transl Cancer Res. 2025. PMID: 39974380 Free PMC article.
-
Single-cell transcriptomics unveils multifaceted immune heterogeneity in early-onset versus late-onset cervical cancer.World J Surg Oncol. 2025 Jan 14;23(1):12. doi: 10.1186/s12957-025-03654-z. World J Surg Oncol. 2025. PMID: 39810181 Free PMC article.
References
-
- Tuyaerts S, Van Nuffel AMT, Naert E, Van Dam PA, Vuylsteke P, De Caluwe A, Aspeslagh S, Dirix P, Lippens L, De Jaeghere E, et al. PRIMMO study protocol: a phase II study combining PD-1 blockade, radiation and immunomodulation to tackle cervical and uterine cancer. BMC Cancer. 2019;19(1):506. doi: 10.1186/s12885-019-5676-3. - DOI - PMC - PubMed
-
- Xie L, Chu R, Wang K, Zhang X, Li J, Zhao Z, Yao S, Wang Z, Dong T, Yang X, et al. Prognostic Assessment of Cervical Cancer Patients by Clinical Staging and Surgical-Pathological Factor: A Support Vector Machine-Based Approach. Front Oncol. 2020;10:1353. doi: 10.3389/fonc.2020.01353. - DOI - PMC - PubMed
-
- Wipperman J, Neil T, Williams T. Cervical Cancer: Evaluation and Management. Am Fam Physician. 2018;97(7):449–454. - PubMed
MeSH terms
Grants and funding
LinkOut - more resources
Full Text Sources
Medical
Molecular Biology Databases
Miscellaneous
