. 2023 Jan;50(1):5-49.
doi: 10.1007/s10396-022-01272-w. Epub 2023 Jan 23.

Manual for abdominal ultrasound in cancer screening and health checkups, revised edition (2021)

Collaborators, Affiliations

Manual for abdominal ultrasound in cancer screening and health checkups, revised edition (2021)

Shinji Okaniwa et al. J Med Ultrason (2001). 2023 Jan.
No abstract available

Keywords: Abdominal ultrasonography; Cancer screening; Category; Heath checkup; Ultrasound finding; Ultrasound screening.


Conflict of interest statement

Members, etc., who created this manual were asked to declare the following conflicts of interest. With respect to companies/organizations from which the member himself or herself, a spouse, a first-degree or closer relative, an individual with whom he or she shares income/assets, or the director of an institution/division to which he or she belongs received some form of compensation: compensation (≥ 1 million yen), profit from stock (≥ 1 million yen, or ≥ 5%), patent royalty (≥ 1 million yen), lecture fee, etc. (≥ 500,000 yen), manuscript fee (≥ 500,000 yen), research expenses/grant (≥ 1 million yen), scholarship donation, etc. (≥ 1 million yen), endowed course provided by corporation, etc. (≥ 1 million yen), and provision of funds not directly related to research (≥ 50,000 yen). Masahiro OGAWA (compensation: GE Healthcare Japan, Canon Medical Systems, Dainippon Sumitomo Pharma), Shinji OKANIWA (compensation: GE Healthcare Japan, Canon Medical Systems), Masaki ADACHI (compensation: Medical Egg), Masayuki KITANO (lecture fee: Olympus, EA Pharma, Kaneka Medix, scholarship donation: AbbVie, Takeda Pharmaceutical), Masahiko NAKATA (scholarship donation: Hitachi Healthcare Business Unit), Takashi NISHIMURA(scholarship donation: Canon Medical Systems GE Healthcare Japan), Hiroshi MATSUO (lecture fee: Daiichi Sankyo).

Figures
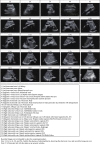
Fig. 1
Fig. 1
Twenty-five recommended sections to record
Fig. 2
Fig. 2
Images by position change
Fig. 3
Fig. 3
Commonly focal spared area in fatty liver. If it is an irregular hypoechoic area in a commonly focal spared area without a disturbed speckle pattern, and no deviation in blood flow is detected on color Doppler, it is not considered a solid lesion (Figs. Liver-6 to 8)
Fig. 4
Fig. 4
Post-local treatment. Left: post-radiofrequency ablation; right: post-hepatic arterial embolization. Category 3, Assessment C  Please align the size of images(8,13-16, 21-26, 28-30, 32-34)
Fig. 5
Fig. 5
Diffuse lesion. Any one of bright liver, liver-kidney (spleen) contrast, deep attenuation, or intrahepatic vascular blurring is present. Left: liver–kidney contrast; right: liver–spleen contrast. Category 2, Assessment C
Fig. 6
Fig. 6
Diffuse lesion. Commonly focal spared area in fatty liver (Around the gallbladder: Cystic vein reflux region). Left: B-mode, Right: Power Doppler. Category 2, Assessment C
Fig. 7
Fig. 7
Diffuse lesion. Commonly focal spared area in fatty liver (Right gastric vein ectopic reflux region). Left: Dorsal S4, Right: Dorsal S2. Category 2, Assessment C
Fig. 8
Fig. 8
Diffuse lesion. Commonly focal spared area in fatty liver (Frontal S4 immediately below the liver surface: Sappey's venous reflux region). Category 2, Assessment C
Fig. 9
Fig. 9
Diffuse lesion. Dull hepatic edge/rough parenchymal echo pattern or nodular rugged liver surface is present (either one) (only dull hepatic margin is noted). Left: right intercostal scan (right hepatic lobe) with convex probe; right: midline vertical scan (left hepatic lobe) with high-frequency probe. Category 3, Assessment C
Fig. 10
Fig. 10
Diffuse lesion. Dull hepatic edge/rough parenchymal echo pattern or nodular rugged liver surface is present (either one). Bamboo blind sign (include in rough echo pattern). Left: right intercostal scan with convex probe; right: right intercostal scan with high-frequency probe. Category 3, Assessment C
Fig. 11
Fig. 11
Diffuse lesion. Dull hepatic edge/rough parenchymal echo pattern and nodular rugged liver surface are present (all) (flag sign). Left: midline vertical scan with convex probe, right: midline vertical scan with high-frequency probe. Category 3, Assessment D2
Fig. 12
Fig. 12
Diffuse lesion. Dull hepatic edge/rough parenchymal echo pattern and nodular rugged liver surface are present (all). Left: right intercostal scan (right hepatic lobe), right: midline vertical scan (left hepatic lobe). Category 3, Assessment D2
Fig. 13
Fig. 13
Diffuse lesion. Dull hepatic edge/rough parenchymal echo pattern and nodular rugged liver surface are present (all) (high-frequency probe). Category 3, Assessment D2
Fig. 14
Fig. 14
Solid lesion. A solid hepatic lesion is present (maximum diameter < 15 mm). Category 3, Assessment C
Fig. 15
Fig. 15
Solid lesion. Solid lesion with involvement of Category 3 diffuse lesion. Category 4, Assessment D2
Fig. 16
Fig. 16
Solid lesion. A solid lesion is present. Maximum diameter ≥ 15 mm. Category 4, Assessment D2
Fig. 17
Fig. 17
Hepatic neoplastic lesion. Marginal strong echo. Left: Convex probe, Right: High-frequency probe. Category 2, Assessment C
Fig. 18
Fig. 18
Hepatic neoplastic lesion. Chameleon sign/wax and wane sign (change in internal echo detected). Category 2, Assessment C
Fig. 19
Fig. 19
Hepatic neoplastic lesion. Disappearing sign. Left: Before compression, Right: After compression. Category 2, Assessment C
Fig. 20
Fig. 20
Hepatic neoplastic lesion. Sludge worm sign. Left: High-frequency probe, Right: Zoom image. Category 2, Assessment C
Fig. 21
Fig. 21
Hepatic neoplastic lesion. Peripheral hypoechoic zone/posterior echo enhancement. Category 4, Assessment D2
Fig. 22
Fig. 22
Hepatic neoplastic lesion. Multiple neoplastic lesions. Category 4, Assessment D2
Fig. 23
Fig. 23
Hepatic neoplastic lesion. Distal bile duct dilatation. Category 4, Assessment D2
Fig. 24
Fig. 24
Hepatic neoplastic lesion. Mosaic pattern. Category 5, Assessment D1
Fig. 25
Fig. 25
Hepatic neoplastic lesion. Bright loop appearance. Category 5, Assessment D1
Fig. 26
Fig. 26
Hepatic neoplastic lesion. Hump sign. Category 5, Assessment D1
Fig. 27
Fig. 27
Hepatic neoplastic lesion. Cluster sign. Left: Convex probe, Right: High-frequency probe. Category 5, Assessment D1
Fig. 28
Fig. 28
Hepatic neoplastic lesion. Bull's eye pattern (target sign). Category 5, Assessment D1
Fig. 29
Fig. 29
Hepatic neoplastic lesion. Intraportal tumor embolism is present. Category 5, Assessment D1
Fig. 30
Fig. 30
Cystic lesion. Solid component (intracystic nodules/wall thickening/septal thickening) is present. Intracystic nodules are present. Category 4, Assessment D2
Fig. 31
Fig. 31
Cystic lesion. Solid component (intracystic nodules/wall thickening/septal thickening) and change in internal fluid (e.g., internal echogenic spots) are present. Left: cyst wall thickening; right: echogenic spots in internal fluid. Category 4, Assessment D2
Fig. 32
Fig. 32
Cystic lesion. Distal bile duct dilatation. Category 3, Assessment D2
Fig. 33
Fig. 33
Other findings. Calcified opacity. Comet-like echo. Category 2, Assessment C
Fig. 34
Fig. 34
Other findings. Pneumobilia. Category 2, Assessment B
Fig. 35
Fig. 35
Other findings. Vascular abnormality (portal-venous shunt). Left: B-mode; right: color Doppler. Category 2, Assessment D2
Fig. 36
Fig. 36
Measurement of bile duct diameter
Fig. 37
Fig. 37
The gallbladder wall is inevaluable (the wall is inevaluable due to being filled with stones). Category 3, Assessment D2
Fig. 38
Fig. 38
The gallbladder wall is inevaluable (the wall is inevaluable due to food intake). Category 3, Assessment D2
Fig. 39
Fig. 39
Gallbladder distension. Maximum short diameter ≥ 36 mm. Category 3, Assessment D2
Fig. 40
Fig. 40
Wall thickening. Diffuse wall thickening (without small cystic structure or comet-like echo). Category 3, Assessment D2
Fig. 41
Fig. 41
Wall thickening. Diffuse wall thickening (with cholecystolithiasis and small cystic structure or comet-like echo). Category 2, Assessment C
Fig. 42
Fig. 42
Wall thickening. Diffuse wall thickening (with irregularity of the layered structure of the wall and disruption of the outermost hyperechoic layer). Category 4, Assessment D2
Fig. 43
Fig. 43
Wall thickening. Localized wall thickening (without small cystic structure or comet-like echo). Left: convex probe; right: high-frequency probe. Category 4, Assessment D2
Fig. 44
Fig. 44
Wall thickening. Localized wall thickening (mimicking debris echo without small cystic structure or comet-like echo). Left: long-axis view; right: short-axis view. Category 4, Assessment D2
Fig. 45
Fig. 45
Wall thickening. Localized wall thickening (papillary without small cystic structure or comet-like echo). Category 4, Assessment D2
Fig. 46
Fig. 46
Wall thickening. Localized wall thickening (with comet-like echo). Category 2, Assessment C
Fig. 47
Fig. 47
Protruded or mass lesion (polyp). Pedunculated (maximum diameter < 5 mm). Category 2, Assessment B
Fig. 48
Fig. 48
Protruded or mass lesion (polyp). Pedunculated [maximum diameter ≥ 5 mm, < 10 mm (mulberry-like)]. Category 2, Assessment B
Fig. 49
Fig. 49
Protruded or mass lesion (polyp). Pedunculated [maximum diameter ≥ 5 mm, < 10 mm (with hyperechoic spot)]. Category 2, Assessment B
Fig. 50
Fig. 50
Protruded or mass lesion (polyp). Pedunculated (maximum diameter ≥ 10 mm). Category 4, Assessment D2
Fig. 51
Fig. 51
Protruded or mass lesion (polyp). Sessile (non-pedunculated) (without tear of the layered structure of the attached wall). Category 4, Assessment D2
Fig. 52
Fig. 52
Protruded or mass lesion (polyp). Sessile (non-pedunculated) (with small cystic structures). Left: convex probe; right: high-frequency probe. Category 2, Assessment C
Fig. 53
Fig. 53
Protruded or mass lesion (polyp). Sessile (broad-based) (with tear of the layered structure of the attached wall). Category 5, Assessment D1
Fig. 54
Fig. 54
Other findings. Stone image (strong echo without wall thickening). Category 2, Assessment C
Fig. 55
Fig. 55
Other findings. Pneumobilia (movable linear strong echo with position change). Category 2, Assessment C
Fig. 56
Fig. 56
Other findings. Debris echo (gallbladder). Category 3, Assessment D2
Fig. 57
Fig. 57
Other findings. Debris echo (mass lesion with the irregular outermost hyperechoic layer of the attached wall of the extrahepatic bile duct) (left: gallbladder, right: extrahepatic bile duct). Gallbladder is Category 3 and Assessment D2, but extrahepatic bile duct is Category 5 and Assessment D1
Fig. 58
Fig. 58
Extrahepatic bile duct. Morphological abnormality. (Dilatation of the perihilar extrahepatic bile duct is present, but abnormal findings up to the distal bile duct near the papillary edge are not present.) Left: Perihilar extrahepatic bile duct, Right: Distal extrahepatic bile duct. Category 2, Assessment C
Fig. 59
Fig. 59
Extrahepatic bile duct. Morphological abnormality. Extrahepatic bile duct dilatation with cystic shape. Category 4, Assessment D2
Fig. 60
Fig. 60
Extrahepatic bile duct. Morphological abnormality. Extrahepatic bile duct dilatation with fusiform shape. Category 4, Assessment D2
Fig. 61
Fig. 61
Wall thickening. Maximum wall thickness ≥ 3 mm (without irregularity of the mucosal surface and layered structure). Category 3, Assessment D2
Fig. 62
Fig. 62
Wall thickening. Irregular layered structure (with irregularity of the mucosal surface and layered structure). Category 5, Assessment D1
Fig. 63
Fig. 63
Protruded or mass lesion (polyp). Mass lesion (without disruption of the layered structure of the attached wall). Category 4, Assessment D2
Fig. 64
Fig. 64
Protruded or mass lesion (polyp). Mass lesion (with disruption of the layered structure of the attached wall). Category 5, Assessment D1
Fig. 65
Fig. 65
Other findings. Stone image (with acoustic shadow). Category 2, Assessment D1
Fig. 66
Fig. 66
Other findings. Stone image (without acoustic shadow). Category 2, Assessment D1
Fig. 67
Fig. 67
Other findings. Debris echo (with dilated extrahepatic bile duct). Category 3, Assessment D2
Fig. 68
Fig. 68
Measurement of main pancreatic duct diameter
Fig. 69
Fig. 69
Morphological abnormality. Maximum short diameter < 10 mm. Category 2, Assessment D2
Fig. 70
Fig. 70
Morphological abnormality. Maximum short diameter ≥ 30 mm. Category 2, Assessment D2
Fig. 71
Fig. 71
Morphological abnormality. Localized swelling (pancreatic head) (with decreased echo level). Category 4, Assessment D2
Fig. 72
Fig. 72
Morphological abnormality. Localized swelling (pancreatic tail) (with decreased echo level). Category 4, Assessment D2
Fig. 73
Fig. 73
Main pancreatic duct dilatation. Maximum diameter ≥ 3 mm at pancreatic body (with calcification of pancreatic parenchyma). Category 3, Assessment D2
Fig. 74
Fig. 74
Main pancreatic duct dilatation. Maximum diameter ≥ 3 mm at pancreatic body (with calcification in the main pancreatic duct). Category 3, Assessment D2
Fig. 75
Fig. 75
Main pancreatic duct dilatation. Maximum diameter ≥ 3 mm at pancreatic body (with papillary nodule in the main pancreatic duct). Category 4, Assessment D2
Fig. 76
Fig. 76
Main pancreatic duct dilatation. Maximum diameter ≥ 3 mm at pancreatic body (with downstream (duodenal side) stenosis). Left: pancreatic body; right: main pancreatic duct stenosis in the pancreatic head. Category 4, Assessment D2
Fig. 77
Fig. 77
Solid lesion. Hypo(iso)echoic or mixed hyper- and hypoechoic mass lesion (lesion presenting a mixed pattern with a mixture of solid and cystic components). Category 4, Assessment D2
Fig. 78
Fig. 78
Cystic lesion. A solid component (mural nodules/wall thickening) is present (lesion presenting a mixed pattern with a mixture of solid and cystic components). Category 4, Assessment D2
Fig. 79
Fig. 79
Solid lesion. Hyperechoic mass lesion (maximum diameter < 15 mm). Category 2, Assessment C
Fig. 80
Fig. 80
Solid lesion. Hyperechoic mass lesion (maximum diameter ≥ 15 mm). Category 3, Assessment D2
Fig. 81
Fig. 81
Solid lesion. Hypoechoic mass lesion. Category 4, Assessment D2
Fig. 82
Fig. 82
Solid lesion. Hypoechoic mass lesion (with eggshell-like calcification). Category 4, Assessment D2
Fig. 83
Fig. 83
Solid lesion. Hypoechoic mass lesion with the disrupted main pancreatic duct (mass lesion with dilatation of caudal pancreatic duct). Category 5, Assessment D1
Fig. 84
Fig. 84
Cystic lesion (including branch dilatation). Maximum diameter ≥ 5 mm. Category 3, Assessment D2
Fig. 85
Fig. 85
Cystic lesion (including branch dilatation). A solid component (mural nodules) is present. Category 4, Assessment D2
Fig. 86
Fig. 86
Cystic lesion (including branch dilatation). A solid component (wall thickening) is present. Category 4, Assessment D2
Fig. 87
Fig. 87
Cystic lesion (including branch dilatation). A change in internal fluid (internal echogenic spots) is present. Category 4, Assessment D2
Fig. 88
Fig. 88
Cystic lesion (including branch dilatation). A change in internal fluid (internal echogenic spots) is present. Category 4, Assessment D2
Fig. 89
Fig. 89
Other findings. Calcified lesion (calcification in the pancreatic body and tail). Category 2, Assessment C
Fig. 90
Fig. 90
Other findings. Calcification lesion (calcification in the main pancreatic duct in the pancreatic head (without main pancreatic duct dilatation in the pancreatic body)). Category 2, Assessment C
Fig. 91
Fig. 91
Other findings. Vascular abnormality (A cystic lesion is observed in the pancreas body by the B-mode, and an internal blood flow signal is present on color Doppler.). Left: B-mode; right: color Doppler. Category 2, Assessment D2
Fig. 92
Fig. 92
Measurement of spleen diameter. Visualize the spleen in the long-axis view and measure the maximum diameter
Fig. 93
Fig. 93
Post-local treatment (post-splenic embolization). Category 2, Assessment C
Fig. 94
Fig. 94
Malformation. Maximum diameter ≥ 15 cm. Category 3, Assessment D2
Fig. 95
Fig. 95
Solid lesion. Hyperechoic mass image. Category 3, Assessment D2
Fig. 96
Fig. 96
Solid lesion. Hypoechoic mass image. Category 4, Assessment D2
Fig. 97
Fig. 97
Solid lesion. Hyper/hypoechoic mixed mass image. Category 4, Assessment D2
Fig. 98
Fig. 98
Solid lesion. Central hyperechoic mass image. Category 5, Assessment D1
Fig. 99
Fig. 99
Cystic lesion. A solid component (intracystic nodules/wall thickening/internal echogenic spots) is present. Category 4, Assessment D2
Fig. 100
Fig. 100
Other findings. Calcified opacity. Category 2, Assessment B
Fig. 101
Fig. 101
Other findings. Vascular abnormality (collateral flow of splenic vein). Category 2, Assessment D2
Fig. 102
Fig. 102
Other findings. Solid lesion in the splenic hilum. Category 3, Assessment D2
Fig. 103
Fig. 103
Other findings. Solid lesion in the splenic hilum (image of oval mass with homogeneous internal echo at echo level equal to that of the spleen). Category 2, Assessment B
Fig. 104
Fig. 104
Measurement of kidney diameter. Measure the longest diameter where the renal parenchyma would normally be, without including cyst protruding outside the kidney
Fig. 105
Fig. 105
Post-partial resection/post-renal transplantation. Post-partial resection. Category 2, Assessment B
Fig. 106
Fig. 106
Post-partial resection/post-renal transplantation. Transplanted kidney (post-transplantation in pelvic cavity). Category 2, Assessment B
Fig. 107
Fig. 107
Morphological abnormality. Congenital deformity (renal column of Bertin). Category 2, Assessment B
Fig. 108
Fig. 108
Morphological abnormality. Congenital deformity (double renal pelvis). Category 2, Assessment B
Fig. 109
Fig. 109
Morphological abnormality. Congenital deformity (horseshoe kidney). Right abdominal vertical scan, abdominal midline horizontal scan, and left abdominal vertical scan. Category 2, Assessment B
Fig. 110
Fig. 110
Morphological abnormality. Rugged contour is present (basket-like blood flow is displayed in lesion on color Doppler). Left: convex probe; right: power Doppler with high-frequency probe. Category 3, Assessment D2
Fig. 111
Fig. 111
Morphological abnormality. A rugged contour is present (vascular structure similar to that of the normal renal parenchyma on color Doppler). Left: renal long-axis view; right: color Doppler. Category 2, Assessment B
Fig. 112
Fig. 112
Morphological abnormality. Splitting and deformation of central echo complex. Category 3, Assessment D2
Fig. 113
Fig. 113
Solid lesion. Hyperechoic mass with maximum diameter < 10 mm. Left: convex probe; right: high-frequency linear probe. Category 3, Assessment C
Fig. 114
Fig. 114
Solid lesion. A solid lesion is present (hypoechoic mass with irregular contour). Category 3, Assessment D2
Fig. 115
Fig. 115
Solid lesion. A peripheral hypoechoic zone is present in a round lesion with a distinct border and smooth contour. Category 4, Assessment D2
Fig. 116
Fig. 116
Solid lesion. Deformation of the central echo complex is present (hypoechoic lesion with irregular contour). Category 4, Assessment D2
Fig. 117
Fig. 117
Solid lesion. An internal anechoic region with a peripheral hypoechoic zone and lateral shadow is present in a round lesion with a distinct border and a smooth contour. Category 5, Assessment D1
Fig. 118
Fig. 118
Solid lesion. Brightness equal to or higher than that of the central echo complex with an irregular contour. Maximum diameter < 40 mm. Category 2, Assessment C
Fig. 119
Fig. 119
Solid lesion. Brightness equal to or higher than that of the central echo complex a comet image is present. Maximum diameter < 40 mm. Category 2, Assessment C
Fig. 120
Fig. 120
Solid lesion. Brightness equal to or higher than that of the central echo complex with an irregular contour and comet image is present. Maximum diameter ≥ 40 mm. Category 2, Assessment D2
Fig. 121
Fig. 121
Cystic lesion. No more than two thin septi are present. Category 2, Assessment B
Fig. 122
Fig. 122
Cystic lesion. Microcalcification is present. Category 2, Assessment B
Fig. 123
Fig. 123
Cystic lesion. Five or more cysts are present bilaterally (longest diameter > 9 cm on both sides). Left: right renal long-axis view; right: left renal long-axis view. Category 2, Assessment D2
Fig. 124
Fig. 124
Cystic lesion. Five or more cysts are present bilaterally (longest diameter ≤ 9 cm). Left: right renal long-axis view, right: left renal long-axis view. Category 2, Assessment C
Fig. 125
Fig. 125
Cystic lesion. Multiple thin septi are present. Category 3, Assessment C
Fig. 126
Fig. 126
Cystic lesion. Multiple thin septi and nodular calcification are present. Left: convex probe; right: high-frequency probe. Category 3, Assessment C
Fig. 127
Fig. 127
Cystic lesion. A solid component (septal thickening) is present. Category 4, Assessment D2
Fig. 128
Fig. 128
Cystic lesion. A solid component (intracystic nodules) is present. Category 4, Assessment D2
Fig. 129
Fig. 129
Other findings. Calcified lesion (in renal parenchyma). Category 2, Assessment B
Fig. 130
Fig. 130
Other findings. Calcified lesion (in renal parenchyma/in pelviocaliceal system). Renal stone. Maximum diameter ≥ 10 mm. Category 2, Assessment D2
Fig. 131
Fig. 131
Other findings. Calcified lesion. In the pelviocaliceal system. Maximum diameter < 10 mm. Left: long-axis view; right: short-axis view. Category 2, Assessment C
Fig. 132
Fig. 132
Other findings. Calcified lesion. In the pelviocaliceal system. Maximum diameter ≥ 10 mm. Category 2, Assessment D2
Fig. 133
Fig. 133
Other findings. Pyelectasis (unknown cause of occlusion). Category 3, Assessment D2
Fig. 134
Fig. 134
Other findings. Mild pyelectasis (without caliectasis). Category 2, Assessment B
Fig. 135
Fig. 135
Other findings. Pyelectasis (with calcified lesion in the occluded region). Category 2, Assessment D2
Fig. 136
Fig. 136
Other findings. Pyelectasis (with calcified lesion in the ureter). Category 2, Assessment D2
Fig. 137
Fig. 137
Other findings. Pyelectasis (with a solid lesion in the occluded region). Left: renal long-axis view; right: long-axis view of upper ureter from renal pelvis. Category 4, Assessment D2
Fig. 138
Fig. 138
Other findings. Vascular abnormality. A cystic lesion is present in the renal hilus (left), and a blood flow signal is present on color Doppler (right). Left: renal short-axis view b-mode; right: color Doppler. Category 2, Assessment D2
Fig. 139
Fig. 139
Other findings. Vascular abnormality. An irregular anechoic lesion is present in the renal central echo complex (left), and a blood flow signal is present on color Doppler (right). Left: renal long-axis view b-mode; right: color Doppler. Category 2, Assessment D2
Fig. 140
Fig. 140
Measurement of fusiform aneurysm diameter. (https://www.jsum.or.jp/committee/diagnostic/pdf/aorticlesion2020.pdf)
Fig. 141
Fig. 141
Post-treatment (stent-graft insertion). Category 2, Assessment B
Fig. 142
Fig. 142
Localized aortic dilatation (32 mm). Fusiform dilatation. Maximum short diameter ≥ 30 mm, < 45 mm. Left: short-axis view; right: long-axis view. Category 2, Assessment C
Fig. 143
Fig. 143
Localized aortic dilatation (62 mm). Fusiform dilatation. Maximum short diameter ≥ 55 mm. Left: Short-axis view; right: long-axis view. Category 2, Assessment D1P
Fig. 144
Fig. 144
Localized aortic dilatation. Saccular dilatation (saccular aneurysm). Left: short-axis view; right: long-axis view. Category 2, Assessment D2P
Fig. 145
Fig. 145
Other findings. A flap is present (maximum short diameter 23 mm). Category 2, Assessment D2
Fig. 146
Fig. 146
Other findings. Plaque. Category 2, Assessment C
Fig. 147
Fig. 147
Other findings. Wall thickening and calcification. Category 2, Assessment C
Fig. 148
Fig. 148
Lymph-node swelling. Minor axis ≥ 7 mm. Category 3, Assessment C
Fig. 149
Fig. 149
Lymph-node swelling. Either minor axis ≥ 10 mm or minor/major axis ratio ≥ 0.5. Category 4, Assessment D2
Fig. 150
Fig. 150
Intraperitoneal fluid retention. Left: right upper abdominal horizontal scan; right: right lower abdominal horizontal scan. Category 3, Assessment D2
Fig. 151
Fig. 151
Intraperitoneal fluid retention (with debris echo). Category 4, Assessment D2
Fig. 152
Fig. 152
Intrathoracic fluid retention (without debris echo in pleural fluid). Category 3, Assessment D2
Fig. 153
Fig. 153
Intrathoracic fluid retention (with debris echo in pleural fluid). Category 4, Assessment D2
Fig. 154
Fig. 154
Intrathoracic fluid retention (with solid echo image in pleural fluid). Category 4, Assessment D2
Fig. 155
Fig. 155
Fluid retention in cardiac cavity. Category 2, Assessment D2
Fig. 156
Fig. 156
Abdominal cavity, retroperitoneum, or pelvic cavity (including adrenal gland). Retroperitoneal mass image. Category 3, Assessment D2
Fig. 157
Fig. 157
Abdominal cavity, retroperitoneum, or pelvic cavity (including adrenal gland). Intravesical mass image. Category 3, Assessment D2

Comment in

References

    1. Working Group on Revision of the Manual for Abdominal Ultrasound in Cancer Screening and Health Checkups, Ultrasound Screening Committee of the Japanese Society of Gastrointestinal Cancer Screening et al. Manual for abdominal ultrasound in cancer screening and health checkups. J Gastrointest Cancer Screen. 2014;52:471–493.
    1. Committee of Abdominal Ultrasound Department for the Creation of Guidelines for Judgment of Imaging Examination by The Japan Society of Ningen Dock. Manual for abdominal ultrasound in cancer screening and health checkups. J Gastrointest Cancer Screen. 2015,http://www.ningen-dock.jp/wp/common/data/other/inspection/m_ultrasound_e.... (In Japanese, accessed on 5 Aug 2022).
    1. Subcommittee on the Manual for Abdominal Ultrasound in Cancer Screening and Health Checkups Manual for Abdominal Ultrasound in Cancer Screening and Health Checkups, Terminology and Diagnostic Criteria Committee of The Japan Society of Ultrasonics in Medicine. Jpn J Med Ultrasonics. 2015;42:201–24 (In Japanese).
    1. Working Group on Creation of the Manual for Abdominal Ultrasound in Cancer Screening and Health Checkups, Ultrasound Screening Committee of the Japanese Society of Gastrointestinal Cancer Screening Manual for Abdominal Ultrasound Cancer Screening. J Gastrointest Cancer Screen. 2011;49:549–565.
    1. Sachiko T, Shinji O, Takashi K, et al. Outline of the guideline for abdominal ultrasound cancer screening. Jpn J Med Ultrasonics. 2013;40:549–565. doi: 10.3179/jjmu.JJMU.R.7. - DOI

Publication types