. 2023 Mar;10(9):e2204194.
doi: 10.1002/advs.202204194. Epub 2023 Jan 22.

Dipeptidyl Peptidase 4/Midline-1 Axis Promotes T Lymphocyte Motility in Atherosclerosis

Affiliations

Dipeptidyl Peptidase 4/Midline-1 Axis Promotes T Lymphocyte Motility in Atherosclerosis

Xiaoquan Rao et al. Adv Sci (Weinh). 2023 Mar.

Abstract

T cells play a crucial role in atherosclerosis, with its infiltration preceding the formation of atheroma. However, how T-cell infiltration is regulated in atherosclerosis remains largely unknown. Here, this work demonstrates that dipeptidyl peptidase-4 (DPP4) is a novel regulator of T-cell motility in atherosclerosis. Single-cell ribonucleic acid (RNA) sequencing and flow cytometry show that CD4+ T cells in atherosclerotic patients display a marked increase of DPP4. Lack of DPP4 in hematopoietic cells or T cells reduces T-cell infiltration and atherosclerotic plaque volume in atherosclerosis mouse models. Mechanistically, DPP4 deficiency reduces T-cell motility by suppressing the expression of microtubule associated protein midline-1 (Mid1) in T cells. Deletion of either DPP4 or Mid1 inhibits chemokine-induced shape change and motility, while restitution of Mid1 in Dpp4-/- T cell largely restores its migratory ability. Thus, DPP4/Mid1, as a novel regulator of T-cell motility, may be a potential inflammatory target in atherosclerosis.

Keywords: T cell; atherosclerosis; dipeptidyl peptidase-4; midline-1; migration.


Conflict of interest statement

The authors declare no conflict of interest.

Figures

Figure 1
Figure 1
Single cell RNA profiling of circulating immune cells in patients with atherosclerosis and healthy controls: peripheral blood mononuclear cells (PBMCs) from four patients with atherosclerosis (Ath) and four healthy controls (Ctrl) were used for 10× single cell RNA sequencing. After quality control analysis, a total of 5151 cells from atherosclerosis patients and 5044 cells from control subjects were acquired. a) The presence of aortic atherosclerosis was confirmed by 3D MRI scan. b) tSNE plot showing distribution and clustering of cells from healthy controls (blue) or atherosclerotic patients (red). c) tSNE plot showing different PBMC clusters and their corresponding immune cell types. d) Violin plots showing representative marker genes of B cell (Ms4a1, Cd79a), T cell (Cd3e, Cd3d), CD8+ T cell (Cd8a, Gzmh), CD4+ T cell (Il7r, Junb), natural killer cell (Klrf1, Prf1), monocyte (Cd14), and granulocyte (Grn) in different clusters. e) Heat map showing top differentially expressed genes in each cluster from atherosclerosis and control group. f) tSNE plot showing dipeptidyl peptidase‐4 (DPP4) expression in cells from healthy controls or atherosclerotic patients. Left, DPP4 expression in all populations from both patients with atherosclerosis and healthy controls; middle, DPP4 expression in cells from healthy controls; right, DPP4 expression in cells from patients with atherosclerosis. Cells expressing DPP4 were shown in red color. N = 4 per group for figures b–f.
Figure 2
Figure 2
Dipeptidyl peptidase‐4 (DPP4) was increased in patients with atherosclerosis and was associated with plasma lipid levels: 27 patients with prior atherosclerotic disease and 14 healthy controls were recruited. a) Gating strategy of monocytes, B cells, CD4+ T cells, and CD8+ T cells. b) The expression of DPP4 on monocytes, B cells, CD4+ T cells, and CD8+ T cells in the blood of healthy controls. c) Flow cytometric detection of DPP4 expression on CD4+ T cells in patients with atherosclerosis (Ath) and controls (Ctrl). Representative contour plot (left panel) and statistical analysis (right panel) were shown. The means between the two groups was compared using unpaired Student's t test. d–f) Correlations between %DPP4+ cells in CD4+ T cells and levels of cholesterol (d), triglycerides (e), or ratio of total cholesterol/HDL‐cholesterol (f) were evaluated by linear regression. N = 27 for patients with atherosclerosis and N = 14 for healthy controls in figures a–c. N = 27 for figures d–f.
Figure 3
Figure 3
Contribution of bone marrow versus extramarrow tissue‐derived dipeptidyl peptidase‐4 (DPP4) to glucose intolerance: Irradiated Dpp4+/+ (Dpp4EM+/+ ) or Dpp4−/− (Dpp4E−/− ) mice were transplanted with bone marrow cells from Dpp4+/+ (Dpp4M+/+ ) or Dpp4−/− (Dpp4M−/− ) mice, followed by 14 weeks of high‐fat diet (HFD) (42% calories from fat) feeding. a) Diagram of reciprocal bone marrow transplantation was shown. b–f) Oral glucose tolerance tests at week 10 (b) or week 14 (c) after HFD feeding, body weight (d), fasting blood glucose (e), and food intake (f) were detected. n = 6 per group for Dpp4M+/+ and 5 per group for Dpp4M−/− . Two‐way analysis of variance (ANOVA) analysis with Tukey post hoc test was used to compare the mean differences among the groups.* p < 0.05 compared to Dpp4M+/+ ; # p < 0.05 compared to Dpp4EM+/+ .
Figure 4
Figure 4
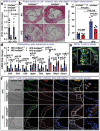
Hematopoietic deficiency of dipeptidyl peptidase‐4 (DPP4) reduced atherosclerosis and T‐cell mediated vascular inflammation in Ldlr−/− mice: Ldlr−/− mice transplanted with wild‐type (bmDpp4+/+ ) or Dpp4−/− (bmDpp4−/− ) bone marrow were fed a high‐fat diet (HFD) or normal chow diet (ND) for 6 months. a) DPP4 expression in aortic tissue isolated from chimeric Ldlr−/− mice that were transplanted with Dpp4−/− bone marrow (bmDpp4−/− ) was compared with Ldlr−/− mice with Dpp4+/+ bone marrow group (bmDpp4+/+ ) by real‐time polymerase chain reaction (PCR) analysis. b,c) Aortic sinus plaque burden (b, representative images; c, statistical analysis) was detected by hematoxylin and eosin (H&E) staining. d) Real‐time PCR analysis of aortic tissues showed a reduction of T‐cell markers CD3, CD4, and CD8, but not macrophage (CD11b) and dendritic cell (CD11c) markers. e,f) Aortic sinus sections were stained with DAPI (blue), DPP4 (green), and CD3 (red), and imaged under a confocal microscope. Tiled image shows the infiltration of DPP4‐expressing T cells (yellow) in the plaque of HFD fed Ldlr−/− mice with Dpp4+/+ bone marrow (e). Images showed a reduction of T‐cell infiltration in the plaque of Ldlr−/− mice with Dpp4−/− bone marrow (bmDpp4−/− ) when compared to Ldlr−/− mice with Dpp4+/+ bone marrow (bmDpp4+/+ ). f) Results were presented as mean ± SEM. Two‐way ANOVA analysis with Tukey post hoc test was used to compare the mean differences among the groups. N = 5–7 per group for figures a–f.
Figure 5
Figure 5
Deficiency of dipeptidyl peptidase‐4 (DPP4) on T‐cell reduced atherosclerotic lesion and T‐cell infiltration in aortic tissue: Rag1−/− mice lacking lymphocytes were adoptively transferred with T cells isolated from Dpp4−/− or Dpp4+/+ mice to establish T‐cell specific DPP4 deficient mice (Dpp4T‐∆ ) and control mice (Dpp4T‐WT ). The mice were then intravenously injected with 3 × 1011 vg AAV8 virus particles that overexpress proprotein convertase subtilisin/kexin type 9 (PCSK9), followed by 16 weeks of high‐fat diet (HFD) feeding to induce atherosclerosis. a, Section of aortic sinus were used for hematoxylin and eosin (H&E) staining to evaluate the plaque burden. b–f) Aorta and spleen tissues were harvested for the preparation of single cell suspension, followed by staining with CD45, CD11b, CD4, CD8, and DPP4. Stained cells were then analyzed on a flow cytometer to detect immune populations and DPP4 expression. CD4+ T cells, CD8+ T cells, and macrophages (CD11b+) were gated for further analyses (b). Representative dot plots (c) and statistical analysis (d) showed the frequencies of CD4+ T cells, CD8+ T cells, and macrophages in the aortic tissues of Dpp4 T‐∆ and Dpp4 T‐WT mice. Representative dot plots (e) and statistical analysis (f) showed the frequencies of CD4+ T cells, CD8+ T cells, and non T cells (CD4 CD8) in the spleen of Dpp4 T‐∆ and Dpp4 T‐WT mice. Two‐way ANOVA analysis with Tukey post hoc test was used to compare the mean differences among the groups. The data shown in this figure was representative of two independent experiments. N = 7 mice per group for figures a–f.
Figure 6
Figure 6
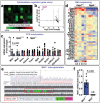
Loss of dipeptidyl peptidase‐4 (DPP4) reduced T‐cell migration and morphological changes: a–d) T cells isolated from wild‐type mice were used for a Transwell migration assay toward T‐cell chemokine CCL19. After 4‐h migration, T cells migrated into the bottom well (migrated) and those remained in the insert (unmigrated) were collected for imaging flow cytometric detection of DPP4 expression and morphology. a–c) Percentage of DPP4+ T cells (a), DPP4 mean fluorescence (MFI) (b), and representative histogram of DPP4 expression (c) were shown. Unpaired Student's t test was used to compare the mean differences between the groups. N = 6 for unmigrated group and 12 for migrated group. d) Representative histogram and images showing morphological changes in migrated and unmigrated cells. e,f) Migration of T cells isolated from Dpp4+/+ or Dpp4−/− mice toward CCL19 (e) or CCL21 (f) was evaluated by Transwell migration assays. Unpaired Student's t test was used to compare the mean differences between the groups. N = 4 per group. g) Migration of Dpp4+/+ or Dpp4−/− T cells toward CCL19 in the presence of DPP4 enzymatic inhibitor (DPP4i) alogliptin. Unpaired Student's t test was used to compare the mean differences between the groups. N = 5 per group. h–j) In vivo migration of Dpp4+/+ and Dpp4−/− T cells. T cells isolated from Dpp4+/+ or Dpp4−/− mice were labeled with CellTrace violet or CFSE, respectively and mixed at a ratio of 1:1. Mixed cells were then injected into the footpad of Dpp4+/+ mice. After 12 h, popliteal lymph nodes were isolated and analyzed for T‐cell migration using flow cytometry. The migration of Dpp4+/+ and Dpp4−/− total T cells (h), CD4+ T cells (i), and CD8+ T cells (j) into popliteal lymph nodes (left, statistical analysis of cell migration normalized by that in Dpp4+/+ T cells; right, pie chart and representative dot plot showing the percentage of labeled Dpp4+/+ or Dpp4−/− T cells in popliteal lymph nodes) were shown. N = 6 per group. k,l) Dpp4+/+ and Dpp4−/− T cells were used for imaging flow cytometric detection of morphological change. Representative flow cytometric images (k) and statistical analysis of Dpp4+/+ and Dpp4−/− T cells with low circularity (l) were shown. N = 4 per group. Results were presented as mean ± SEM. Unpaired Student's t test was used to compare the mean differences between the groups.
Figure 7
Figure 7
Potential involvement of Mid1 in dipeptidyl peptidase‐4 (DPP4) deficiency: a,b) Mouse cytoskeleton regulators gene array was performed using Dpp4+/+ and Dpp4−/− T cells. Heat map (a) and volcano plot (b) were shown. The data was representative of two independent experiments. c) Real‐time polymerase chain reaction (PCR) confirmation of selected genes using Dpp4+/+ and Dpp4−/− T cells. The downregulation of mid1 was confirmed in Dpp4−/− T cells. N = 6 per group. d) Heat map showing cytoskeleton regulatory gene expression using data collected from RNA sequencing of Dpp4+/+ and Dpp4−/− mice. e) Sequence of guidance RNA for Mid1−/− generation and sequencing result for F1 Mid1+/− mice. f) Real‐time PCR results showing the absence of Mid1 mRNA in Mid1−/− mice. UD, undetectable. The difference between the two groups was compared using unpaired Student's t test. N = 6 per group.
Figure 8
Figure 8
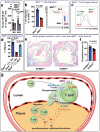
Deficiency of Mid1 reduced T‐cell motility and atherosclerosis: a) High‐fat diet (HFD) induced NFκB activation in perivascular fat tissue was blunted in chimeric mice transplanted with Dpp4−/− bone marrow. Results were presented as mean ± SEM. Two‐way ANOVA analysis was used to compare the mean differences among the groups. N = 4–9 per group. b) Splenic T cells isolated from Mid1+/+ or Mid1−/− mice were labeled with CellTrace Violet and CFSE, respectively. Cells were then mixed at 1:1 ratio and placed in the insert of a Transwell plate with CCL19 in the bottom well. Cells migrated to the bottom well and those remained in the insert were collected for flow cytometric detection. Migration was calculated based on the number of migrated and unmigrated cells (left panel). Representative dot plots show the percentage of Mid1+/+ and Mid1−/− T cells in the bottom well of the Transwell plate (right panel). The difference between the two groups was compared using unpaired Student's t test. N = 4 per group. c) Circularity of Mid1+/+ and Mid1−/− T cells in the bottom well (supplied with CCL19) of Transwell assay, as determined by imaging flow cytometry. d) Dpp4+/+ T and Dpp4−/− T cells were infected with Mid1‐expressing or empty control lentivirus. Cells were then used for Transwell assay with CCL19 as the chemokine. Migrations normalized by Dpp4+/+ T infected with control virus were calculated. Results were presented as mean ± SEM. Two‐way ANOVA analysis with Tukey post hoc test was used to compare the mean differences among the groups. e,f) Ldlr−/− mice transplanted with wild‐type (bmMid1+/+ ) or Mid1−/− (bmMid1−/− ) bone marrow were fed a HFD for 16 weeks, aortic sinus plaque burden (e, representative images; f, statistical analysis) was reduced in mice reconstituted with Mid1−/− bone marrow. Plaque area was indicated by green dashed lines. Difference between the two groups was compared using unpaired Student's t test. N = 5 for bmMid1+/+ and 7 for bmMid1−/− group. g) Schematic illustration of dipeptidyl peptidase‐4 (DPP4)/Mid1 axis in regulating T‐cell migration and atherosclerosis.

Similar articles

Cited by

References

    1. a) Hansson G. K., Hermansson A., Nat. Immunol. 2011, 12, 204; - PubMed
    2. b) Hansson G. K., Robertson A. K., Soderberg‐Naucler C., Annu. Rev. Pathol. 2006, 1, 297. - PubMed
    1. Saigusa R., Winkels H., Ley K., Nat. Rev. Cardiol. 2020, 17, 387. - PMC - PubMed
    1. a) Nauck M. A., Meier J. J., Cavender M. A., Abd El Aziz M., Drucker D. J., Circulation 2017, 136, 849; - PubMed
    2. b) Mulvihill E. E., Drucker D. J., Endocr. Rev. 2014, 35, 992; - PMC - PubMed
    3. c) Zhong J., Maiseyeu A., Davis S. N., Rajagopalan S., Circ. Res. 2015, 116, 1491. - PMC - PubMed
    1. a) White W. B., Cannon C. P., Heller S. R., Nissen S. E., Bergenstal R. M., Bakris G. L., Perez A. T., Fleck P. R., Mehta C. R., Kupfer S., Wilson C., Cushman W. C., Zannad F., Investigators E., N. Engl. J. Med. 2013, 369, 1327; - PubMed
    2. b) Scirica B. M., Bhatt D. L., Braunwald E., Steg P. G., Davidson J., Hirshberg B., Ohman P., Frederich R., Wiviott S. D., Hoffman E. B., Cavender M. A., Udell J. A., Desai N. R., Mosenzon O., McGuire D. K., Ray K. K., Leiter L. A., Raz I., Committee S.‐T. S., Investigators , N. Engl. J. Med. 2013, 369, 1317; - PubMed
    3. c) Green J. B., Bethel M. A., Armstrong P. W., Buse J. B., Engel S. S., Garg J., Josse R., Kaufman K. D., Koglin J., Korn S., Lachin J. M., McGuire D. K., Pencina M. J., Standl E., Stein P. P., Suryawanshi S., Van de Werf F., Peterson E. D., Holman R. R., Group T. S., N. Engl. J. Med. 2015, 373, 232; - PubMed
    4. d) Rosenstock J., Kahn S. E., Johansen O. E., Zinman B., Espeland M. A., Woerle H. J., Pfarr E., Keller A., Mattheus M., Baanstra D., Meinicke T., George J. T., von Eynatten M., McGuire D. K., Marx N., Investigators C., JAMA, J. Am. Med. Assoc. 2019, 322, 1155; - PMC - PubMed
    5. e) Rosenstock J., Perkovic V., Johansen O. E., Cooper M. E., Kahn S. E., Marx N., Alexander J. H., Pencina M., Toto R. D., Wanner C., Zinman B., Woerle H. J., Baanstra D., Pfarr E., Schnaidt S., Meinicke T., George J. T., von Eynatten M., McGuire D. K., Investigators C., JAMA, J. Am. Med. Assoc. 2019, 321, 69. - PMC - PubMed
    1. Bethel M. A., Patel R. A., Merrill P., Lokhnygina Y., Buse J. B., Mentz R. J., Pagidipati N. J., Chan J. C., Gustavson S. M., Iqbal N., Maggioni A. P., Öhman P., Poulter N. R., Ramachandran A., Zinman B., Hernandez A. F., Holman R. R., Group E. S., Lancet Diabetes Endocrinol. 2018, 6, 105. - PubMed

Publication types