. 2023 Apr;10(10):e2205289.
doi: 10.1002/advs.202205289. Epub 2023 Jan 22.

The Gut Microbiome Dynamically Associates with Host Glucose Metabolism throughout Pregnancy: Longitudinal Findings from a Matched Case-Control Study of Gestational Diabetes Mellitus

Affiliations

The Gut Microbiome Dynamically Associates with Host Glucose Metabolism throughout Pregnancy: Longitudinal Findings from a Matched Case-Control Study of Gestational Diabetes Mellitus

Zhonghan Sun et al. Adv Sci (Weinh). 2023 Apr.

Abstract

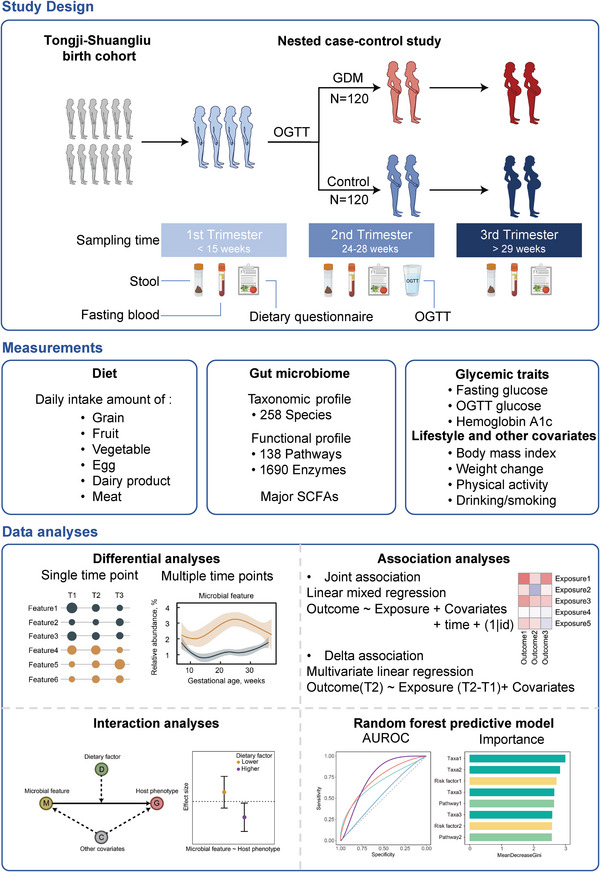
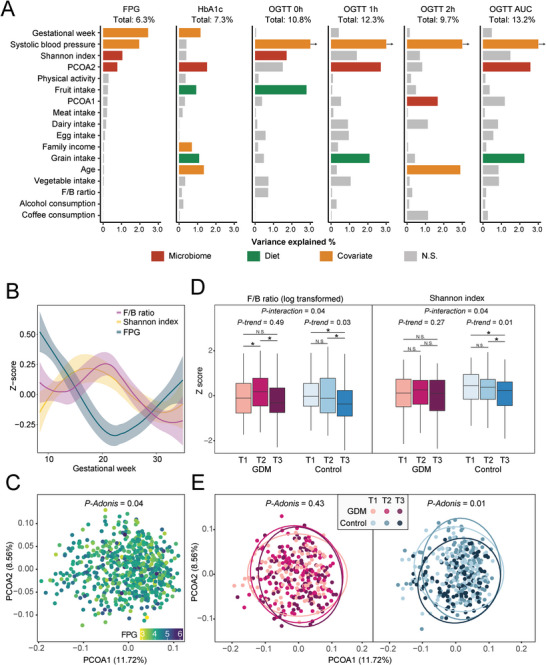
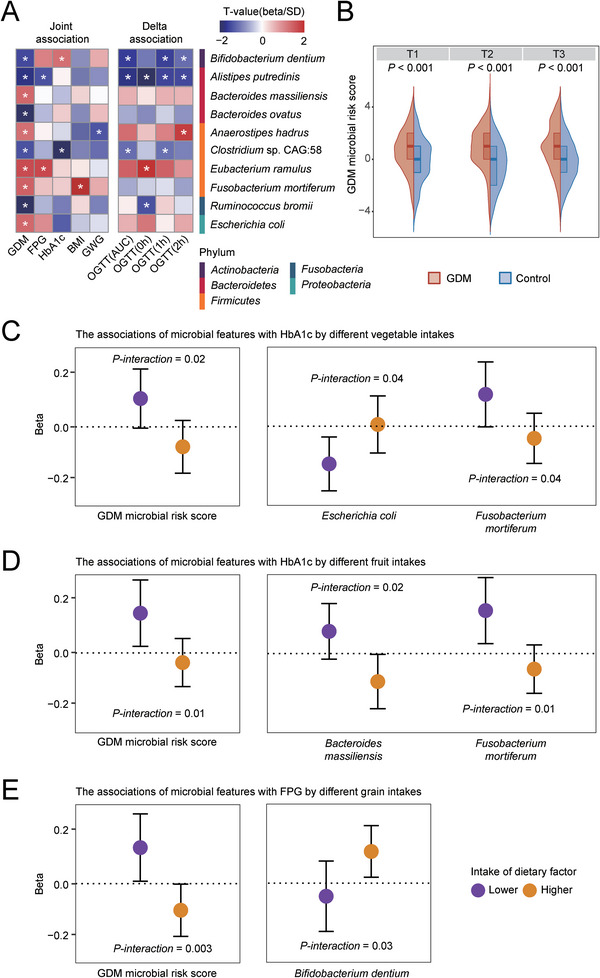
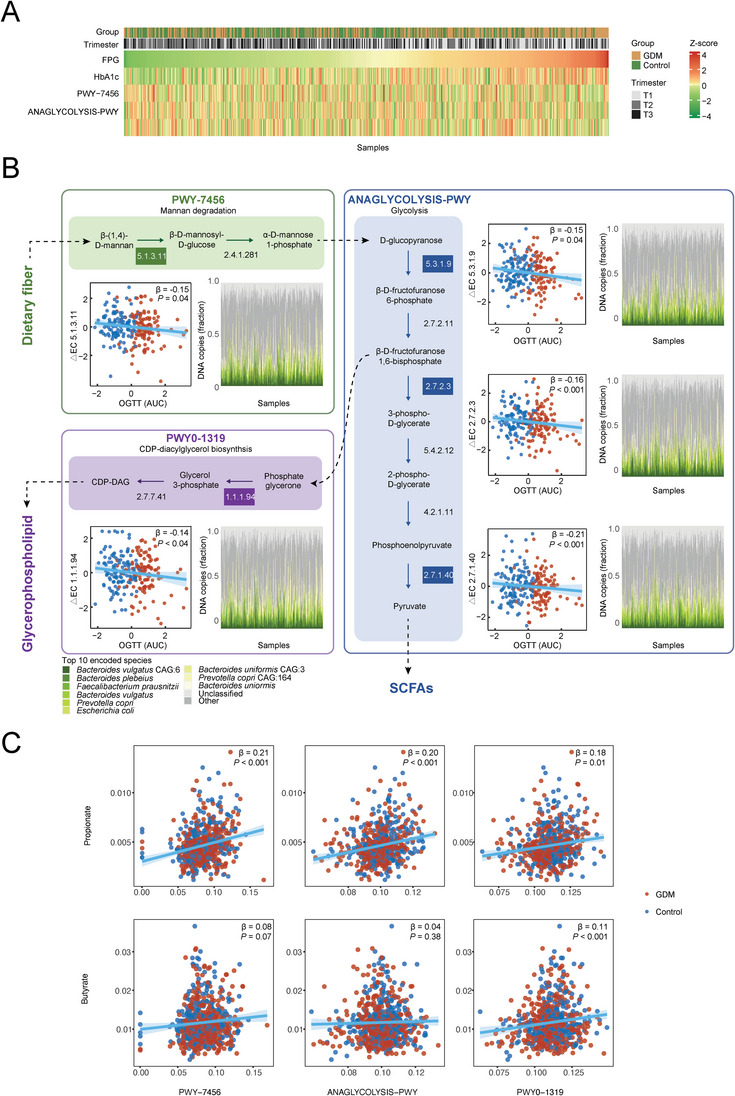
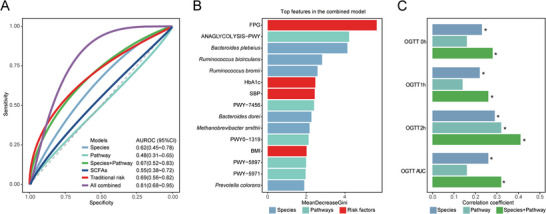
Though gut microbiome disturbance may be involved in the etiology of gestational diabetes mellitus (GDM), data on the gut microbiome's dynamic change during pregnancy and associations with gestational glucose metabolism are still inadequate. In this prospective study comprising 120 pairs of GDM patients and matched pregnant controls, a decrease in the diversity of gut microbial species and changes in the microbial community composition with advancing gestation are found in controls, while no such trends are observed in GDM patients. Multivariable analysis identifies 10 GDM-related species (e.g., Alistipes putredinis), and the integrated associations of these species with glycemic traits are modified by habitual intake of fiber-rich plant foods. In addition, the microbial metabolic potentials related to fiber fermentation (e.g., mannan degradation pathways) and their key enzymes consistently emerge as associated with both GDM status and glycemic traits. Microbial features especially those involved in fiber fermentation, provide an incremental predictive value in a prediction model with established risk factors of GDM. These data suggest that the gut microbiome remodeling with advancing gestation is different in GDM patients compared with controls, and dietary fiber fermentation contributes to the influence of gut microbiome on gestational glycemic regulation.

Keywords: gestational diabetes mellitus; glucose metabolism; gut microbiome; matched case-control study.


Conflict of interest statement

The authors declare no conflict of interest.

Figures

Figure 1
Figure 1
Study design, measurements, and analysis strategy. To associate the gut microbiome with diet and glucose metabolism, we profiled stool metagenomes and glycemic traits from a prospective case‐control study nested in the Tongji‐Shuangliu birth cohort. Blood and stool samples, dietary records, and health‐related information were collected, and taxonomic and functional profiling from stool shotgun metagenomes, fecal short chain fatty acids (SCFAs), plasma biomarkers of glucose metabolism, and other covariates were measured at each trimester (n = 720). The joint associations between microbial features and glycemic traits were estimated using linear mixed models with pooled data from three trimesters (n = 720). The delta associations were estimated using the change values of microbial features between the first trimester (T1) and the second trimester (T2) and oral glucose tolerance test (OGTT) measured in T2 (n = 240). Interaction analyses were performed to explore the potential interaction effect of dietary factors on the associations between microbial features and host glucose metabolism. Random forest classification models were constructed to estimate the prediction power of microbial data for the risk of gestational diabetes mellitus (GDM). The area under operating characteristic curve (AUROC) was used as a metric to quantify classifiers performance. Icons representing the types of collected samples were created using Biorender.com.
Figure 2
Figure 2
The gut microbiome composition among GDM patients and controls. A) The variance of glycemic traits explained by gut microbial composition, diet, and other covariates. The height of each bar represented the explained variance calculated using univariate linear regression. The color bar represented significant associations between glycemic traits and host factors (P < 0.05), while the grey bars represented non‐significant ones. The explained variances of fasting plasma glucose (FPG) and hemoglobin A1c (HbA1c) were estimated with pooled data from three trimesters, while the explained variances of OGTT glucose were estimated with data collected at T2. B) Distributions of Firmicutes to Bacteroidetes (F/B) ratio, microbial α‐diversity, and host FPG among all participants during pregnancy. The microbial α‐diversity was represented by the Shannon index. C) Principal coordinate analysis of the gut microbiome of all samples was conducted using species‐level Bray‐Curtis distance. The color gradient of dots represented matched host FPG. D) The temporal change of microbial F/B ratio (left) and α‐diversity (right) among participants with GDM and controls. The boxes in red represented samples from women with GDM and those in blue represented samples from controls. The inter‐group differences in F/B ratio and α‐diversity at each trimester were tested using the student's t‐test. The intra‐group change trends in F/B ratio and α‐diversity between trimesters were tested using linear regression. An interaction term of GDM status and trimester was further included to evaluate the effect of GDM status on these temporal changes. E) The temporal change of gut microbial composition among women with GDM (left) and controls (right) during the pregnancy. The intra‐group differences in β‐diversity between trimesters were calculated using permutational multivariate analysis of variance (PERMANOVA).
Figure 3
Figure 3
The associations of GDM microbial risk score and species with host glucose metabolism during pregnancy. A) The associations of GDM‐related species with host glucose metabolism and body weight. Asterisks represented FDR‐corrected P <0.25. B) The distribution of GDM microbial risk score in GDM patients and control at each trimester. C–D) The association between microbial features and HbA1c was modified by vegetable intake (C) and fruit intake (D). E) The association between microbial features and FPG was modified by grain intake.
Figure 4
Figure 4
A) The associations of microbial fiber fermentation related pathways with host glucose metabolism during pregnancy (Revised part). B)The associations of changes in key enzymes from T1 to T2 within the pathways of polysaccharide degradation (green), glycolysis (blue), and phospholipid biosynthesis (purple) with host OGTT glucose. The scatter plots showed the associations of these enzymes’ temporal change (from T1 to T2) with the area under OGTT glucose curve in T2. Red and blue dots indicated GDM patients and controls, respectively. The stack plots showed the proportions of enzymes encoded by specific species, whose colors were shown in the top legend. C) The associations of fermentation pathways and fecal levels of propionate and butyrate.
Figure 5
Figure 5
Performance of the random forest predictive models of GDM and OGTT glucose based on microbial features. A) Random forest classification models of GDM based on microbial features and traditional risk factors in T1. The predictive power of classification models was shown by the area under the receiver operating characteristic curve. The colors of the curves represented the data used to generate the predictive model. B) The most important factors in the combined prediction model for GDM. The width of each bar represented the importance of the corresponding variable, estimated by the mean decrease in the Gini index of random forest models. C) Random forest regression models of OGTT glucose based on microbial features. The predictive power of regression models was shown by the correlation between predicted values and observed values. Asterisks represented P < 0.05.

References

    1. McIntyre H. D., Catalano P., Zhang C., Desoye G., Mathiesen E. R., Damm P., Nat. Rev. Dis. Primers 2019, 5, 47. - PubMed
    1. Venkatesh K. K., Lynch C. D., Powe C. E., Costantine M. M., Thung S. F., Gabbe S. G., Grobman W. A., Landon M. B., JAMA, J. Am. Med. Assoc. 2022, 327, 1356. - PMC - PubMed
    1. Vounzoulaki E., Khunti K., Abner S. C., Tan B. K., Davies M. J., Gillies C. L., BMJ 2020, 369, m1361. - PMC - PubMed
    1. Clausen T. D., Mathiesen E. R., Hansen T., Pedersen O., Jensen D. M., Lauenborg J., Damm P., Diabetes Care 2008, 31, 340. - PubMed
    1. Ye W., Luo C., Huang J., Li C., Liu Z., Liu F., BMJ 2022, 377, e067946. - PMC - PubMed

Publication types

LinkOut - more resources