. 2023 Jan 9;164(3):bqad015.
doi: 10.1210/endocr/bqad015.

Deletion of Androgen Receptor in LepRb Cells Improves Estrous Cycles in Prenatally Androgenized Mice

Affiliations

Deletion of Androgen Receptor in LepRb Cells Improves Estrous Cycles in Prenatally Androgenized Mice

Alexandra L Cara et al. Endocrinology. .

Abstract

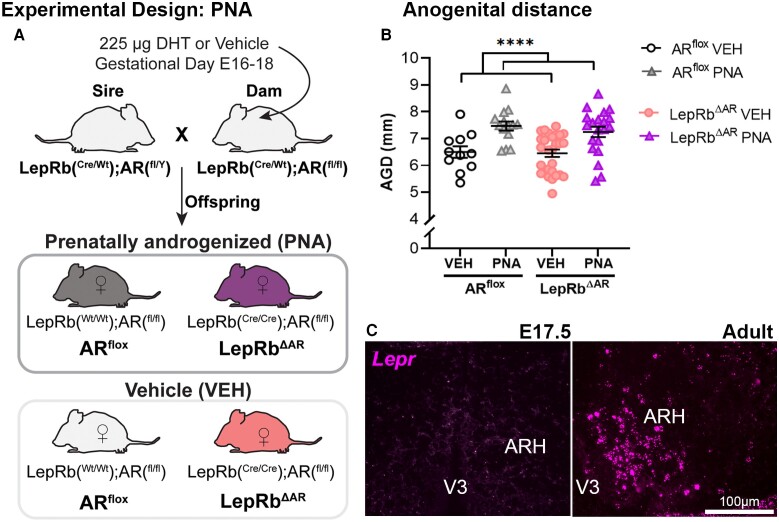
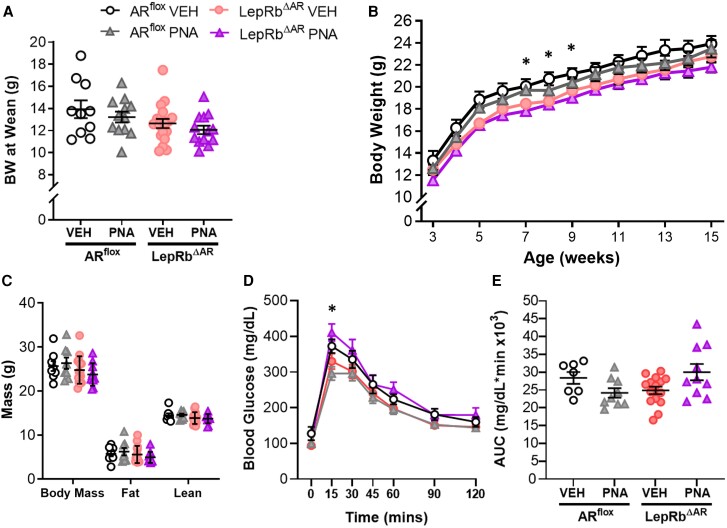
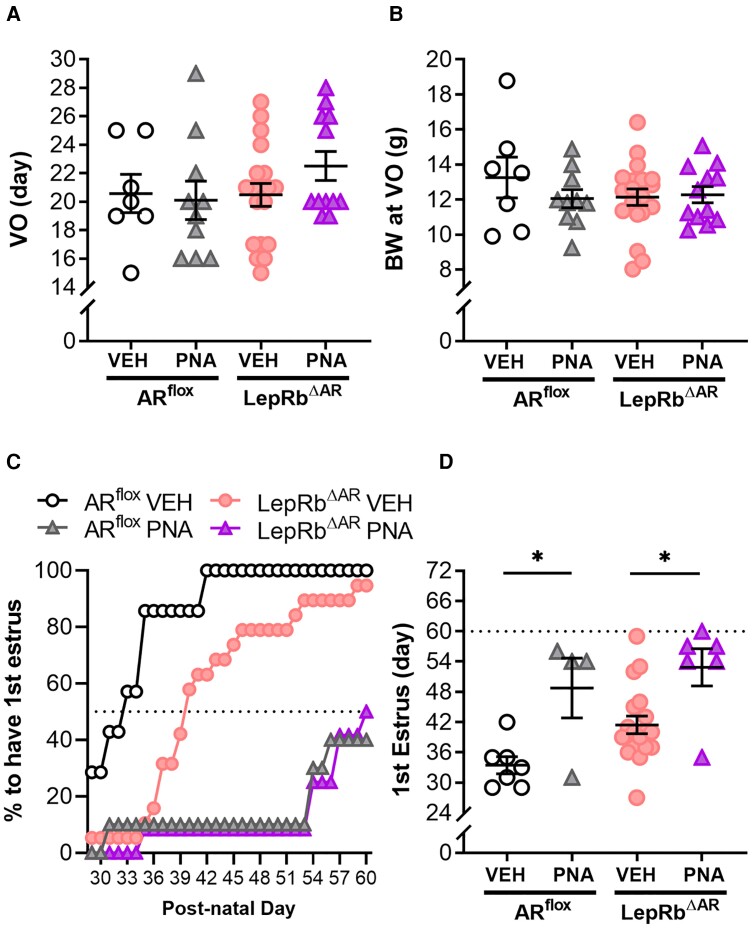
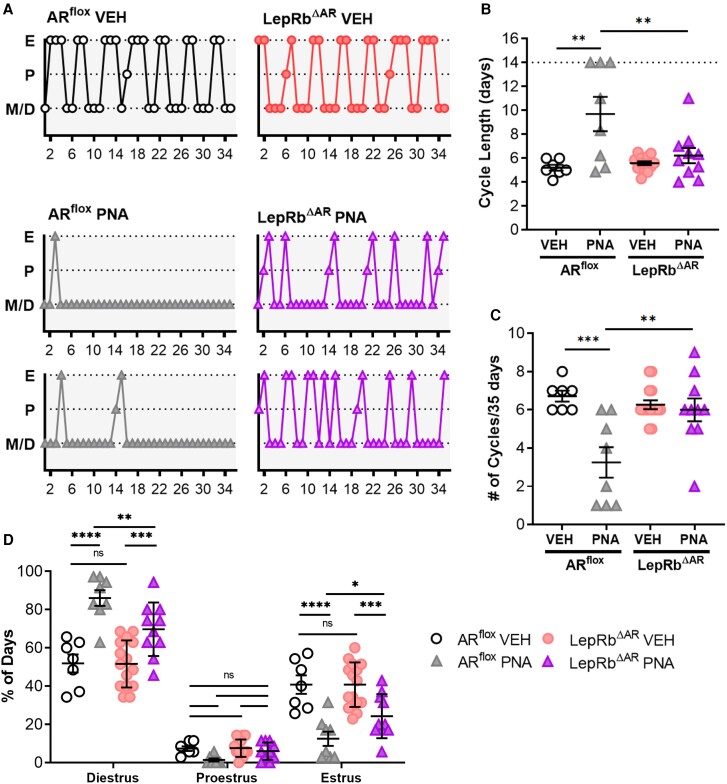
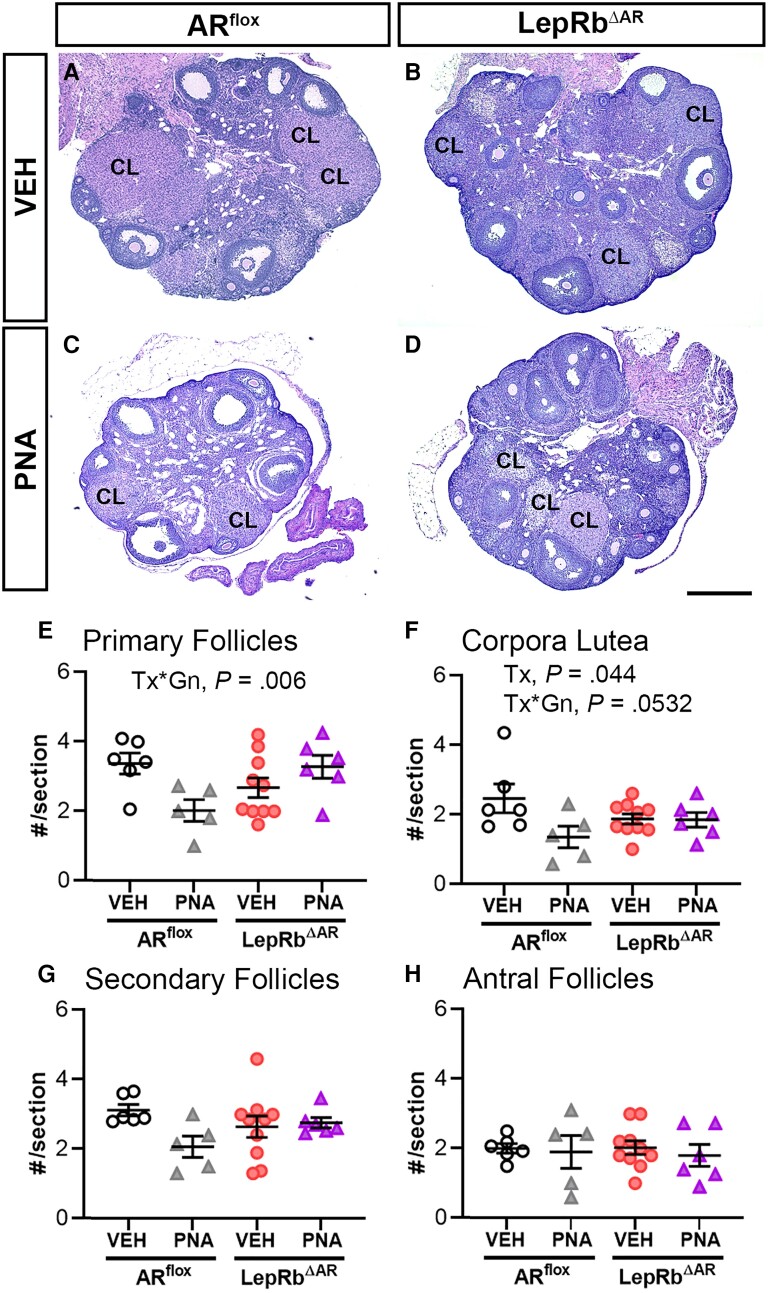
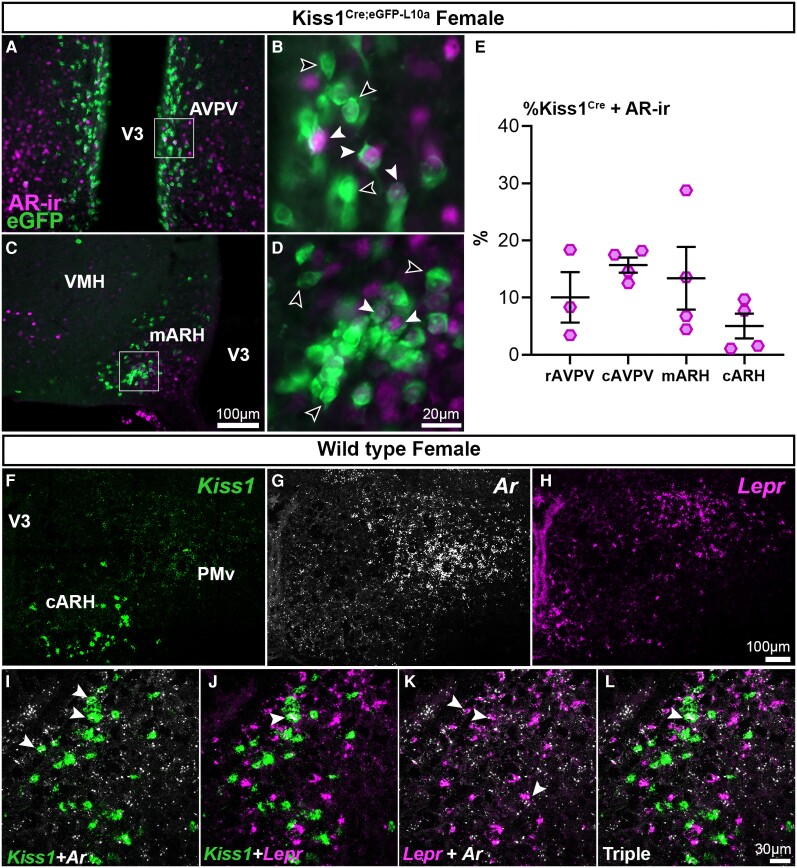
Androgens are steroid hormones crucial for sexual differentiation of the brain and reproductive function. In excess, however, androgens may decrease fertility as observed in polycystic ovary syndrome, a common endocrine disorder characterized by oligo/anovulation and/or polycystic ovaries. Hyperandrogenism may also disrupt energy homeostasis, inducing higher central adiposity, insulin resistance, and glucose intolerance, which may exacerbate reproductive dysfunction. Androgens bind to androgen receptors (ARs), which are expressed in many reproductive and metabolic tissues, including brain sites that regulate the hypothalamo-pituitary-gonadal axis and energy homeostasis. The neuronal populations affected by androgen excess, however, have not been defined. We and others have shown that, in mice, AR is highly expressed in leptin receptor (LepRb) neurons, particularly in the arcuate (ARH) and the ventral premammillary nuclei (PMv). Here, we assessed if LepRb neurons, which are critical in the central regulation of energy homeostasis and exert permissive actions on puberty and fertility, have a role in the pathogenesis of female hyperandrogenism. Prenatally androgenized (PNA) mice lacking AR in LepRb cells (LepRbΔAR) show no changes in body mass, body composition, glucose homeostasis, or sexual maturation. They do show, however, a remarkable improvement of estrous cycles combined with normalization of ovary morphology compared to PNA controls. Our findings indicate that the prenatal androgenization effects on adult reproductive physiology (ie, anestrus and anovulation) are mediated by a subpopulation of LepRb neurons directly sensitive to androgens. They also suggest that the effects of hyperandrogenism on sexual maturation and reproductive function in adult females are controlled by distinct neural circuits.

Keywords: androgen receptor; estrous cycle; hyperandrogenism; hypothalamus; leptin receptor.


Figures

Figure 1.
Figure 1.
Experimental design and validation of prenatal androgenization. A, Illustration of experimental setup. A sire and a dam heterozygous for LeprCre and hemizygous or homozygous for Arflox were mated to generate littermate controls with 2 copies of LeprCre (LepRb-specific AR deletion, LepRbΔAR) and 2 LeprWt alleles (ARflox). Dams were treated with dihydrotestosterone (DHT) or vehicle (VEH) on embryonic day (E)16, 17, and 18. Prenatally androgenized (PNA) and control VEH female offspring were used for experiments. B, Scatter plot graph showing anogenital distance (AGD) of adult postnatal day 60 mice (mean ± SEM, VEH ARflox n = 11, mean 6.49 mm ± 0.21, ARflox PNA n = 14, mean 7.46 mm ± 0.16, LepRbΔAR VEH n = 27, mean 6.45 mm ± 0.13, LepRbΔAR PNA n = 20, mean 7.24 mm ± 0.19). Prenatal androgenization increased AGD in experimental and control mice (2-way analysis of variance, effect of treatment P < .0001; F (1, 69) = 22.79). C, Images showing fluorescent in situ hybridization signal for Lepr in the arcuate nucleus (ARH) at E17.5 (left panel) and adult (right panel). Lepr was not observed during late embryonic development. Lepr is highly expressed in the adult ARH, and served as a positive control. V3, third ventricle. Scale bar = 100 μm.
Figure 2.
Figure 2.
Mild and transient changes in body weight (BW) and glucose tolerance were observed in prenatally androgenized (PNA) LepRΔAR mice. A, Scatter plot graph of body weight of experimental mice at weaning/postnatal day 21 (mean ± SEM, ARflox vehicle [VEH] n = 10, ARflox PNA n = 12, LepRbΔAR VEH n = 18, LepRbΔAR PNA n = 13). B, Line graph of weekly body weight from age 3 to 15 weeks (mean ± SEM, ARflox VEH n = 7, ARflox PNA n = 9, LepRbΔAR VEH n = 15, LepRbΔAR PNA n = 10). Body mass was analyzed by 2-way analysis of variance (ANOVA) with repeated measures and Holm-Sidak correction. A transient difference in body weight was observed. LepRΔAR PNA mice weighed less than ARflox PNA mice at 7 weeks (mean difference 1.9 g, SEM = 0.53 g, P = 0.01), and less than ARflox VEH mice at 8 weeks (mean difference 2.3 g, SEM = 0.68 g; P = .04) and 9 weeks (mean difference 2.2 g, SEM = 0.62 g; P = .02). C, Scatter plot graph of total body mass, fat, and lean mass of 19-week-old mice (mean ± SEM, ARflox VEH n = 8, ARflox PNA n = 8, LepRbΔAR VEH n = 15, LepRbΔAR PNA n = 10), analyzed by 2-way ANOVA and Holm-Sidak correction. Total body mass, fat, or lean mass was not different between groups. D, Line graph showing levels of blood glucose during glucose tolerance testing of 16- to 17-week-old mice (mean ± SEM, ARflox VEH n = 7, ARflox PNA n = 9, LepRbΔAR VEH n = 15, LepRbΔAR PNA n = 10). Blood glucose was greater in LepRbΔAR PNA mice vs ARflox PNA mice, but only at 15 minutes after glucose challenge (mean difference 114 mg/dL, SEM = 30 mg/dL; P = .01; 2-way ANOVA with repeated measures and Holm-Sidak correction). E, Scatter plot graph of area under the curve (AUC) of glucose tolerance test, analyzed by 2-way ANOVA with Holm-Sidak correction. AUC was not different between groups.
Figure 3.
Figure 3.
LepRb-specific deletion of androgen receptor (AR) does not affect pubertal timing and does not rescue delayed sexual maturation of prenatally androgenized (PNA) mice. A and B, Scatter plot graphs of day of vaginal opening (VO) and body weight (BW) at day of VO (mean ± SEM, ARflox vehicle [VEH] n = 7, ARflox PNA n = 10, LepRbΔAR VEH n = 19, LepRbΔAR PNA n = 12). C, Cumulative frequency plot of percentage of females that had first estrus plotted by postnatal day (PND). Dotted line indicates 50% to have first estrus. Half of VEH LepRbΔAR mice reached first estrus 7 days later than VEH ARflox mice (ARflox VEH 50% reached first estrus = 32.5 days, LepRbΔAR VEH 50% reached first estrus = 39.5 days). A total of 50% of mice in both PNA groups showed first estrus around PND 60. D, Scatter plot graph of day of first estrus of the animals that had first estrus by PND 60 (mean ± SEM, ARflox VEH n = 7, ARflox PNA n = 4, LepRbΔAR VEH n = 18, LepRbΔAR PNA n = 6). First estrus was monitored up until PND 60 (dotted line). Day of first estrus showed only a trend toward delay in VEH LepRbΔAR vs ARflox mice (mean difference = 7.97 days, SEM = 1.7 days; P = .052; 2-way analysis of variance [ANOVA] with Holm-Sidak correction). First estrus was delayed in PNA ARflox compared to VEH ARflox (mean difference = 15.3 days, SEM = 4.5 days; P = .022; 2-way ANOVA with Holm-Sidak correction), and in PNA LepRbΔAR compared to VEH LepRbΔAR (mean difference = 11.4 days, SEM = 3.6 days; P = .037; 2-way ANOVA with Holm-Sidak correction).
Figure 4.
Figure 4.
Deletion of androgen receptor (AR) from LepRb cells improves estrous cycles of prenatally androgenized (PNA) mice. A, Representative cycles shown for PNA and control groups. Littermate controls are shown side by side. E, estrus; M/D, metestrus/diestrus; P, proestrus. B, Scatter plot graph of average cycle length (mean ± SEM, ARflox vehicle [VEH] n = 7, ARflox PNA n = 8, LepRbΔAR VEH n = 15, LepRbΔAR PNA n = 10). ARflox PNA mice had longer cycle length compared to ARflox VEH (mean difference = 4.4 days, SEM = 1.0 days; P = .001; 2-way analysis of variance [ANOVA] with Holm-Sidak correction). LepRbΔAR PNA mice showed improved cycle length compared to ARflox PNA (mean difference = 3.4 days, SEM = 0.9 days; P = .005; 2-way ANOVA with Holm-Sidak correction). Dotted line indicates cycle length greater than or equal to 14 days between days of estrus. C, Scatter plot graph of average number of cycles completed in 35 days. ARflox PNA mice completed fewer cycles than ARflox VEH (mean difference = 3.1 cycles, SEM = 0.77 cycles; P = .0004; 2-way ANOVA with Holm-Sidak correction). LepRbΔAR PNA mice showed improved number of cycles compared to ARflox PNA and were not different from VEH treated of either genotype (mean difference = 2.4 cycles, SEM = 0.71 cycles; P = .001; 2-way ANOVA with Holm-Sidak correction). D, Scatter plot graph of percentage of days spent in each cycle stage (mean ± SEM of %metestrus/diestrus, %proestrus, and %estrus). ARflox PNA mice spent a greater percentage of days in diestrus and fewer percentage of days in estrus compared to ARflox VEH (%diestrus mean difference = 34%, SEM = 5.2%; P < .0001; %estrus mean difference = 28%, SEM = 5.2%, 2-way ANOVA with Holm-Sidak correction). LepRbΔAR PNA mice showed improvements in percentage of days in diestrus and estrus compared to ARflox PNA (%diestrus mean difference = 16.3%, SEM = 4.8%; P = .0019; %estrus mean difference = 11.8%, SEM = 4.8%; P = .031; 2-way ANOVA with Holm-Sidak correction). Percentage of time spent in proestrus was not significantly different.
Figure 5.
Figure 5.
Ovarian histology and number of follicles. A to D, Images of histologic hematoxylin and eosin–stained sections of ovaries from A, vehicle (VEH) ARflox; B, VEH LepRbΔAR; C, prenatally androgenized (PNA) ARflox; and D, PNA LepRbΔAR mice. CL, corpus luteum. Scale bar = 500 µm. E to H, Scatter plot graph of number of E, primary follicles; F, CL; G, secondary follicles; and H, antral follicles. Data presented as mean ± SEM and analyzed by 2-way analysis of variance with Holm-Sidak correction. Interaction of treatment × genotype was different for primary follicles (E: P = .006; F (1, 23) = 9.163), and effect of treatment was different for CL (F: P = .044; F (1, 23) = 4.52). Pairwise comparisons were not statistically significantly different for any group.
Figure 6.
Figure 6.
Expression of pituitary gland and hypothalamic genes is not different between control and experimental mice. A to I, Scatter plot graphs of gene expression normalized to housekeeping gene β-actin (Actb), and plotted as percentage vehicle (VEH) ARflox. Pituitary A, luteinizing hormone, beta subunit (Lhb); B, follicle-stimulating hormone, beta subunit (Fshb); C, glycoprotein hormones alpha chain (Cga); D, androgen receptor (Ar); E, estrogen receptor α (Esr1); and F, progesterone receptor (Pgr). Hypothalamic G, Nos1; H, Bdnf; and I, Kiss1. Data presented as mean ± SEM and analyzed by 2-way analysis of variance with Holm-Sidak correction.
Figure 7.
Figure 7.
Coexpression of kisspeptin with LepR/AR cells. A to D, Fluorescent images showing colocalization of Kiss1-Cre (eGFP-L10a, green, cytosolic) and AR immunoreactivity (AR-ir, magenta, nuclear) in the anteroventral periventricular (A and B, AVPV) and arcuate (C and D, ARH) nuclei from adult female mice. B and D are larger-magnification images of the highlighted region (square white box in A and C). Solid white arrows indicate Kiss1-Cre cells that coexpress androgen receptor (AR), and arrows with a black center indicate Kiss1-Cre cells that do not coexpress AR. E, Scatter plot graph of percentage of Kiss1-Cre cells that coexpress AR-ir. Rostral AVPV (rAVPV), mean = 10.03%, SEM = 4.4%; caudal AVPV (cAVPV), mean = 15.68%, SEM = 1.32%. Mid/tuberal ARH (mARH), mean = 13.16%, SEM = 4.9%; caudal ARH (cARH), mean = 5.01%, SEM = 2.17%. F to H, fluorescent in situ hybridization signal in the cARH and ventral premammillary (PMv) nuclei showing Kiss1 (F), Ar (G), and Lepr (H) from adult wild-type female mice (n = 4). I to L, Larger-magnification images of coexpression between Kiss1 and Ar (I), Kiss1 and Lepr (J), Lepr and Ar (K), and Kiss1, Ar, and Lepr (L) in the cARH. White arrows indicate cells that express both or all 3 genes. V3, third ventricle, VMH, ventromedial nucleus of the hypothalamus.

Similar articles

Cited by

References

    1. Azziz R, Carmina E, Chen Z, et al. . Polycystic ovary syndrome. Nat Rev Dis Primers. 2016;2(1):16057. - PubMed
    1. Lizneva D, Suturina L, Walker W, Brakta S, Gavrilova-Jordan L, Azziz R. Criteria, prevalence, and phenotypes of polycystic ovary syndrome. Fertil Steril. 2016;106(1):6–15. - PubMed
    1. Rotterdam ESHRE/ASRM-Sponsored PCOS Consensus Workshop Group . Revised 2003 consensus on diagnostic criteria and long-term health risks related to polycystic ovary syndrome (PCOS). Hum Reprod. 2004;19(1):41–47. - PubMed
    1. Dumesic DA, Oberfield SE, Stener-Victorin E, Marshall JC, Laven JS, Legro RS. Scientific statement on the diagnostic criteria, epidemiology, pathophysiology, and molecular genetics of polycystic ovary syndrome. Endocr Rev. 2015;36(5):487–525. - PMC - PubMed
    1. O’Reilly MW, Taylor AE, Crabtree NJ, et al. . Hyperandrogenemia predicts metabolic phenotype in polycystic ovary syndrome: the utility of serum androstenedione. J Clin Endocrinol Metab. 2014;99(3):1027–1036. - PMC - PubMed

Publication types