

Rab21 regulates caveolin-1-mediated endocytic trafficking to promote immature neurite pruning
- PMID: 36683567
- PMCID: PMC9986827
- DOI: 10.15252/embr.202254701
Rab21 regulates caveolin-1-mediated endocytic trafficking to promote immature neurite pruning
Abstract
Transmembrane proteins are internalized by clathrin- and caveolin-dependent endocytosis. Both pathways converge on early endosomes and are thought to share the small GTPase Rab5 as common regulator. In contrast to this notion, we show here that the clathrin- and caveolin-mediated endocytic pathways are differentially regulated. Rab5 and Rab21 localize to distinct populations of early endosomes in cortical neurons and preferentially regulate clathrin- and caveolin-mediated pathways, respectively, suggesting heterogeneity in the early endosomes, rather than a converging point. Suppression of Rab21, but not Rab5, results in decreased plasma membrane localization and total protein levels of caveolin-1, which perturbs immature neurite pruning of cortical neurons, an in vivo-specific step of neuronal maturation. Taken together, our data indicate that clathrin- and caveolin-mediated endocytic pathways run in parallel in early endosomes, which show different molecular regulation and physiological function.
Keywords: Rab21; caveolin-mediated endocytosis; early endosomes; neuronal maturation; neuronal migration.
© 2023 The Authors. Published under the terms of the CC BY 4.0 license.
Figures
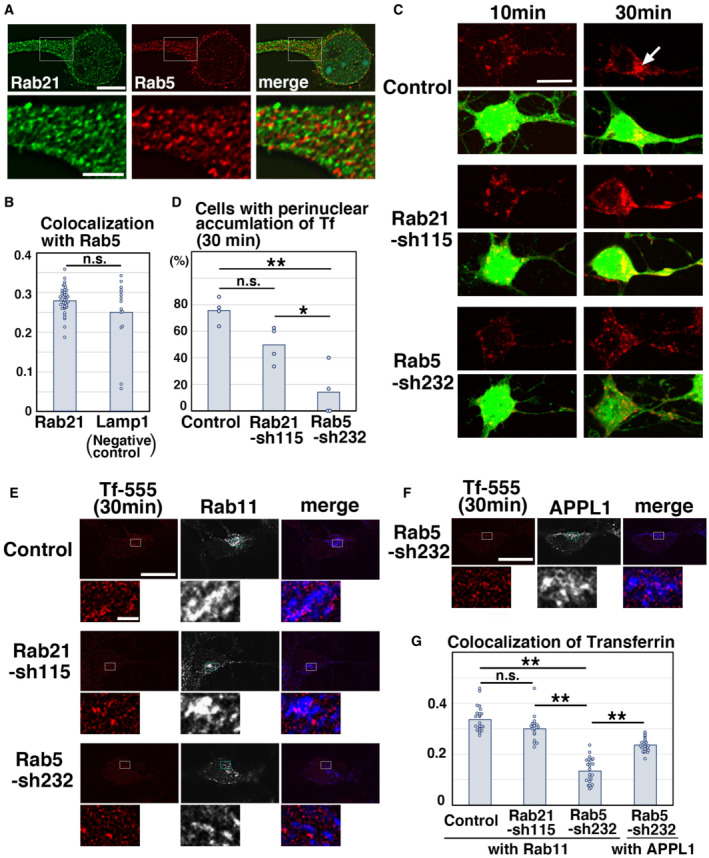
- A, B
Primary cortical neurons from E15 cerebral cortices incubated for 2 days in vitro and stained with the indicated antibodies. Lower panels in (A) are high magnification images indicated by white rectangles in upper panels. The images are obtained with high‐resolution microscopy (Nikon). The graph in (B) shows the Pearson's correlation coefficient of Rab5 and Rab21 or Lamp1 (Lamp1 is a negative control). Each score represents the mean of the individual points. Rab5—Rab21: n = 15 cells, Rab5—Lamp1: n = 37 cells.
- C, D
Primary cortical neurons from E15 cerebral cortices were transfected with the indicated plasmids plus pCAG‐EGFP, incubated for 2 days in vitro and treated with Tf‐594 for 10 or 30 min before fixation (Green: EGFP, Red: Tf‐594). White arrow indicates the perinuclear accumulation of Tf‐594. The graph in (D) shows the ratio of cells with perinuclear accumulation of Tf‐594 at 30 min after the treatment, which was quantified in a blinded counting. Each score represents the mean of ratios with the individual points. Control: n = 4 biological replicates, Rab21‐sh115: n = 4 biological replicates, Rab5‐sh232: n = 4 biological replicates.
- E–G
Primary cortical neurons from E15 cerebral cortices were transfected with the indicated plasmids, incubated for 2 days in vitro and treated with Tf‐555 for 30 min before fixation. Cells were immunostained with the indicated antibodies. The images are obtained with high‐resolution microscopy (Nikon). Blue alone channels are shown in black and white images. Lower panels in (E) and (F) are high magnification images indicated by white or blue rectangles in upper panels. The graph in (G) shows the Pearson's correlation coefficient of Tf‐555 and Rab11 or APPL1. Each score represents the mean with the individual points. Control: n = 23 cells, Rab21‐sh115: n = 18 cells, Rab5‐sh232 (Tf—Rab11): n = 23 cells, Rab5‐sh232 (Tf—APPL1): n = 22 cells.
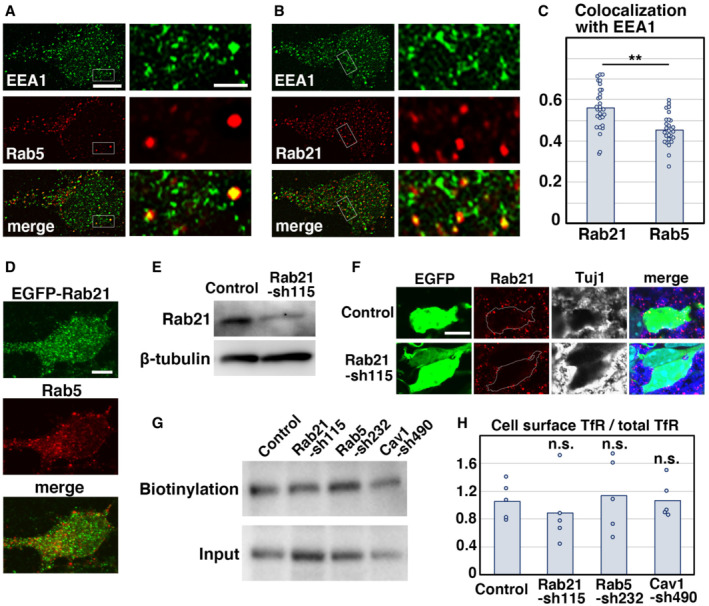
- A–C
Primary cortical neurons from E15 cerebral cortices incubated for 2 days in vitro and stained with the indicated antibodies. Right panels in (A) and (B) are high magnification images indicated by white rectangles. The images are obtained with high‐resolution microscopy (Nikon). The graph in (C) shows the Pearson's correlation coefficient between EEA1 and Rab21 or Rab5. Each score represents the mean of ratios with the individual points. Rab21: n = 29 cells, Rab5: n = 28 cells.
- D
Primary cortical neurons from E15 cerebral cortices were transfected with EGFP‐Rab21 and incubated for 2 days in vitro. To maintain moderate expression levels, a CMV promoter was used to express EGFP‐Rab21. Cells were immunostained with anti‐EGFP (green) and anti‐Rab5 antibodies.
- E
Primary cortical neurons from E15 cerebral cortices were transfected with the indicated plasmids, incubated for 2 days in vitro and subjected to immunoblot analyses of cell lysates with the indicated antibodies.
- F
Immature neurons in the IZ of the cerebral cortices at E17, electroporated with the indicated plasmids plus pCAG‐EGFP at E14. Frozen sections were immunostained with the indicated antibodies. The images are obtained with A1R with a high sensitivity GaAsP detector (Nikon). Blue alone channels are shown in black and white images.
- G, H
Primary cortical neurons from E15 cerebral cortices were transfected with the indicated plasmids, incubated for 2 days in vitro and subjected to cell surface biotinylation assay, followed by immunoblot analyses of cell lysates with anti‐TfR antibody. The upper and lower panels indicate the precipitates with streptavidin‐sepharose beads and lysates before pull down (input), respectively. The graph in (H) shows the ratio of cell surface biotinylated transferrin receptor (TfR) to total TfR. Each score represents the mean with the individual points. Control: n = 5 biological replicates, Rab21‐sh115: n = 5 biological replicates, Rab5‐sh232: n = 5 biological replicates, Cav1‐sh490: n = 5 biological replicates. Significance was determined by one‐way ANOVA with post hoc Dunnett. No significant difference was observed between control and Rab21‐sh115 or Rab5‐sh232 or Cav1‐sh490. n.s., no significant differences.
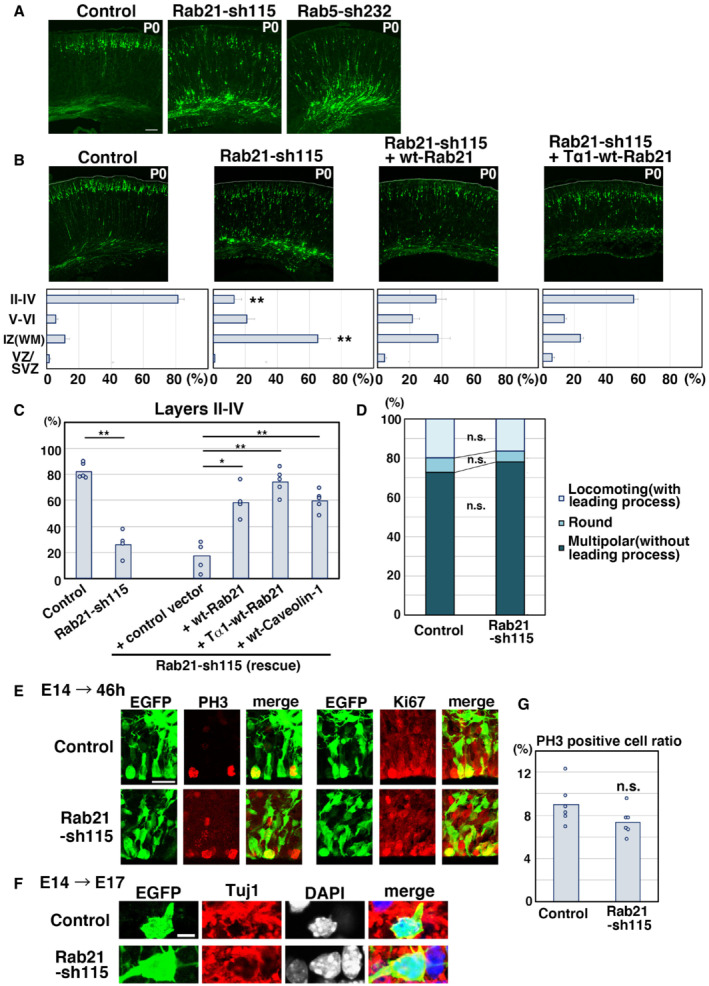
- A, B
Cerebral cortices at P0, electroporated with the indicated plasmids plus pCAG‐EGFP at E14. The lower graphs in (B) show the estimation of cell migration, which was carried out by recording fluorescence intensities of EGFP in distinct regions of the cerebral cortices using Leica SP5 software. Each bar represents the mean percentage of relative intensities ± SEM. Control: n = 6 brains, Rab21‐sh115: n = 5 brains, Rab21‐sh115 + pCAG‐wt‐Rab21: n = 5 brains, Rab21‐sh115 + pTα1‐wt‐Rab21: n = 6 brains. II‐IV, layers II‐IV of the cortical plate; IZ, intermediate zone; SVZ/VZ, subventricular zone/ventricular zone; V‐VI, layers V‐VI of the cortical plate; WM, white matter.
- C
The ratio of the number of the electroporated cells in the upper layers (layers II–IV). Each score represents the mean of ratios with the individual points. Control: n = 5 brains, Rab21‐sh115: n = 4 brains, Rab21‐sh115 + control vector: n = 5 brains, Rab21‐sh115 + CAG‐wt‐Rab21: n = 4 brains, Rab21‐sh115 + Tα1‐wt‐Rab21: n = 5 brains, Rab21‐sh115 + wt‐Caveolin‐1: n = 5 brains. The sample numbers show biological replicates. In case of co‐electroporation with wt‐Rab21 driven by CAG promoter, the Rab21‐sh115‐mediated migration defect was partially rescued, but its efficiency was lower than that of Tα1‐wt‐Rab21, implicating that excess Rab21 in neural progenitors might have a negative effect on proper neuronal positioning.
- D
Cerebral cortices at E17, electroporated with the indicated plasmids plus pCAG‐EGFP at E14. The graph shows the ratio of cells with the indicated morphology in the IZ. Control and Rab21‐sh115: n = 3 brains.
- E–G
Cerebral cortices at E16 (46 h after electroporation) (E and G) and E17 (F), electroporated with the indicated plasmids plus pCAG‐EGFP at E14. Frozen sections were immunostained with anti‐EGFP and anti‐phospho‐Histone H3 (left panels in E) or anti‐Ki67 (right panels in E) or anti‐Tuj1 (F) antibodies. Blue alone channels are shown in black and white images. The graph in (G) shows the ratio of phospho‐Histone H3‐positive cells in the electroporated cells in the VZ. Each score represents the mean of ratios with the individual points. Control: n = 6 brains (762 cells), Rab21‐sh115: n = 6 brains (374 cells).
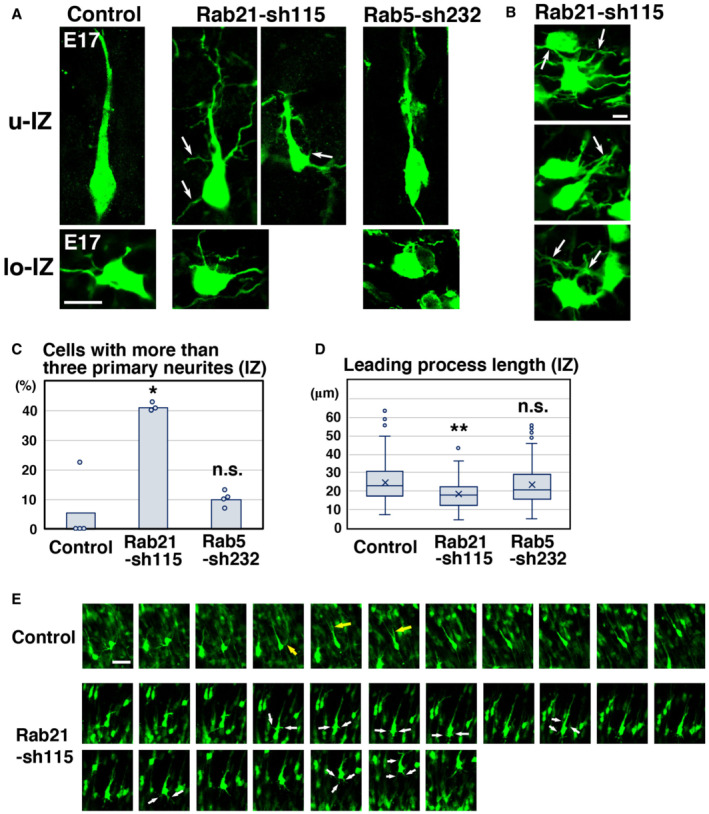
- A–D
Cerebral cortices at E17, electroporated with the indicated plasmids plus pCAG‐EGFP at E14. (A) High magnification images of the upper intermediate zone (u‐IZ) or lower intermediate zone (lo‐IZ) of the cerebral cortices. White arrows indicate abnormal primary neurites. (B) High magnification images of the lower IZ of the cerebral cortices. White arrows indicate sticky neurites. (C) The ratio of locomoting neurons with more than three primary neurites in the IZ. Each score represents the mean with the individual points. Control: n = 4 brains (60 cells), Rab21‐sh115: n = 3 brains (65 cells), Rab5‐sh232: n = 4 brains (111 cells). (D) The box‐and‐whisker plot shows average leading process length of the locomoting neurons in the IZ. Control: n = 100 cells, Rab21‐sh115: n = 80 cells, Rab5‐sh232: n = 111 cells.
- E
Time‐lapse imaging of control and Rab21‐sh115‐electroporated cells in cortical slices from E16 cerebral cortices, electroporated with the indicated plasmids at E14. After formation of the leading process, control neurons rapidly eliminated their immature neurites (yellow arrows), whereas the Rab21‐knockdown neurons retained the immature neurites (white arrows) for long periods. Time interval of each frame is 30 min.
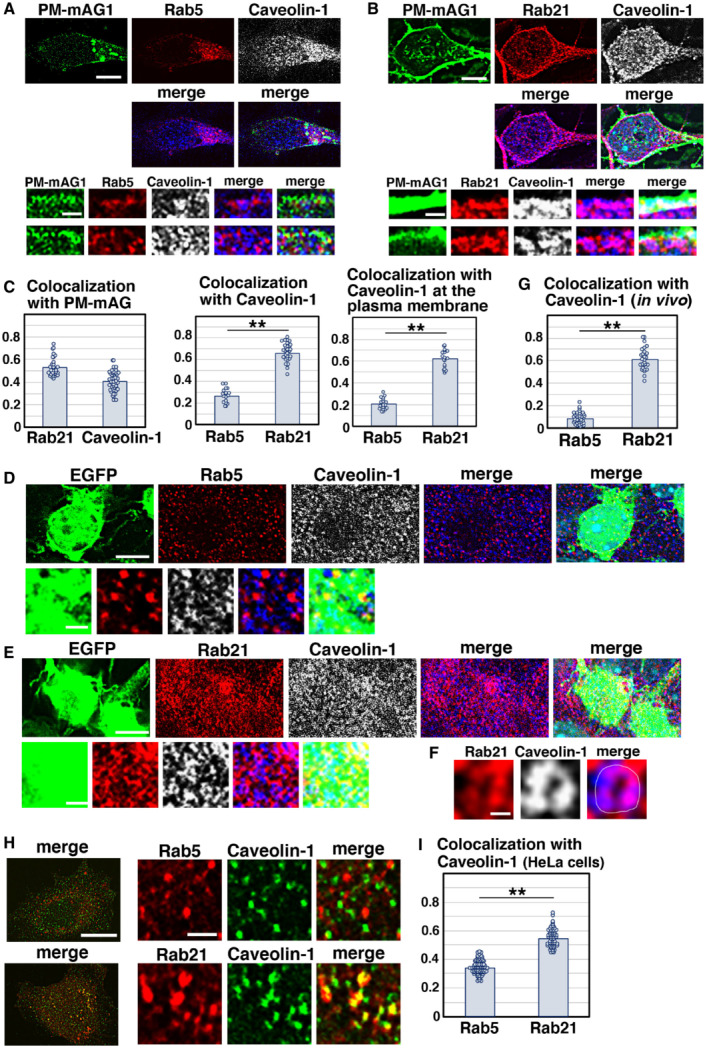
- A–C
Primary cortical neurons from E15 cerebral cortices were transfected with pCAG‐PM‐mAG1 (green) and incubated for 2 days in vitro. Cells were immunostained with the indicated antibodies (red and blue/white). The transfected PM‐mAG1 is a marker for the plasma membrane. The images are obtained with high‐resolution microscopy (Nikon) and the lower panels are high magnification images near the plasma membrane. Blue alone channels are shown in black and white images. The graphs in (C) show the Pearson's correlation coefficient between PM‐mAG1 and Rab21 or Caveolin‐1 (left) and between caveolin‐1 and Rab5 or Rab21 in whole cells (middle) or at the plasma membrane (right). Each score represents the mean of ratios with the individual points. Rab5: n = 18 cells (middle and right), Rab21: n = 31 cells (left and middle) or 20 cells (right), Caveolin‐1: n = 43 cells (left).
- D–G
Immature neurons in the IZ of the cerebral cortices at E17, electroporated with pCAG‐EGFP at E14. Frozen sections were immunostained with the indicated antibodies. The images are obtained with high‐resolution microscopy (Nikon). Blue alone channels are shown in black and white images. The images in (F) are high magnification images of (E). The graph in (G) shows the Pearson's correlation coefficient between caveolin‐1 and Rab5 or Rab21. Each score represents the mean of ratios with the individual points. Rab5: n = 38 cells, Rab21: n = 28 cells.
- H, I
HeLa cells were immunostained with the indicated antibodies. The images are obtained with high‐resolution microscopy (Nikon). The graph in (I) shows the Pearson's correlation coefficient between caveolin‐1 and Rab5 or Rab21. Each score represents the mean of ratios with the individual points. Rab5: n = 80 cells, Rab21: n = 62 cells.
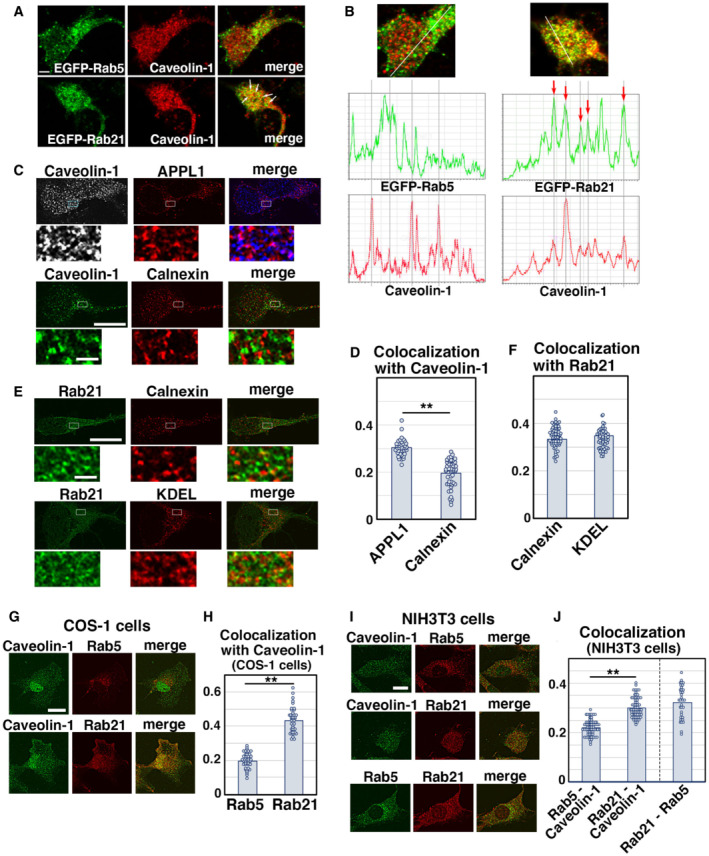
- A, B
Primary cortical neurons from E15 cerebral cortices were transfected with EGFP‐Rab5 (upper panels in A) or EGFP‐Rab21 (lower panels in A) and incubated for 2 days in vitro. To maintain moderate expression levels, CMV promoter was used to express EGFP‐Rab5 and EGFP‐Rab21. Cells were immunostained with anti‐EGFP (green) and anti‐caveolin‐1 (red) antibodies. White arrows in (A) indicate colocalization of EGFP‐Rab21 and caveolin‐1. The images are obtained with TCS‐SP5 (Leica). The graphs in (B) show the estimation of colocalization, which was carried out by recording fluorescence intensities of EGFP‐Rab5 or EGFP‐Rab21 and caveolin‐1 staining signals along the white line in the upper panels using Leica SP5 software. Red arrows indicate the colocalization of these proteins on the same peaks.
- C–F
Primary cortical neurons from E15 cerebral cortices were transfected with the indicated plasmids, incubated for 2 days in vitro and immunostained with the indicated antibodies. Lower panels in (C) and (E) are high magnification images indicated by white and blue rectangles in upper panels. Blue alone channels are shown in black and white images. The graphs in (D) and (F) show the Pearson's correlation coefficient between caveolin‐1 (D) or Rab21 (F) and organelle markers. Each score represents the mean with the individual points. Caveolin‐1—APPL1: n = 38 cells, Caveolin‐1—calnexin: n = 51 cells, Rab21—calnexin: n = 59 cells, Rab21—KDEL: n = 51 cells.
- G–J
NIH3T3 or COS‐1 cells were immunostained with the indicated antibodies. The images are obtained with high‐resolution microscopy (Nikon). The graphs in (H) and (J) show the Pearson's correlation coefficient between caveolin‐1 and Rab5 or Rab21 or between Rab21 and Rab5. Each score represents the mean with the individual points. Caveolin‐1—Rab21: n = 41 cells (H) or 63 cells (J), Caveolin‐1—Rab5: n = 63 cells (H) or 69 cells (J), Rab21—Rab5: 34 cells.
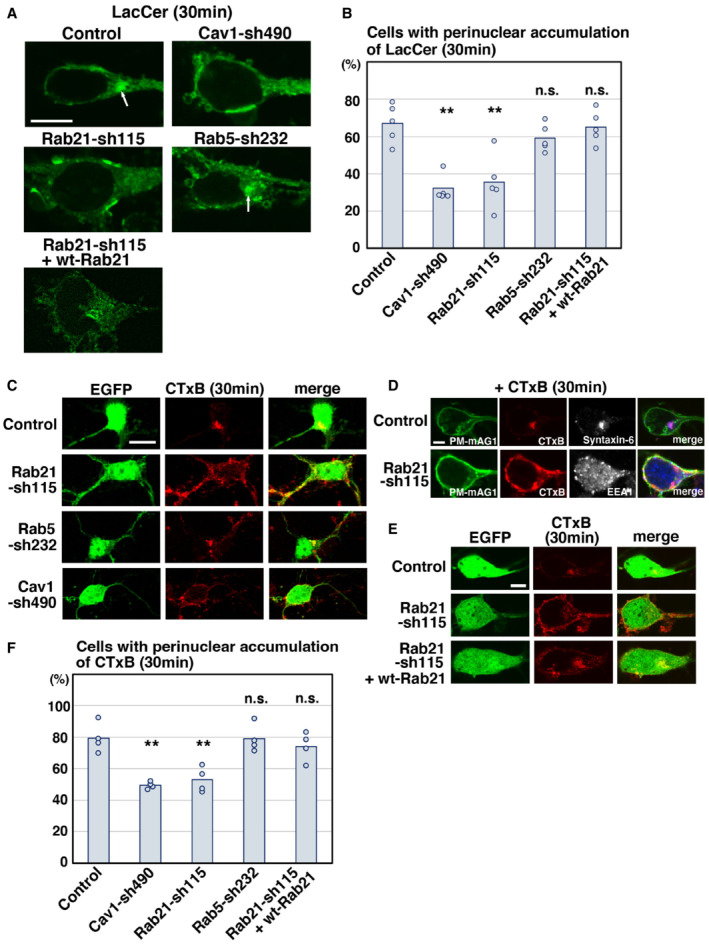
- A–F
Primary cortical neurons from E15 cerebral cortices were transfected with the indicated plasmids plus pCAG‐EGFP (C and E) or pCAG‐PM‐mAG1 (D), incubated for 2 days in vitro and treated with BODIPY‐LacCer (LacCer) (green) (A, B) or Alexa555‐conjugated Cholera Toxin Subunit B (CTxB) (red) (C–F) for 30 min before fixation. White arrows in (A) indicate the perinuclear accumulation of LacCer. Blue alone channels are shown in black and white images. The graphs in (B) and (F) show the ratio of cells with perinuclear accumulation of LacCer (B) or CTxB (F), which was quantified in a blinded counting. Each score represents the mean with the individual points. (B) n = 5 biological replicates (Control: 115 cells, Cav1‐sh490: 127 cells, Rab21‐sh115: 136 cells, Rab5‐sh232: 216 cells, Rab21‐sh115 + wt‐Rab21: 132 cells), (F) n = 4 biological replicates (Control: 64 cells, Cav1‐sh490: 128 cells, Rab21‐sh115: 130 cells, Rab5‐sh232: 56 cells, Rab21‐sh115 + wt‐Rab21: 58 cells).
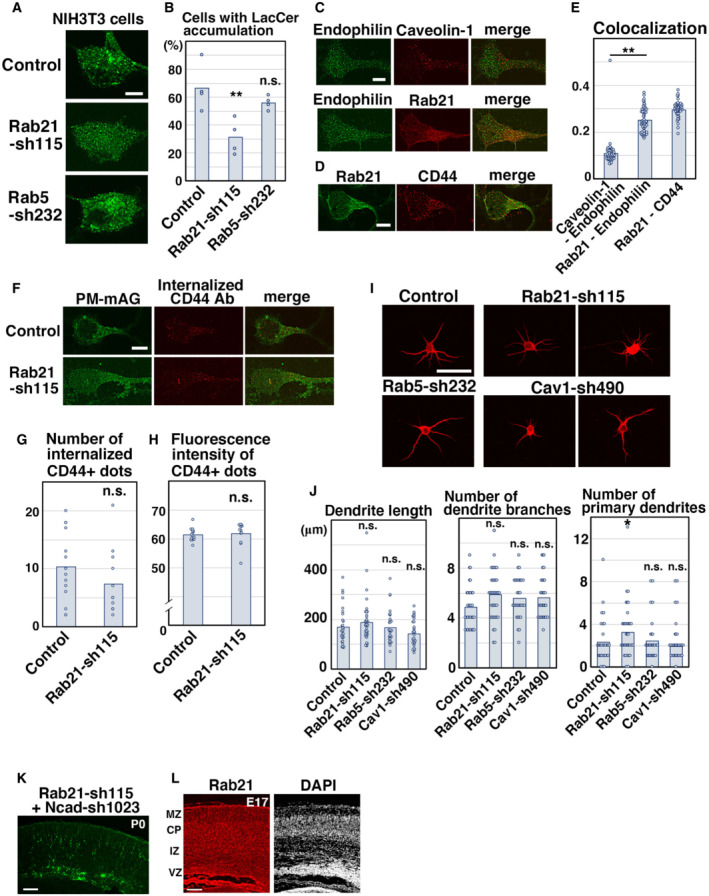
- A, B
NIH3T3 fibroblasts were transfected with the indicated plasmids and treated with BODIPY‐LacCer (LacCer) for 30 min before fixation. The images are obtained with high‐resolution microscopy (Nikon). The graph in (B) shows the ratio of cells with perinuclear accumulation of LacCer. Each score represents the mean with the individual points. Control: n = 4 biological replicates, Rab21‐sh115: n = 4 biological replicates, Rab5‐sh232: n = 4 biological replicates.
- C–E
Primary cortical neurons from E15 cerebral cortices were incubated for 2 days in vitro and immunostained with the indicated antibodies. The images are obtained with high‐resolution microscopy (Nikon). The graph in (E) shows the Pearson's correlation coefficient between Endophilin and Rab21 or caveolin‐1 or between Rab21 and CD44. Each score represents the mean with the individual points. Caveolin‐1—Endophilin: n = 43 cells, Rab21—Endophilin: n = 53 cells, Rab21—CD44: n = 45 cells.
- F–H
Primary cortical neurons from E15 cerebral cortices were transfected with the indicated plasmids plus pCAG‐PM‐mAG1, incubated for 2 days in vitro and subjected to CD44 antibody feeding assay. The graphs in (G) and (H) show the number of the internalized CD44‐positive dots and its total fluorescence intensity per cell. Each score represents the mean with the individual points. Control: n = 15 cells (G and H), Rab21‐sh115: n = 12 cells (G and H).
- I, J
Primary cortical neurons from E15 cerebral cortices were transfected with the indicated plasmids plus pCAG‐EGFP, incubated for 8 days in vitro and stained with MAP2ab, a marker for dendrites. The graphs in (J) show the dendrite length, dendrite branch number and the number of primary dendrites. Each score represents the mean with the individual points. Control: n = 31 cells, Rab21‐sh115: n = 38 cells, Rab5‐sh232: n = 31 cells, Cav1‐sh490: n = 31 cells.
- K
Cerebral cortex at P0, electroporated with the indicated plasmids plus pCAG‐EGFP at E14.
- L
Frozen sections of E17 cerebral cortex immunostained with anti‐Rab21 antibody and DAPI.
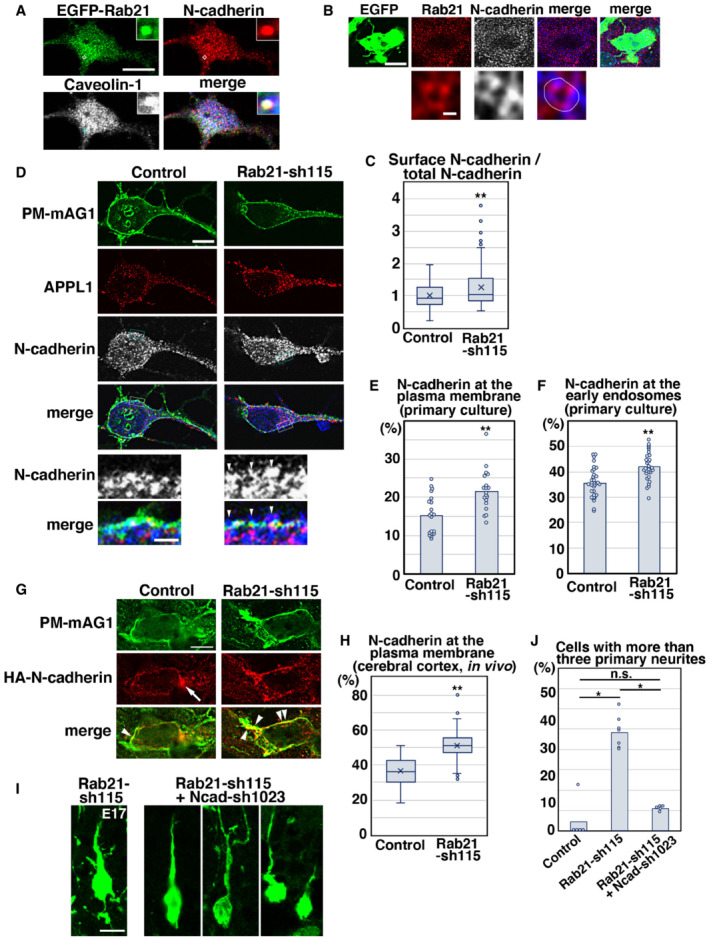
- A
Primary cortical neurons from E15 cerebral cortices transfected with pCMV‐EGFP‐Rab21, incubated for 2 days in vitro and stained with the indicated antibodies. Blue alone channels are shown in black and white images. Insets are high magnification images indicated by white or blue rectangles.
- B
Immature neurons in the IZ of the cerebral cortices at E17, electroporated with pCAG‐EGFP at E14. Frozen sections were immunostained with the indicated antibodies. The images are obtained with high‐resolution microscopy (Nikon). Blue alone channels are shown in black and white images. The lower panels are high magnification images. Rab21 and N‐cadherin were sometimes present on the same vesicular compartments.
- C
The box‐and‐whisker plot shows the ratio of cell surface to total N‐cadherin in primary cortical neurons (2 days in vitro). Control: n = 85 cells from 3 biological replicates, Rab21‐sh115: n = 143 cells from three biological replicates.
- D–F
Primary cortical neurons from E15 cerebral cortices were transfected with pCAG‐PM‐mAG1, incubated for 2 days in vitro and stained with the indicated antibodies. Blue alone channels are shown in black and white images. Arrowheads indicate accumulation of N‐cadherin at the plasma membrane. Lower panels in (D) are high magnification images indicated by white or blue rectangles. The images are obtained with high‐resolution microscopy (Nikon). The graphs show the ratios of the N‐cadherin staining signals in the plasma membrane (E) and the APPL1‐positive early endosomes (F) to total fluorescence intensities of N‐cadherin in each primary cortical neuron. Each score represents the mean of ratios with the individual points. Control: n = 20 cells (E) or 33 cells (F), Rab21‐sh115: n = 19 cells (E) or 30 cells (F).
- G, H
Immature neurons in the IZ of the cerebral cortices at E17, electroporated with the indicated plasmids plus pCAG‐PM‐mAG1 and pCAG‐HA‐N‐cadherin at E14. Frozen sections were immunostained with anti‐mAG1 and anti‐HA antibodies. Arrow and arrowheads indicate the accumulation of HA‐N‐cadherin at the perinuclear regions or the plasma membrane, respectively. The box‐and‐whisker plot shows the ratio of the HA‐N‐cadherin staining signals in the plasma membrane to total fluorescence intensities of HA‐N‐cadherin in each immature neuron in vivo. Control: n = 77 cells from three biological replicates, Rab21‐sh115: n = 108 cells from three biological replicates.
- I
Locomoting neurons in the upper IZ of the cerebral cortices at E17, electroporated with the indicated plasmids plus pCAG‐EGFP at E14.
- J
The ratio of locomoting neurons with more than three primary neurites in the IZ. Each score represents the mean of ratios with the individual points. Control: n = 5 brains, Rab21‐sh115: n = 7 brains, Rab21‐sh115 + Ncad‐sh1023: n = 5 brains.
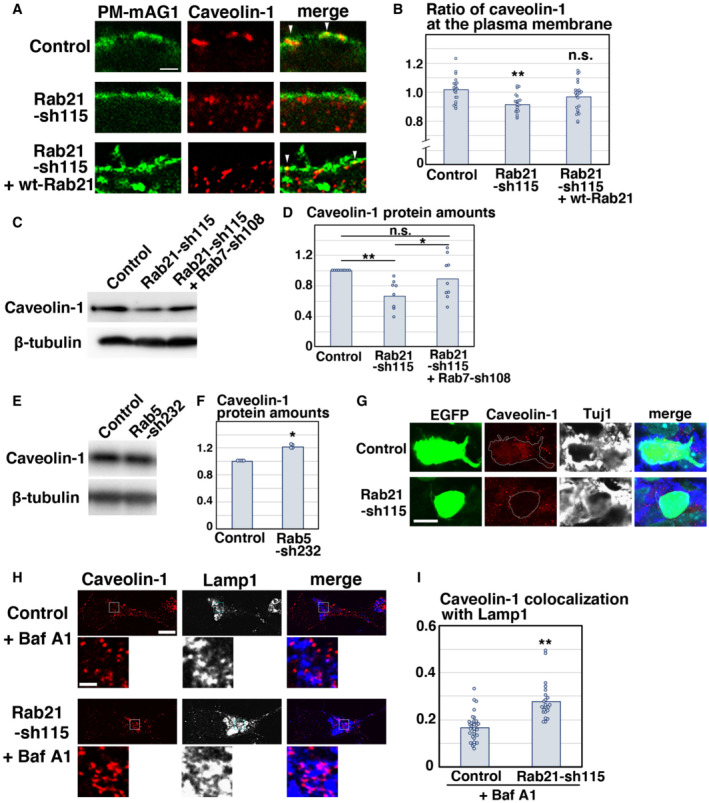
- A, B
Primary cortical neurons from E15 cerebral cortices were transfected with the indicated plasmids plus pCAG‐PM‐mAG1 (green) and incubated for 2 days in vitro. Immunocytochemical analyses with anti‐caveolin‐1 (red) antibody were performed. The images are obtained with high‐resolution microscopy (Nikon). The graph in (B) indicates the ratio of the caveolin‐1 staining signals in the plasma membrane to total fluorescence intensities of caveolin‐1 in each immature neuron. Each score represents the mean of ratios with the individual points. Control: n = 20 cells, Rab21‐sh115: n = 22 cells, Rab21‐sh115 + pCMV‐wt‐Rab21: n = 23 cells. Overexpression of wt‐Rab21 resulted in neuronal cell death, which making it difficult to determine the accurate DNA concentration of pCMV‐wt‐Rab21 in the rescue experiments.
- C–F
Primary cortical neurons from E15 cerebral cortices were transfected with the indicated plasmids and incubated for 2 days in vitro. Immunoblot analyses of cell lysates with the indicated antibodies were performed. The graphs in (D) and (F) indicate the mean ratios of immunoblot band intensities of caveolin‐1/β‐tubulin with the individual points.
- G
Immature neurons in the IZ of the cerebral cortices at E17, electroporated with the indicated plasmids plus pCAG‐EGFP at E14. Frozen sections were immunostained with the indicated antibodies. Blue alone channels are shown in black and white images.
- H, I
Primary cortical neurons from E15 cerebral cortices were transfected with the indicated plasmids, incubated for 2 days in vitro, treated with Bafilomycin A1 (Baf A1) for 6 h and stained with the indicated antibodies. The images are obtained with high‐resolution microscopy (Nikon) and the lower panels are high magnification images of the lysosomes, indicated by white or blue rectangles. Blue alone channels are shown in black and white images. The graph in (I) shows the Pearson's correlation coefficient between caveolin‐1 and Lamp1, a lysosomal marker, in control and Rab21‐sh115‐transfected neurons. Each score represents the mean of ratios with the individual points. Control: n = 31 cells, Rab21‐sh115: n = 22 cells.
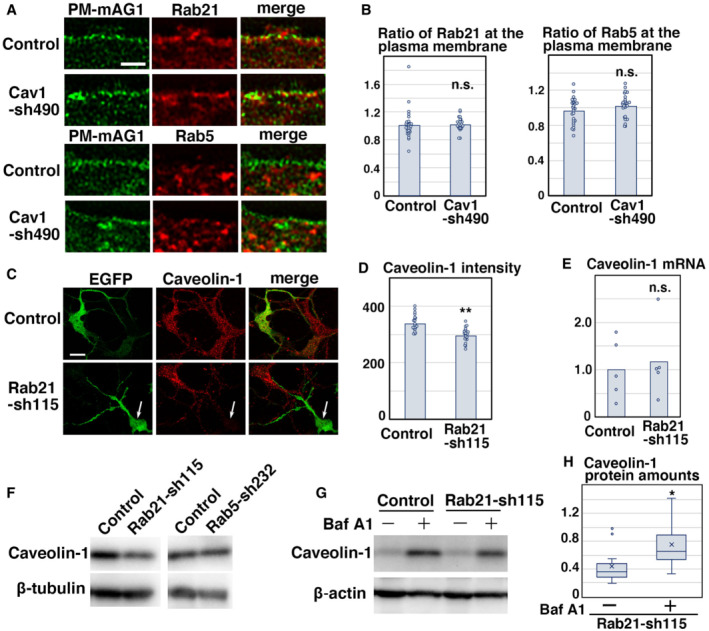
- A, B
Primary cortical neurons from E15 cerebral cortices were transfected with the indicated plasmids plus pCAG‐PM‐mAG1 (green) and incubated for 2 days in vitro. Immunocytochemical analyses with anti‐Rab21 or anti‐Rab5 antibody (red) were performed. The graphs in (B) indicate the ratio of the Rab21 or Rab5 staining signals in the plasma membrane to total fluorescence intensities in each immature neuron. Each score represents the mean with the individual points. Control: n = 29 cells (left, Rab21) or 27 cells (right, Rab5), Cav1‐sh490: n = 24 cells (left, Rab21) or 25 cells (right, Rab5).
- C, D
Primary cortical neurons from E15 cerebral cortices transfected with the indicated plasmids plus pCAG‐EGFP and incubated for 2 days in vitro. Immunocytochemical analyses with anti‐EGFP (green) and anti‐caveolin‐1 (red) antibodies (C, D) and quantitative PCR (E) were performed. White arrows in (C) indicate the Rab21‐knockdown neurons with decreased caveolin‐1 signals. The graph in (D) shows the fluorescence intensity of caveolin‐1 per cell. Each score represents the mean with the individual points. Control: n = 21 cells, Rab21‐sh115: n = 22 cells. Each score in (E) represents the ratio with the individual points.
- F
Primary cortical neurons from E15 cerebral cortices transfected with the indicated plasmids and incubated for 5 days in vitro (DIV). Immunoblot analyses of cell lysates with the indicated antibodies were performed. Long‐term culture (5 DIV) did not affect the protein levels of caveolin‐1 in the Rab5‐sh232‐transfected cortical neurons, similar to the 2 DIV neurons (Fig 6E), whereas the reduced caveolin‐1 protein levels were still observed in the Rab21‐sh115‐transfected neurons at 5 DIV.
- G, H
Primary cortical neurons from E15 cerebral cortices transfected with the indicated plasmids, incubated for 1 DIV and treated with 160 nM Bafilomycin A1 (Baf A1) for 22 h. Immunoblot analyses of the cell lysates with the indicated antibodies were performed. The box‐and‐whisker plot in (H) shows the ratios of immunoblot band intensities of caveolin‐1/beta‐actin. Baf A1−: n = 11 biological replicates, Baf A1+: n = 10 biological replicates.
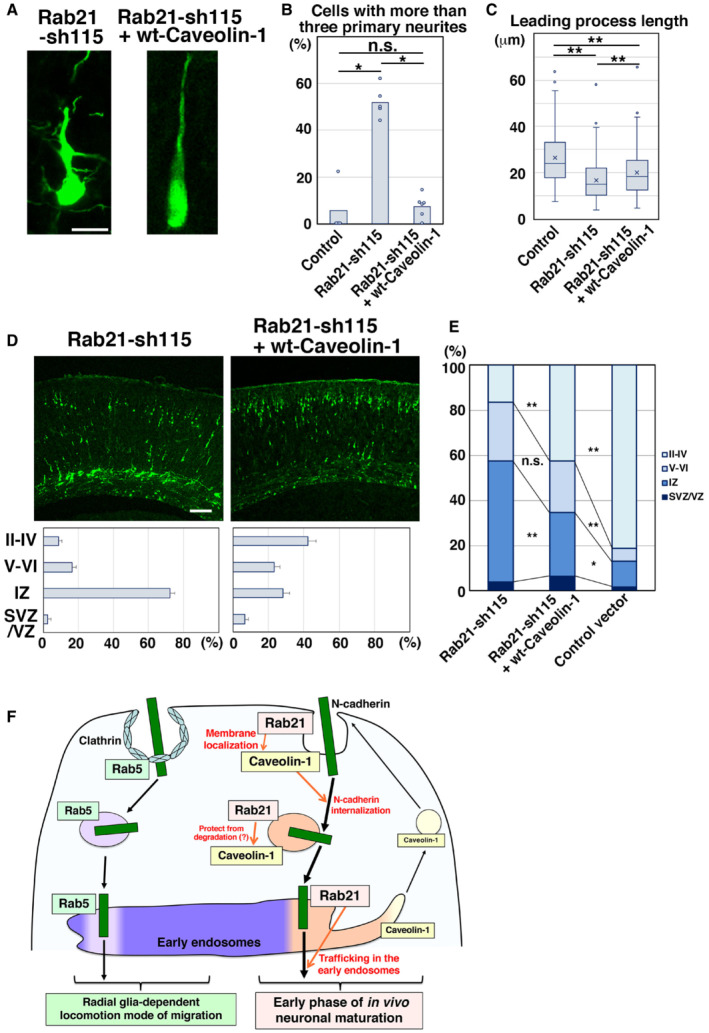
- A
Locomoting neurons in the upper IZ of the cerebral cortices at E17, electroporated with the indicated plasmids plus pCAG‐EGFP at E14.
- B
The ratio of locomoting neurons with more than three primary neurites. Each score represents the mean of ratios with the individual points. Control: n = 4 brains, Rab21‐sh115: n = 5 brains, Rab21‐sh115 + pCAG‐wt‐Caveolin‐1: n = 6 brains.
- C
The box‐and‐whisker plot shows average leading process length of the locomoting neurons in the IZ. Control: n = 115 cells, Rab21‐sh115: n = 188 cells, Rab21‐sh115 + Caveolin‐1: n = 185 cells.
- D, E
Cerebral cortices at P0, electroporated with the indicated plasmids plus pCAG‐EGFP at E14. The lower graphs in (D) and the graph in (E) show the estimation of cell migration, as measured by EGFP fluorescence intensities in distinct regions of the cerebral cortices using Leica SP5 software. Each bar in the graph in (E) represents the mean percentage of relative intensities. Rab21‐sh115: n = 4 brains, Rab21‐sh115 + pCAG‐wt‐Caveolin‐1: n = 6 brains. II‐IV: layers II‐IV of the cortical plate, V‐VI: layers V‐VI of the cortical plate, IZ: intermediate zone, WM: white matter, SVZ/VZ: subventricular zone/ventricular zone.
- F
Rab5 and Rab21, members of the same subfamily, mainly regulate distinct endocytic pathways, clathrin‐mediated and caveolin‐1‐mediated, respectively, and different steps of neuronal maturation and migration. While Rab5 is required for the locomotion mode of neuronal migration (Kawauchi et al, 2010), our present study indicates that Rab21 and caveolin‐1 cooperatively regulate immature neurite pruning and leading process elongation. Rab21 promotes the membrane localization of caveolin‐1 and maintains the caveolin‐1 protein levels, which is required for immature neurite pruning via the enhanced internalization of N‐cadherin. Rab21 also has caveolin‐1‐independent functions in the trafficking in early endosomes.
Similar articles
-
Internalization of the TGF-β type I receptor into caveolin-1 and EEA1 double-positive early endosomes.Cell Res. 2015 Jun;25(6):738-52. doi: 10.1038/cr.2015.60. Epub 2015 May 22. Cell Res. 2015. PMID: 25998683 Free PMC article.
-
Entry of Classical Swine Fever Virus into PK-15 Cells via a pH-, Dynamin-, and Cholesterol-Dependent, Clathrin-Mediated Endocytic Pathway That Requires Rab5 and Rab7.J Virol. 2016 Sep 29;90(20):9194-208. doi: 10.1128/JVI.00688-16. Print 2016 Oct 15. J Virol. 2016. PMID: 27489278 Free PMC article.
-
Endocytosis and transcytosis in growing astrocytes in primary culture. Possible implications in neural development.Int J Dev Biol. 2000 Feb;44(2):209-21. Int J Dev Biol. 2000. PMID: 10794079
-
Endocytosis and signaling cascades: a close encounter.FEBS Lett. 2001 Jun 8;498(2-3):190-6. doi: 10.1016/s0014-5793(01)02484-x. FEBS Lett. 2001. PMID: 11412855 Review.
-
Molecular mechanisms of clathrin-independent endocytosis.J Cell Sci. 2009 Jun 1;122(Pt 11):1713-21. doi: 10.1242/jcs.033951. J Cell Sci. 2009. PMID: 19461071 Free PMC article. Review.
Cited by
-
Vesicular Trafficking, a Mechanism Controlled by Cascade Activation of Rab Proteins: Focus on Rab27.Biology (Basel). 2023 Dec 15;12(12):1530. doi: 10.3390/biology12121530. Biology (Basel). 2023. PMID: 38132356 Free PMC article. Review.
-
Immunocytochemistry of Primary Cultured Cerebral Cortical Neurons.Methods Mol Biol. 2024;2794:177-186. doi: 10.1007/978-1-0716-3810-1_15. Methods Mol Biol. 2024. PMID: 38630229
-
The Regulatory Mechanism of Rab21 in Human Diseases.Mol Neurobiol. 2023 Oct;60(10):5944-5953. doi: 10.1007/s12035-023-03454-0. Epub 2023 Jun 28. Mol Neurobiol. 2023. PMID: 37369821 Review.
-
Membrane remodeling by FAM92A1 during brain development regulates neuronal morphology, synaptic function, and cognition.Nat Commun. 2024 Jul 23;15(1):6209. doi: 10.1038/s41467-024-50565-w. Nat Commun. 2024. PMID: 39043703 Free PMC article.
-
Rab21 recruits EEA1 and competes with Rab5 for Rabex-5 activation.Front Cell Dev Biol. 2025 May 30;13:1588308. doi: 10.3389/fcell.2025.1588308. eCollection 2025. Front Cell Dev Biol. 2025. PMID: 40519268 Free PMC article.
References
-
- Ariotti N, Parton RG (2013) SnapShot: caveolae, caveolins, and cavins. Cell 154: 704–704.e1 - PubMed
-
- Boucrot E, Ferreira AP, Almeida‐Souza L, Debard S, Vallis Y, Howard G, Bertot L, Sauvonnet N, McMahon HT (2015) Endophilin marks and controls a clathrin‐independent endocytic pathway. Nature 517: 460–465 - PubMed
Publication types
MeSH terms
Substances
LinkOut - more resources
Full Text Sources
Molecular Biology Databases
