. 2023 Jan 4:12:1005318.
doi: 10.3389/fcimb.2022.1005318. eCollection 2022.

Effects of Zhishi Daozhi Decoction on the intestinal flora of nonalcoholic fatty liver disease mice induced by a high-fat diet

Affiliations

Effects of Zhishi Daozhi Decoction on the intestinal flora of nonalcoholic fatty liver disease mice induced by a high-fat diet

Chao-Ran Bi et al. Front Cell Infect Microbiol. .

Abstract

Background and aims: Nonalcoholic fatty liver disease (NAFLD) is the most common type of chronic liver disease with a high incidence, and the situation is not optimistic. Intestinal flora imbalance is strongly correlated with NAFLD pathogenesis. Zhishi Daozhi Decoction (ZDD) is a water decoction of the herbs used in the classical Chinese medicine prescription Zhishi Daozhi Pills. Zhishi Daozhi Pills has shown promising hepatoprotective and hypolipidemic properties, but its specific mechanism remains unclear.

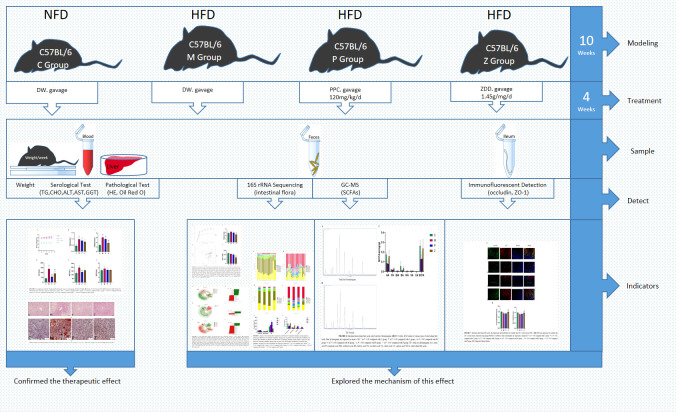
Methods: Mice were fed on a high fat-rich diet (HFD) for ten weeks, and then the animals were administrated ZDD through oral gavage for four weeks. The serum liver function and blood lipid indexes of the mice were then tested using an automatic biochemical analyzer. H&E and Oil Red O staining were used to observe the pathological conditions of mice liver tissue, and 16S rRNA sequencing technology was used to analyze the changes in intestinal flora of mice. The concentration of short-chain fatty acids (SCFAs) in the gut of mice was analyzed by gas chromatography-mass spectrometry (GC-MS). The expression of tight junction (TJ) proteins between ileal mucosal epithelial cells was analyzed using the immunofluorescence technique.

Results: ZDD was found to reduce the bodyweight of NAFLD mice, reduce serum TG, CHO, ALT, and AST levels, reduce fat accumulation in liver tissue, make the structure of intestinal flora comparable to the control group, and increase the concentration of intestinal SCFAs. It was also found to increase the expression of TJ proteins such as occludin and ZO-1, making them comparable to the control group.

Conclusions: ZDD has a therapeutic effect on NAFLD mice induced by HFD, which may act by optimizing the intestinal flora structure.

Keywords: Zhishi Daozhi Decoction; high-fat diet; intestinal flora; nonalcoholic fatty liver disease; traditional Chinese medicine.


Conflict of interest statement

The authors declare that the research was conducted in the absence of any commercial or financial relationships that could be construed as a potential conflict of interest. The reviewer GJ declared a shared affiliation with the authors CRB, JTS, JD, YJLi, XYJ, YL, WPZ, YJLiu to the handling editor at the time of review.

Figures

Figure 1
Figure 1
Comparison of Body Weight and Biochemical Assays in each group. (A) Body Weight. (B) Serum TG. (C) Serum CHO. (D) Serum ALT. (E) Serum AST. (F) Serum GGT. The above data are expressed as mean ±SD. * is P<0.05 compared with C group; ** is P<0.01 compared with C group; # is P<0.05 compared with M group; ## is P<0.01 compared with M group; ^ is P<0.05 compared with P group; ^^ is P<0.01 compared with P group.
Figure 2
Figure 2
Comparison of Histopathological Examination in each group. (A) H&E staining of mice liver tissue (light microscope 200 ×). (B) Oil red O staining of mice liver tissue (light microscope 200 ×).
Figure 3
Figure 3
Intestinal flora diversity analysis. (A) Rarefaction Curve. The abscissa is the number of sequencing strips randomly selected from a sample, and the ordinate is the number of OTUs that can be constructed based on the number of sequencing strips used to reflect the sequencing depth. Curves with different colors represent different samples. (B) PCOA chart. The abscissa and ordinate axes are the two selected principal axes. The percentages indicate the degree of interpretation of the differences in the composition of samples by the principal coordinates. The scales on the two principal axes are relative distances, which have no practical significance: samples in different groups are distinguished by their respective colors, and the closer the point-to-point distance between samples is, the more similar the flora composition between samples is. (C) Chao 1 Index indicates community richness. (D) Shannon Index shows community diversity. Data in histograms are expressed as Mean+SD. * is P<0.05 compared with C group: ** is P<0.01 compared with C group: # is P<0.05 compared with M group: ## is P<0.01 compared with M group: ^ is P<0.05 compared with P group: ^^is P<0.01 compared with P group.
Figure 4
Figure 4
Analysis of the intestinal flora composition. (A) Percent of community abundance among sample on phylum level. (B) Percent of community abundance among groups on phylum level. (C) Histogram of differences in intestinal flora abundance on phylum level. (D) Percent of community abundance among sample on genus level. (E) Percent of community abundance among groups on genus level. (F) Histogram of differences in intestinal flora abundance on genus level. Data in histograms are expressed as mean+SD. * is P<0.05 compared with C group; ** is P<0.01 compared with C group: # is P<0.05 compared with M group; ## is P<0.01 compared with M group: ^ is P<0.05 compared with P group: ^^ is P<0.01 compared with P group.
Figure 5
Figure 5
LEfSe differential analysis of intestinal flora. (A) Cladogram between C and M groups. (B) Cladogram between M and P groups. (C) Cladogram between M and Z groups. The order of the circles radiating from the inside to the outside in the cladogram is for each level (kingdom, phylum, class, order, family, genus, and species). The size of the diameter represents the size of the relative abundance. If the color in the small circle is yellow, it means that there is no significant difference in the level of bacteria; if the color is the color of the group, it means the bacteria with a significant difference in the group, and the corresponding flora name is displayed on the right side. The letter number corresponds to the figure. (D) LDA value histogram between C and M groups. (E) LDA value histogram between M and P groups. (F) LDA value histogram between M and Z groups. The color of the histogram in the LDA value histogram represents the group. The length represents the LDA score, i.e., the degree of influence of bacteria (groups) with significant differences between groups.
Figure 6
Figure 6
Intestinal short-chain fatty acids. (A) Total Ion Chromatogram. (B) TIC Overlay. (C) Content of various types of short-chain fatty acids. Data in histograms are expressed as mean ±SD. * is P < 0.05 compared with C group; ** is P < 0.01 compared with C group; # is P < 0.05 compared with M group; ## is P < 0.01 compared with M group; ^ is P < 0.05 compared with P group; ^^ is P < 0.01 compared with P group. TIC, total ion chromatogram; AA, acetic acid; PA, propionic acid; IBA, isobutyric acid; BA, butyric acid; IVA, isovaleric acid; VA, valeric acid; CA, caproic acid; SCFAs, short-chain fatty acids.
Figure 7
Figure 7
Intestinal short-chain fatty acids. (A) Expression and distribution of occludin and ZO-1 in ileal tissue (400x). (B) IOD/Area expression of occludin and ZO-1 in ileal tissue (Analyzed using Image-ProPlus 6.0 software). Data in histograms are expressed as mean+SD. * is P < 0.05 compared with C group; ** is P< 0.01 compared with C group; # is P< 0.05 compared with M group; ## is P < 0.01 compared with M group; ^ is P < 0.05 compared with P group; ^^is P < 0.01 compared with P group. IOD, Integrated Optical Density.
Figure 8
Figure 8
Experimental design diagram.
Figure 9
Figure 9
The mechanism of the ZDD's therapeutic effect for NAFLD based on intestinal flora.

References

    1. Albillos A., de Gottardi A., Rescigno M. (2020). The gut-liver axis in liver disease: Pathophysiological basis for therapy. J. Hepatology 72, 558–577. doi: 10.1016/j.jhep.2019.10.003 - DOI - PubMed
    1. Aron-Wisnewsky J., Vigliotti C., Witjes J., Le P., Holleboom A. G., Verheij J., et al. (2020). Gut microbiota and human NAFLD: disentangling microbial signatures from metabolic disorders. Nat. Rev. Gastroenterol. Hepatol 17, 279–297. doi: 10.1038/s41575-020-0269-9 - DOI - PubMed
    1. Barcenilla A., Pryde S. E., Martin J. C., Duncan S. H., Stewart C. S., Henderson C., et al. (2000). Phylogenetic relationships of butyrate-producing bacteria from the human gut. Appl. Environ. Microbiol 66, 1654–61. doi: 10.1128/aem.66.4.1654-1661.2000 - DOI - PMC - PubMed
    1. Blaut M. (2014). Gut microbiota and energy balance: Role in obesity. Proc. Nutr. Soc 74, 227–34. doi: 10.1017/s0029665114001700 - DOI - PubMed
    1. Bokulich N. A., Subramanian S., Faith J. J., Gevers D., Gordon J. I., Knight R., et al. (2012). Quality-filtering vastly improves diversity estimates from illumina amplicon sequencing. Nat. Methods 10, 57–9. doi: 10.1038/nmeth.2276 - DOI - PMC - PubMed

Publication types

MeSH terms