. 2022 Dec 5:10:rbac097.
doi: 10.1093/rb/rbac097. eCollection 2023.

Locally controlled release of immunosuppressive promotes survival of transplanted adult spinal cord tissue

Affiliations

Locally controlled release of immunosuppressive promotes survival of transplanted adult spinal cord tissue

Ziqiang Wang et al. Regen Biomater. .

Abstract

Transplantation of adult spinal cord tissue (aSCT) is a promising treatment for spinal cord injury (SCI) basing on various types of neural cells and matrix components inside aSCT. However, long-term systemic administration of immunosuppressors (e.g. tacrolimus, TAC) is required for the survival of allogeneic tissue, which often associated with severe side effects such as infection, liver damageand renal failure. In this study, a triglycerol monostearate (TGM)-based TAC delivery system (e.g. TAC@TGM) with high drug loading concentration was developed, which possessed injectable properties as well as sustainable and immune-responsive drug release behaviors. In complete transected SCI model, locally injected TAC@TGM could reduce the infiltration of inflammation cells, enhance the survival of transplanted aSCT (e.g. Tuj-1+ and NF+ neurons) and promote the recovery of locomotor function. Moreover, controlled release of TAC by TAC@TGM attenuated side effects of TAC on liver and kidneys compared with traditional systemic administration. More importantly, the developed TAC@TGM system provided a facile single dose of long-term immunosuppressive effect not just for aSCT transplantation, but also for other tissue/organ and cell transplantations.

Keywords: adult spinal cord tissue transplantation; controlled release; immune rejection; spinal cord injury; tacrolimus.


Figures

None
Graphical abstract
Figure 1.
Figure 1.
The preparation and characterization of TAC@TGM. (a) Schematic diagram of preparing TAC@TGM. First step: TAC and TGM were completely dissolved in absolute ethanol, and a condensate of TAC@TGM was obtained after drying; second step: the condensate of TAC@TGM was blended with water to obtain the injectable TAC@TGM. (bd) The viscosity of TAC@TGM was measured at the indicated temperatures, times and frequencies. (e) Injection of TAC@TGM from a syringe. (f, g) Scanning electron microscopy images of TAC@TGM. Scale bar, 100 μm (f) and 10 μm (g).
Figure 2.
Figure 2.
Inflammatory responsive drug release in vitro and cytocompatibility. (a) Schematic illustration of TGM hydrolyzed by inflammatory factors and releasing encapsulated TAC. (b)TAC release in vitro in the medium with or without inflammatory factors. (c) Live/dead staining of neural stem cells, which were incubated with culture medium or the leaching solution of TGM or TAC@TGM. Scale bar, 200 μm. (d) Cell viability of neural stem cells from CCK8 assay cultured with normal medium, leaching solution of TGM or TAC@TGM, ns indicated not statistically significant.
Figure 3.
Figure 3.
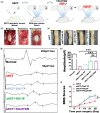
TAC@TGM facilitated electrophysiological recovery and locomotor functional improvement in aSCT transplantation mice. (a) Schematic diagram of aSCTs transplantation. The donated aSCTs were isolated from GFP-transgenic mice. TAC@TGM was applied to the surface of transplanted aSCT. (b) Surgical procedures of spinal cord transection and aSCT transplantation. 1: T7–T10 spinal cord region was exposed; 2: T8–T9 spinal cord (2 mm) was transected; 3: aSCT spinal cord was transplanted into the transection site. (c) Photos of spinal cord samples from each group at 4 weeks post-surgery. (d, e) MEP profiles and the amplitude ratio of MEP in the aSCT, aSCT + TAC-TP, aSCT + TAC-IP, aSCT + TAC@TGM and normal groups. (f) BMS scores of hind limbs from different groups during the 4-week treatment. **P < 0.01; ***P < 0.001; ns indicated not statistically significant.
Figure 4.
Figure 4.
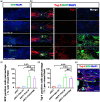
Survival of aSCT and neurons in the transplanted area at 4 weeks post-surgery. (a) GFP signal represented the surviving cells from donor segments in each group. Scale bar, 500 μm. (b) Immunofluorescent staining images of tuj-1 positive axons in each group, magnified images represent the selected area within the yellow box. Scale bars, 500 μm (left), 200 μm (middle), 200 μm (right). (c, d) Quantification of GFP positive cells and tuj-1 positive neurons in the transplant site. (e) Magnified images of the selected zone marked number 5 in (b) showed tuj-1 and GFP double positive neurons. Scale bar, 10 μm. ***P < 0.001, ns indicated not statistically significant.
Figure 5.
Figure 5.
Survival NF positive neurons in the transplanted region. (a) NF immunofluorescence staining in the transplanted areas of each group after 4 weeks of surgery, magnified images represent the selected area within the yellow box. Scale bars, 500 μm (right), 100 μm (left). (b) The junction between recipient tissues and donor aSCTs in each group. Scale bars, 10 μm.
Figure 6.
Figure 6.
Inflammatory responses in the transplant area and blood. (a) HE staining of inflammatory cells in each group. Scale bars, 500 μm. (b) Magnified images represented the selected areas in the yellow box. Scale bars, 50 μm. (c) Average percentage of inflammatory cells in each group. Detection of various types of cell counts in peripheral blood including white blood cells (WBCs). (d) lymph cells. (e) Neutrophils (gran cells). (f) Eosinophils, basophils and monocytes (MID) cells (g). **P < 0.01, ***P < 0.001; ns indicates not statistically significant.
Figure 7.
Figure 7.
Immunofluorescence staining images of inflammatory cytokines in the transplanted area. (a) Immunofluorescence staining images of TNF-α in each group after 4 weeks of surgery. Scale bars, 500 μm (left) and 100 μm (right). (b) Immunofluorescence staining images of IL-2 T lymphocytes in each group. Scale bars represent 500 μm (left) and 25 μm (right). (c, d) Quantification of the TNF-α macrophages and IL-2 T lymphocytes in the transplanted area in each group. ***P < 0.001; ns indicated not statistically significant.
Figure 8.
Figure 8.
Immunofluorescence staining images of inflammatory cells in the transplanted area. (a) Immunofluorescence staining images of iNOS+ macrophages in each group after 4 weeks of surgery. Scale bars, 500 μm (left) and 100 μm (right). (b) Immunofluorescence staining images of CD4+ T lymphocytes in each group. Scale bars represent 500 μm (left) and 25 μm (right). (c, d) Quantification of the iNOS+ macrophages and CD4+ T lymphocytes in the transplanted area in each group. ***P < 0.001; ns indicated not statistically significant.
Figure 9.
Figure 9.
Analysis of liver and kidney injury. (a) HE staining images of heart, liver, spleen, lung and kidney in each above group. Red arrows indicate cytoplasmic swelling. Yellow arrows indicate atrophied glomeruli. Green arrows indicate atrophied renal tubules. Scale bars, 50 μm. Serum biochemical indicators of liver and kidney function. (b) ALT, (c) AST, (d) creatinine, (e) BUN. *P < 0.05, **P < 0.01, ***P < 0.001; ns indicated not statistically significant.

Similar articles

Cited by

References

    1. Liu D, Shen H, Shen Y, Long G, He X, Zhao Y, Yang Z, Dai J, Li X.. Dual-cues laden scaffold facilitates neurovascular regeneration and motor functional recovery after complete spinal cord injury. Adv Healthc Mater 2021;10:e2100089. - PubMed
    1. GBD 2016 Traumatic Brain Injury and Spinal Cord Injury Collaborators. Global, regional, and national burden of traumatic brain injury and spinal cord injury, 1990–2016: a systematic analysis for the global burden of disease study 2016. Lancet Neurol 2019;18:56–87. - PMC - PubMed
    1. Sofroniew MV. Dissecting spinal cord regeneration. Nature 2018;557:343–50. - PubMed
    1. Reier PJ, Perlow MJ, Guth L.. Development of embryonic spinal cord transplants in the rat. Brain Res 1983;312:201–19. - PubMed
    1. Jakeman LB, Reier PJ.. Axonal projections between fetal spinal cord transplants and the adult rat spinal cord: a neuroanatomical tracing study of local interactions. J Comp Neurol 1991;307:311–34. - PubMed