. 2023 Jan 6:15:1068990.
doi: 10.3389/fnmol.2022.1068990. eCollection 2022.

Ex vivo analysis platforms for monitoring amyloid precursor protein cleavage

Affiliations

Ex vivo analysis platforms for monitoring amyloid precursor protein cleavage

Yuji Kamikubo et al. Front Mol Neurosci. .

Abstract

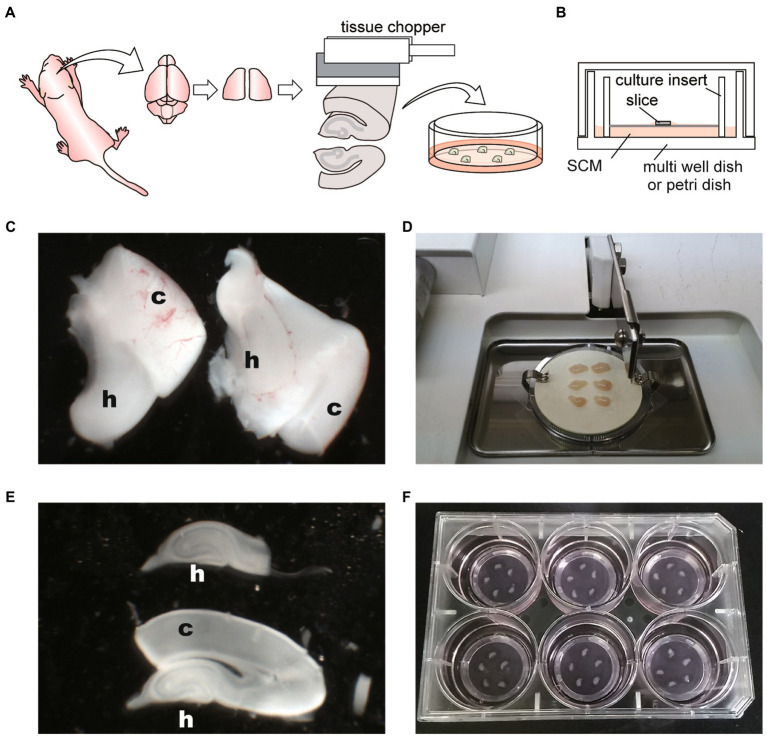
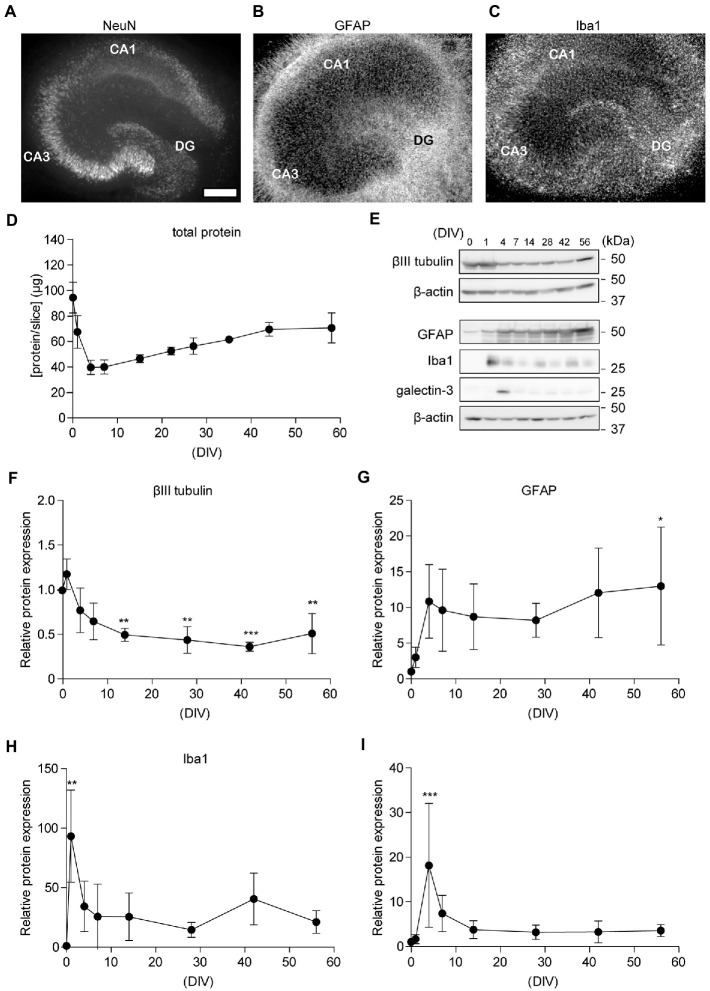
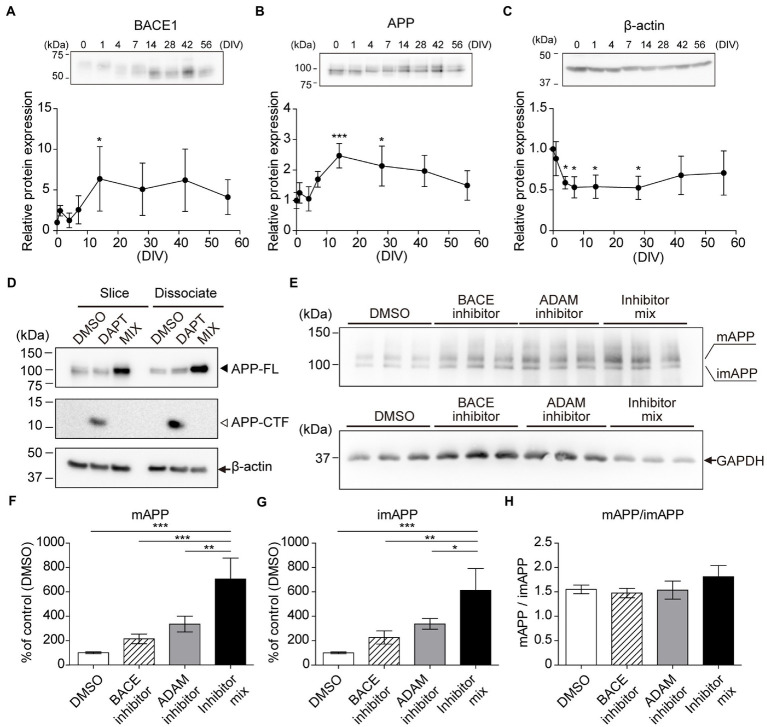
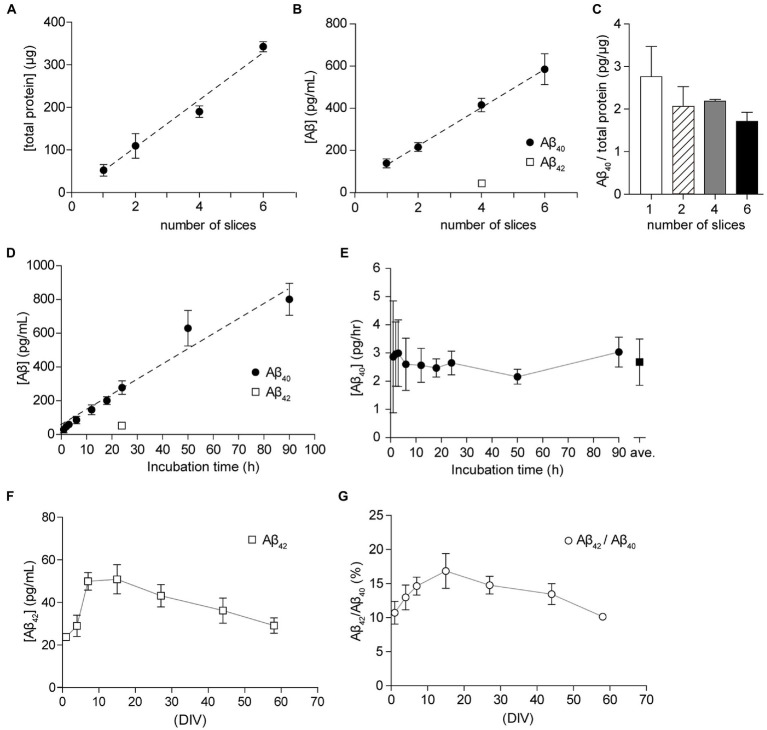
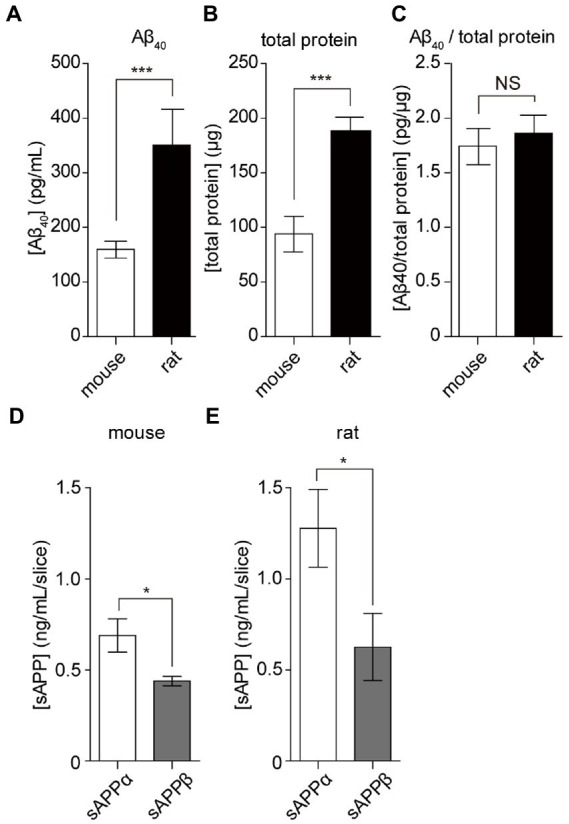
Alzheimer's disease (AD) is a progressive neurodegenerative brain disorder and the most common cause of dementia in the elderly. The presence of large numbers of senile plaques, neurofibrillary tangles, and cerebral atrophy is the characteristic feature of AD. Amyloid β peptide (Aβ), derived from the amyloid precursor protein (APP), is the main component of senile plaques. AD has been extensively studied using methods involving cell lines, primary cultures of neural cells, and animal models; however, discrepancies have been observed between these methods. Dissociated cultures lose the brain's tissue architecture, including neural circuits, glial cells, and extracellular matrix. Experiments with animal models are lengthy and require laborious monitoring of multiple parameters. Therefore, it is necessary to combine these experimental models to understand the pathology of AD. An experimental platform amenable to continuous observation and experimental manipulation is required to analyze long-term neuronal development, plasticity, and progressive neurodegenerative diseases. In the current study, we provide a practical method to slice and cultivate rodent hippocampus to investigate the cleavage of APP and secretion of Aβ in an ex vivo model. Furthermore, we provide basic information on Aβ secretion using slice cultures. Using our optimized method, dozens to hundreds of long-term stable slice cultures can be coordinated simultaneously. Our findings are valuable for analyses of AD mouse models and senile plaque formation culture models.

Keywords: Alzheimer’s disease; amyloid β; hippocampus; neurodegenerative disease; organotypic brain culture; secretase.


Conflict of interest statement

The authors declare that the research was conducted in the absence of any commercial or financial relationships that could be construed as a potential conflict of interest.

Figures

Figure 1
Figure 1
Schematic diagrams and photographs of procedure for hippocampal slice culture. (A) Schema of hippocampal slice culture method. (B) Schema representing disposition of slice on membrane culture insert and within the culture dish. SCM: slice culture medium. (C) Image of isolated hippocampi (H) with cerebral cortex (c). (D) Image of tissue chopper and isolated hippocampi with the cerebral cortex. Six hippocampi were placed on an OHP sheet in the cutting chamber. (E) Sliced hippocampus (h) with the cortex (c) and isolated hippocampus. (F) Five slices were placed onto the filter membrane cup in the six-well plate with SCM. Hippocampal slices are not located close to the cup walls of the inserts or close to each other.
Figure 2
Figure 2
Chronological analysis of neuronal cells in cultured hippocampal slices. (A–C) Immunofluorescence staining of cultured hippocampal slices antibodies against NeuN (A), GFAP (B), and Iba1 (C). CA1, Cornu Ammonis 1; CA3, Cornu Ammonis 3; DG, dentate gyrus. The scale indicates 500 μm. (D) Quantitative analysis of total protein in the lysate from four acute slices (0 days in vitro; DIV) or cultured slices (1–56 DIV). (E–I) Immunoblotting analysis of hippocampal slices with antibodies against βIII tubulin (F), GFAP (G), Iba1 (H), and galectin-3 (I). Each point (filled circle) denotes relative protein expression which was normalized to β-actin and relative to a 0 DIV (acute slice) sample. Full-length blots: Supplementary Figures S4, S5. Statistical significance was tested by one-way ANOVA, and pairwise comparison was performed according to Tukey–Kramer multiple comparison test. NS; p > 0.05; *; p < 0.05; **; p < 0.01; ***; p < 0.001, (vs. 0 DIV). Data are presented as mean ± SD, based on four independent experiments (n = 4).
Figure 3
Figure 3
Chronological analysis of APP and BACE1 by immunoblotting. Immunoblotting analysis of hippocampal slices (0–56 days in vitro, DIV) using antibodies against BACE1 (A), APP (B), and GAPDH (C). which was normalized to β-actin and relative to a 0 DIV sample. Each point (filled circle) denotes relative protein expression which was normalized to GAPDH and relative to a 0 DIV (acute slice) sample. Data were analyzed using one-way ANOVA, and pairwise comparison was performed according to Tukey–Kramer multiple comparison test. NS; p > 0.05, *; p < 0.05, **; p < 0.01, ***; p < 0.001 (vs. 0 DIV). Data are presented as mean ± SD, based on four independent experiments (n = 4). Full-length blots are shown in Supplementary Figure S5. (D–H) Immunoblotting analysis of APP cleavage. (D) Cultured hippocampal slices (slice, 14DIV) or dissociated hippocampal cells (dissociated, 14DIV) treated with γ-secretase inhibitor (DAPT, 10 μM) or secretase inhibitor mix (MIX; 10 μM DAPT, 50 μM ADAM inhibitor (GI254023X), and 2 μM BACE inhibitor (BACE inhibitor IV) for 24 h. β-actin served as a loading control. APP-FL: full-length APP. APP-CTF: APP C-terminal fragment. (E–H) Cultured hippocampal slices (14DIV, n = 3) treated with an ADAM inhibitor (GI254023X, 50 μM) and/or BACE1 inhibitor (BACE inhibitor IV, 2 μM) for 24 h. Mature APP-FL (mAPP) and immature APP-FL (imAPP) levels were evaluated quantitatively. Open bar, DMSO; stripe bar, BACE inhibitor; gray bar, ADAM inhibitor; black bar, BACE inhibitor and ADAM inhibitor mix. GAPDH served as a loading control. Full-length blots are shown in Supplementary Figure S6. Statistical significance was tested by one-way ANOVA, and pairwise comparison was performed according to Tukey–Kramer multiple comparison test. NS; p > 0.05; *; p < 0.05; **; p < 0.01; ***; p < 0.001. Data are presented as mean ± SD, based on three independent experiments (n = 3).
Figure 4
Figure 4
Culture condition and period dependency of the secretion of Aβ40. (A) Total protein in the lysate from 1, 2, 4, or 6 hippocampal slices (filled circles). Dashed line; linear regression. R2 = 0.9623, p < 0.0001. (B) Quantification of Aβ40 secreted from 1, 2, 4, or 6 cultured hippocampal slices (15 days in vitro, DIV) for 24 h (filled circles). Dashed line, linear regression of Aβ40. R2 = 0.9607, p < 0.0001. Quantification of Aβ42 secreted from 4 cultured hippocampal slices (15 days in vitro, DIV) for 24 h (open square). Results are presented as mean ± SD based on three independent experiments (n = 3). (C) The ratio of Aβ40 to total slice protein. Open bar, 1 slice; stripe bar, 2 slices; gray bar, 4 slices; black bar, 6 slices. Statistical significance was tested by one-way ANOVA, and pairwise comparison was performed according to Tukey–Kramer multiple comparison test. There was no significant difference between groups, p > 0.05. (D) Quantification of Aβ40 (filled circles) or Aβ42 (open square) secreted from a cultured hippocampal slice (15–21 DIV) for 1–90 h (Aβ40) or 24 h (Aβ42). Results are presented as mean ± SD based on four (1, 2, 3, 6, 12, 18 h) or eight (24, 50, 90 h) independent experiments (n = 4 or 8). Dashed line, linear regression of Aβ40. R2 = 0.9190, p < 0.0001. (E)40 secretion from a cultured hippocampal slice per 1 h. The amount of Aβ40 secretion is compensated for the residual medium (filled circle). Open square = an average of all dates (2.68 ± 0.82 pg/h, n = 48, 1–90 h). (F,G) Chronological quantitative analysis of the secretion of Aβ42 [(F), open squares] or the ratio of Aβ42 to Aβ40 in SCM [(G), open circles]. Four hippocampal slices were plated on a Millicell culture insert. For the Aβ assay, hippocampal slices were cultured with fresh SCM for 24 h at 37°C. Aβ40 and Aβ42 were quantified using ELISA.
Figure 5
Figure 5
APP cleavage products from cultured mouse and rat hippocampal slices. Aβ40, sAPPα, and sAPPβ in SCM were quantified using ELISA. Four hippocampal slices were prepared from rats or mice plated on a filter membrane cup. (A) Quantification of Aβ40 secreted from hippocampal slices (15 days in vitro) cultured with fresh SCM for 24 h at 37°C. (B) Total protein levels in rat and mouse hippocampal slices. (C) Calculated data for the ratio of Aβ40 to total protein ratio. (D,E) Quantification of sAPPα and sAPPβ secreted from hippocampal slices cultured in fresh SCM for 24 h at 37°C. Statistical significance was determined using unpaired t-tests. NS; p > 0.05; *; p < 0.05; ***; p < 0.001. Data are presented as mean ± SD, based on three independent cultures (n = 3).

Similar articles

Cited by

References

    1. Benjannet S., Elagoz A., Wickham L., Mamarbachi M., Munzer J. S., Basak A., et al. . (2001). Post-translational processing of beta-secretase (beta-amyloid-converting enzyme) and its ectodomain shedding. The pro-and transmembrane/cytosolic domains affect its cellular activity and amyloid-beta production. J. Biol. Chem. 276, 10879–10887. doi: 10.1074/jbc.M009899200, PMID: - DOI - PubMed
    1. Bergold P. J., Casaccia-Bonnefil P., Zeng X. L., Federoff H. J. (1993). Transsynaptic neuronal loss induced in hippocampal slice cultures by a herpes simplex virus vector expressing the GluR6 subunit of the kainate receptor. Proc. Natl. Acad. Sci. U. S. A. 90, 6165–6169. doi: 10.1073/pnas.90.13.6165 - DOI - PMC - PubMed
    1. Blennow K., De Leon M. J., Zetterberg H. (2006). Alzheimer's disease. Lancet 368, 387–403. doi: 10.1016/S0140-6736(06)69113-7 - DOI - PubMed
    1. Buchs P. A., Stoppini L., Muller D. (1993). Structural modifications associated with synaptic development in area CA1 of rat hippocampal organotypic cultures. Brain Res. Dev. Brain Res. 71, 81–91. doi: 10.1016/0165-3806(93)90108-M, PMID: - DOI - PubMed
    1. Caruso G., Spampinato S. F., Cardaci V., Caraci F., Sortino M. A., Merlo S. (2019). Beta-amyloid and Oxidative stress: perspectives in drug development. Curr. Pharm. Des. 25, 4771–4781. doi: 10.2174/1381612825666191209115431, PMID: - DOI - PubMed

LinkOut - more resources