

Risk factors, prognostic predictors, and nomograms for pancreatic cancer patients with initially diagnosed synchronous liver metastasis
- PMID: 36684042
- PMCID: PMC9850760
- DOI: 10.4251/wjgo.v15.i1.128
Risk factors, prognostic predictors, and nomograms for pancreatic cancer patients with initially diagnosed synchronous liver metastasis
Abstract
Background: Liver metastasis (LM) remains a major cause of cancer-related death in patients with pancreatic cancer (PC) and is associated with a poor prognosis. Therefore, identifying the risk and prognostic factors in PC patients with LM (PCLM) is essential as it may aid in providing timely medical interventions to improve the prognosis of these patients. However, there are limited data on risk and prognostic factors in PCLM patients.
Aim: To investigate the risk and prognostic factors of PCLM and develop corresponding diagnostic and prognostic nomograms.
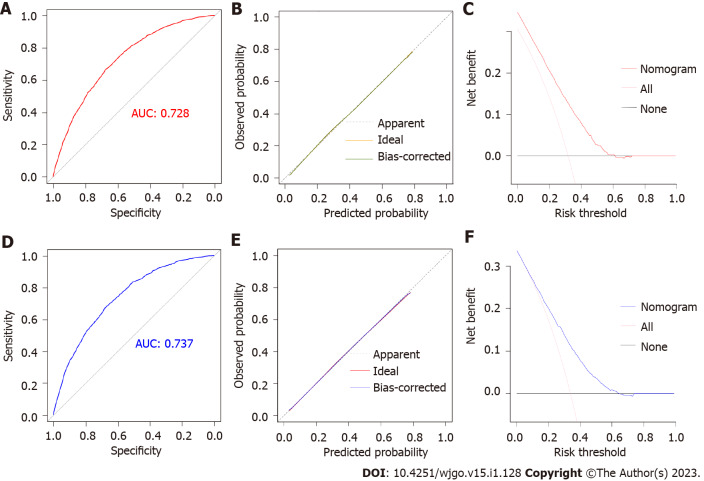
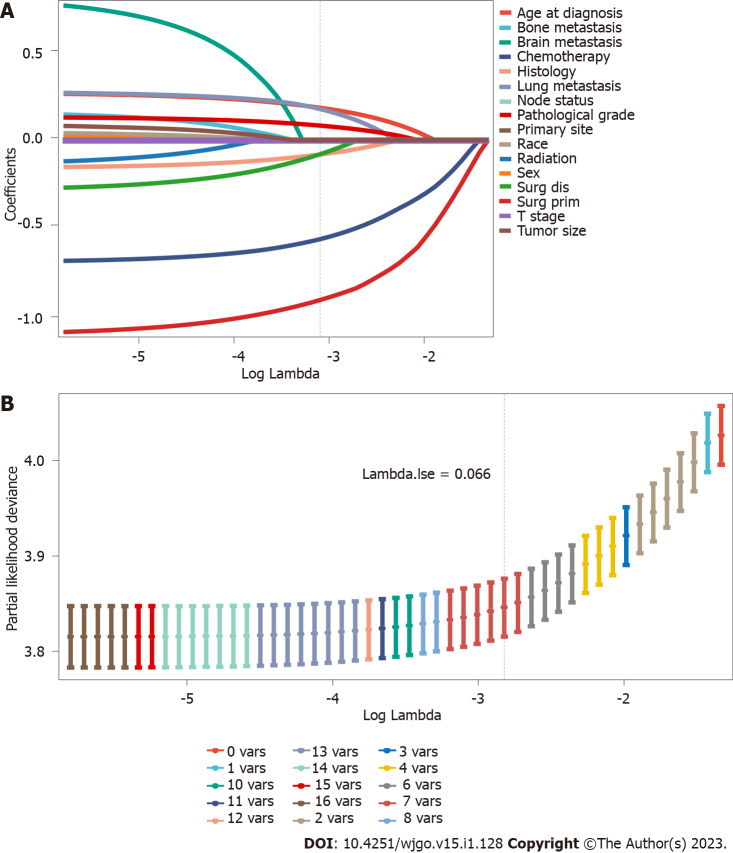
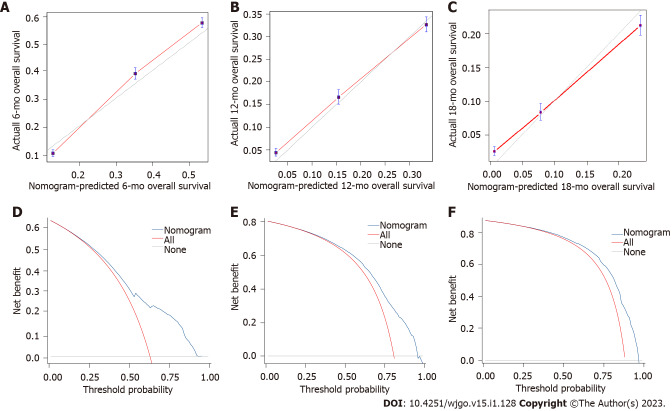
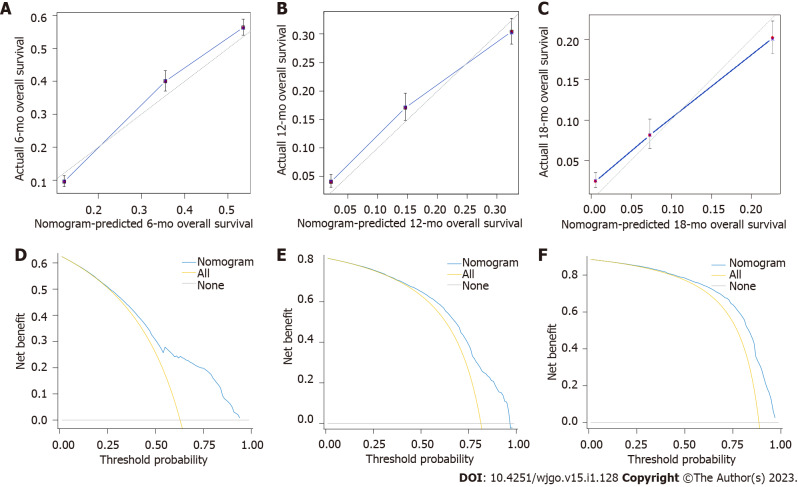
Methods: Patients with primary PC diagnosed between 2010 and 2015 were reviewed from the Surveillance, Epidemiology, and Results Database. Risk factors were identified using multivariate logistic regression analysis to develop the diagnostic mode. The least absolute shrinkage and selection operator Cox regression model was used to determine the prognostic factors needed to develop the prognostic model. The performance of the two nomogram models was evaluated using receiver operating characteristic (ROC) curves, calibration plots, decision curve analysis (DCA), and risk subgroup classification. The Kaplan-Meier method with a log-rank test was used for survival analysis.
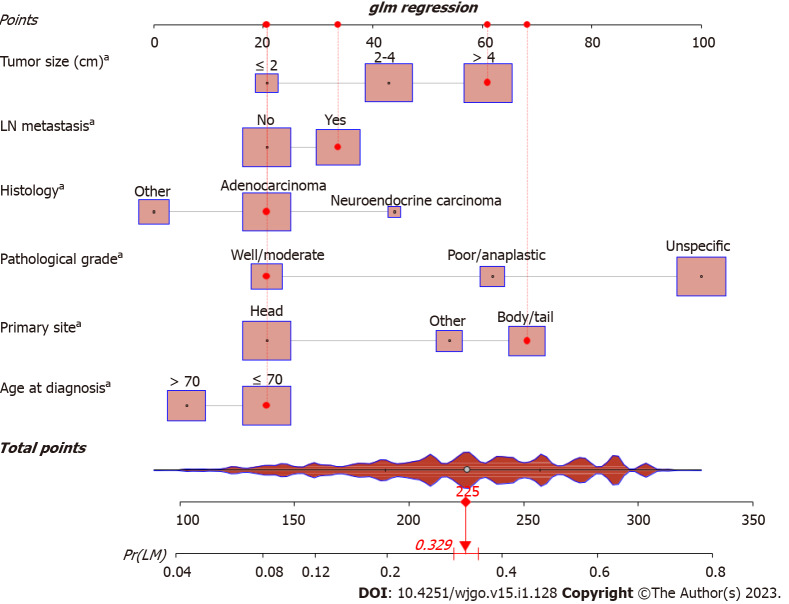
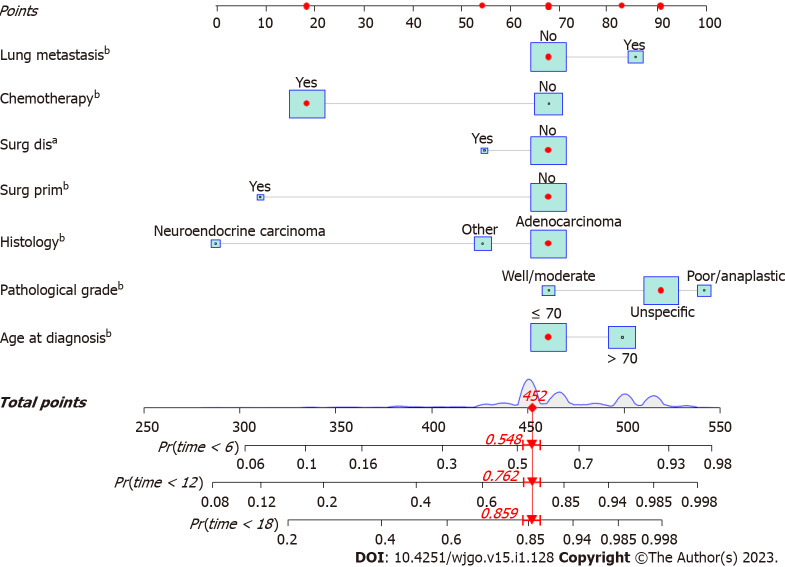
Results: We enrolled 33459 patients with PC in this study. Of them, 11458 (34.2%) patients had LM at initial diagnosis. Age at diagnosis, primary site, lymph node metastasis, pathological type, tumor size, and pathological grade were identified as independent risk factors for LM in patients with PC. Age > 70 years, adenocarcinoma, poor or anaplastic differentiation, lung metastases, no surgery, and no chemotherapy were the independently associated risk factors for poor prognosis in patients with PCLM. The C- index of diagnostic and prognostic nomograms were 0.731 and 0.753, respectively. The two nomograms could accurately predict the occurrence and prognosis of patients with PCLM based on the observed analysis results of ROC curves, calibration plots, and DCA curves. The prognostic nomogram could stratify patients into prognostic groups and perform well in internal validation.
Conclusion: Our study identified the risk and prognostic factors in patients with PCLM and developed corresponding diagnostic and prognostic nomograms to help clinicians in subsequent clinical evaluation and intervention. External validation is required to confirm these results.
Keywords: Liver; Neoplasm metastasis; Nomograms; Pancreatic neoplasms; Prognosis; Surveillance, Epidemiology, and End Result program.
©The Author(s) 2023. Published by Baishideng Publishing Group Inc. All rights reserved.
Conflict of interest statement
Conflict-of-interest statement: All authors report no relevant conflicts of interest for this article.
Figures

Similar articles
-
Nomograms for Predicting the Risk and Prognosis of Liver Metastases in Pancreatic Cancer: A Population-Based Analysis.J Pers Med. 2023 Feb 24;13(3):409. doi: 10.3390/jpm13030409. J Pers Med. 2023. PMID: 36983591 Free PMC article.
-
Two Novel Nomograms Predicting the Risk and Prognosis of Pancreatic Cancer Patients With Lung Metastases: A Population-Based Study.Front Public Health. 2022 May 31;10:884349. doi: 10.3389/fpubh.2022.884349. eCollection 2022. Front Public Health. 2022. PMID: 35712294 Free PMC article.
-
Nomogram Predicts Risk and Prognostic Factors for Bone Metastasis of Pancreatic Cancer: A Population-Based Analysis.Front Endocrinol (Lausanne). 2022 Mar 9;12:752176. doi: 10.3389/fendo.2021.752176. eCollection 2021. Front Endocrinol (Lausanne). 2022. PMID: 35356148 Free PMC article.
-
Risk factors and survival prediction of pancreatic cancer with lung metastases: A population-based study.Front Oncol. 2022 Sep 21;12:952531. doi: 10.3389/fonc.2022.952531. eCollection 2022. Front Oncol. 2022. PMID: 36212473 Free PMC article.
-
Prostate Cancer Liver Metastasis: An Ominous Metastatic Site in Need of Distinct Management Strategies.J Clin Med. 2024 Jan 27;13(3):734. doi: 10.3390/jcm13030734. J Clin Med. 2024. PMID: 38337427 Free PMC article. Review.
Cited by
-
Serum exosomal hsa-let-7f-5p: A potential diagnostic biomarker for metastatic pancreatic cancer detection.World J Gastroenterol. 2025 Jul 14;31(26):109500. doi: 10.3748/wjg.v31.i26.109500. World J Gastroenterol. 2025. PMID: 40678708 Free PMC article.
-
Survival benefit of local consolidative therapy for patients with single-organ metastatic pancreatic cancer: a propensity score-matched cross-sectional study based on 17 registries.Front Endocrinol (Lausanne). 2023 Nov 2;14:1225979. doi: 10.3389/fendo.2023.1225979. eCollection 2023. Front Endocrinol (Lausanne). 2023. PMID: 38027134 Free PMC article.
-
Treatment of Candida albicans liver abscess complicated with COVID-19 after liver metastasis ablation: A case report.World J Gastrointest Oncol. 2023 Jul 15;15(7):1311-1316. doi: 10.4251/wjgo.v15.i7.1311. World J Gastrointest Oncol. 2023. PMID: 37546559 Free PMC article.
-
Prognostic Index for Liver Radiation (PILiR).Curr Oncol. 2024 Sep 29;31(10):5862-5872. doi: 10.3390/curroncol31100436. Curr Oncol. 2024. PMID: 39451740 Free PMC article.
-
A novel nomogram and risk classification system based on inflammatory and immune indicators for predicting prognosis of pancreatic cancer patients with liver metastases.Cancer Med. 2023 Sep;12(18):18622-18632. doi: 10.1002/cam4.6471. Epub 2023 Aug 27. Cancer Med. 2023. PMID: 37635391 Free PMC article.
References
-
- National Cancer Institute. Cancer Stat Facts: Pancreatic Cancer. [cited 5 October 2022]. Available from: https://seer.cancer.gov/statfacts/html/pancreas.html .
-
- Mizrahi JD, Surana R, Valle JW, Shroff RT. Pancreatic cancer. Lancet. 2020;395:2008–2020. - PubMed
-
- He C, Huang X, Zhang Y, Lin X, Li S. The impact of different metastatic patterns on survival in patients with pancreatic cancer. Pancreatology. 2021;21:556–563. - PubMed
-
- Sohal DPS, Kennedy EB, Cinar P, Conroy T, Copur MS, Crane CH, Garrido-Laguna I, Lau MW, Johnson T, Krishnamurthi S, Moravek C, O'Reilly EM, Philip PA, Pant S, Shah MA, Sahai V, Uronis HE, Zaidi N, Laheru D. Metastatic Pancreatic Cancer: ASCO Guideline Update. J Clin Oncol. 2020:JCO2001364. - PubMed
LinkOut - more resources
Full Text Sources
