. 2022 Sep 3;8(1):e10363.
doi: 10.1002/btm2.10363. eCollection 2023 Jan.

Splice-switch oligonucleotide-based combinatorial platform prioritizes synthetic lethal targets CHK1 and BRD4 against MYC-driven hepatocellular carcinoma

Affiliations

Splice-switch oligonucleotide-based combinatorial platform prioritizes synthetic lethal targets CHK1 and BRD4 against MYC-driven hepatocellular carcinoma

Dexter Kai Hao Thng et al. Bioeng Transl Med. .

Abstract

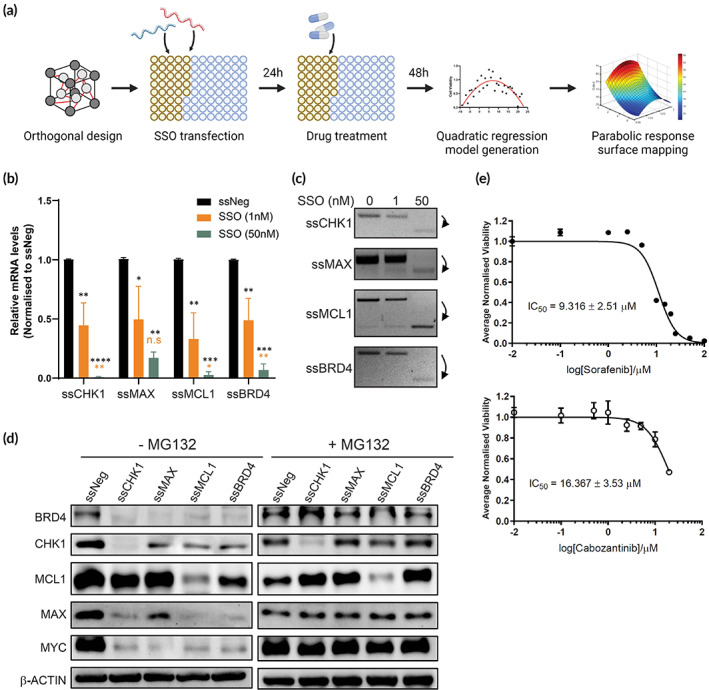
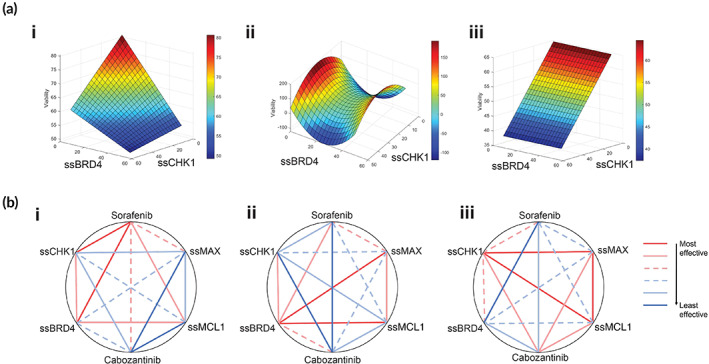
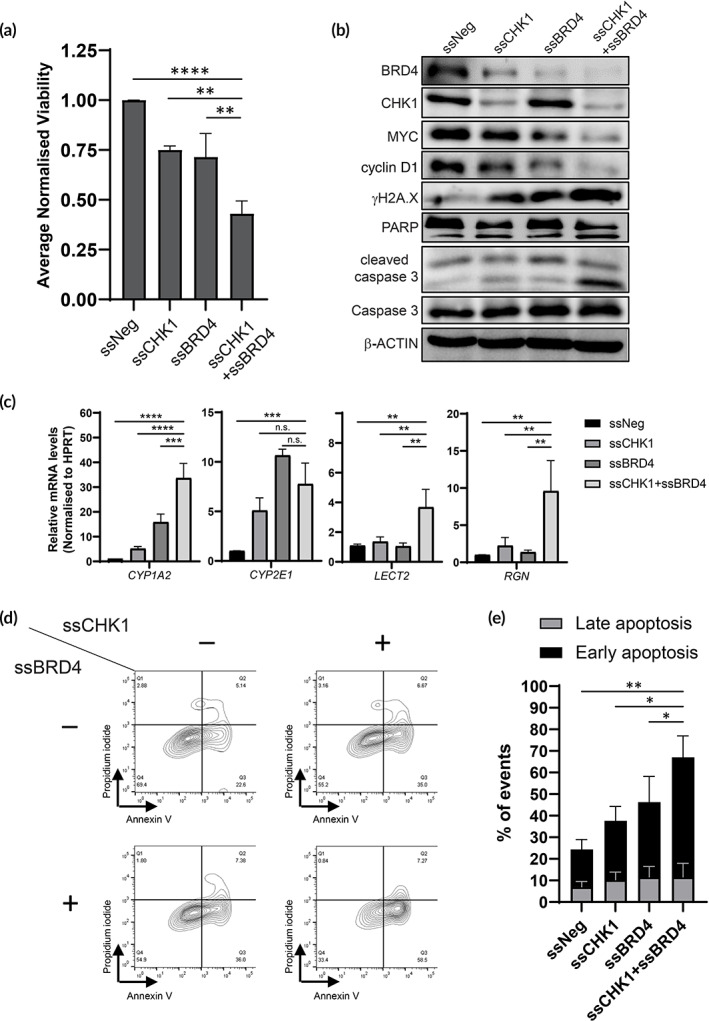
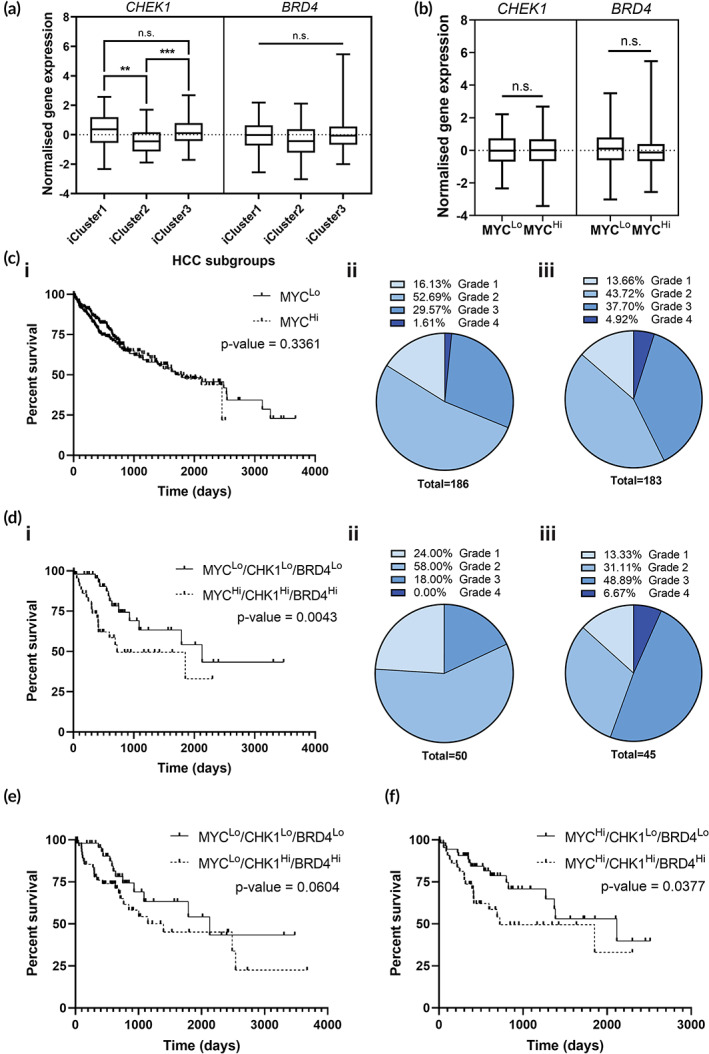
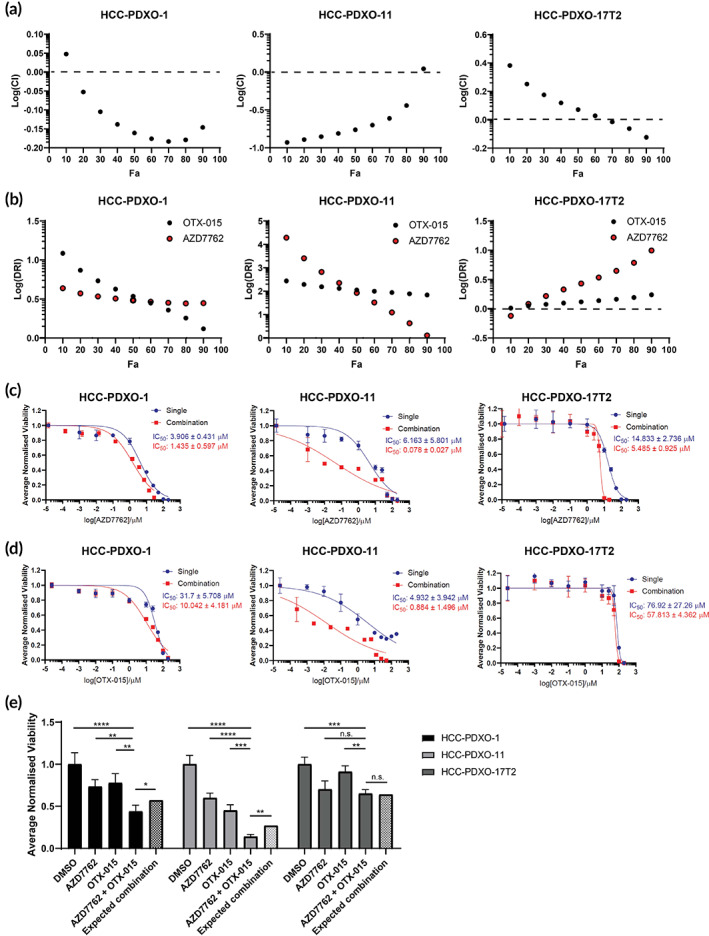
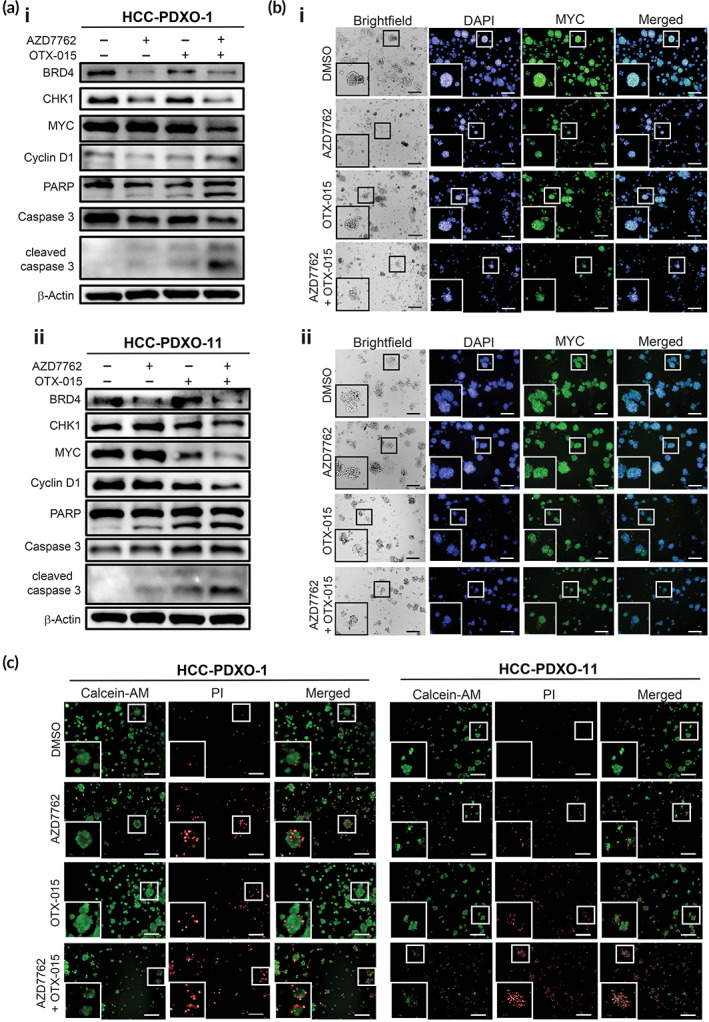
Deregulation of MYC is among the most frequent oncogenic drivers in hepatocellular carcinoma (HCC). Unfortunately, the clinical success of MYC-targeted therapies is limited. Synthetic lethality offers an alternative therapeutic strategy by leveraging on vulnerabilities in tumors with MYC deregulation. While several synthetic lethal targets of MYC have been identified in HCC, the need to prioritize targets with the greatest therapeutic potential has been unmet. Here, we demonstrate that by pairing splice-switch oligonucleotide (SSO) technologies with our phenotypic-analytical hybrid multidrug interrogation platform, quadratic phenotypic optimization platform (QPOP), we can disrupt the functional expression of these targets in specific combinatorial tests to rapidly determine target-target interactions and rank synthetic lethality targets. Our SSO-QPOP analyses revealed that simultaneous attenuation of CHK1 and BRD4 function is an effective combination specific in MYC-deregulated HCC, successfully suppressing HCC progression in vitro. Pharmacological inhibitors of CHK1 and BRD4 further demonstrated its translational value by exhibiting synergistic interactions in patient-derived xenograft organoid models of HCC harboring high levels of MYC deregulation. Collectively, our work demonstrates the capacity of SSO-QPOP as a target prioritization tool in the drug development pipeline, as well as the therapeutic potential of CHK1 and BRD4 in MYC-driven HCC.

Keywords: MYC synthetic lethality; RNA therapeutics; quadratic phenotypic optimization platform; splice‐switch oligonucleotides.


Conflict of interest statement

Edward Kai‐Hua Chow is a shareholder in KYAN Therapeutics.

Figures

FIGURE 1
FIGURE 1
Establishment of splice‐switch oligonucleotide (SSO)‐based quadratic phenotypic optimization platform (QPOP) combination optimization pipeline in Bel7402 cell line. (a) Workflow of SSO combination optimization via QPOP analysis. Experimental combinations of SSO and standard‐of‐care drugs were predetermined using orthogonal array composite design. Cells were co‐transfected with SSO combinations and then drug combinations 24 h after. Cell viabilities were determined 48 h after and used to generate a second‐order regression model for parabolic response surface mapping via QPOP analysis. Figure was created with BioRender.com. (b) Validation of splicing events in SSO target genes. Relative expressions of spliced transcripts were determined via quantitative real time‐polymerase chain reaction and (c) gel electrophoresis following SSO transfection at 1 and 50 nM. Ordinary one‐way ANOVA and Tukey's pairwise comparisons were performed as recommended (n.s.: not significant; *p < 0.05; **p < 0.01; ***p < 0.001). (d) Functional consequence of SSO transfection on protein expression levels of target genes and MYC were determined by immunoblotting. Proteasome inhibitor treatment with MG132 for 6 h posttransfection was performed to determine the specific effect of SSO on transcriptional and translational regulation of target gene expression. (e) Dose–response curves of standard‐of‐care drugs sorafenib and cabozantinib as quantified via MTS. IC50 values are represented as means ± SD (n = 3).
FIGURE 2
FIGURE 2
Quadratic phenotypic optimization platform (QPOP)‐identified combination ssCHK1 and ssBRD4 is an effective combination against MYC‐deregulated hepatocellular carcinoma (HCC). (a) Response surface mapping of interactions between ssCHK1 and ssBRD4 in (i) MYCHi Bel7402, (ii) HCCLM3, (iii) and MYCLo SNU387. (b) Polygonograms illustrating the efficacy interactions of all two‐drug/SSO combinations in (i) MYCHi Bel7402, (ii) HCCLM3, (iii) and MYCLo SNU387. Efficacies of each combination are represented as geometric means and ranked based on the percentiles of each combination. (red, most effective, 83.3–100th percentile; pink, second most effective, 66.7–83.3th percentile; pink and dotted, third most effective, 50–66.7th percentile; light blue and dotted, third least effective, 33.3‐50th percentile; light blue, second least effective, 16.7–33.3th percentile; dark blue, least effective, 0–33.3th percentile)
FIGURE 3
FIGURE 3
ssCHK1 and ssBRD4 co‐transfection exhibit antitumor properties in MYCHi Bel7402. (a) Validation of ssCHK1 and ssBRD4 in Bel7402 48 h after transfection by MTS. Ordinary one‐way ANOVA and Dunnett's pairwise comparison were performed as recommended (n.s.: not significant; *p < 0.05; **p < 0.01; ***p < 0.001). (b) Immunoblotting to determine the functional consequence on MYC activity, DNA damage, and apoptosis markers after ssCHK1 and ssBRD4 co‐transfection in Bel7402. (c) Relative gene expression of tumor suppressor genes in Bel7402 following single and combination therapy of ssCHK1 and ssBRD4 in Bel7402. Ordinary one‐way ANOVA and Dunnett's pairwise comparisons were performed as recommended (n.s.: not significant; *p < 0.05; **p < 0.01; ***p < 0.001). (d) Flow cytometric analysis of Annexin V apoptosis assay in Bel7402 co‐transfected with ssCHK1 and ssBRD4. (e) Quantification of apoptosis events from flow cytometric analysis in (d). One‐way ANOVA and Dunnett's pairwise comparisons were performed as recommended (n.s.: not significant; *p < 0.05; **p < 0.01; ***p < 0.001).
FIGURE 4
FIGURE 4
CHEK1 and BRD4 expression portends poorer prognosis in MYC‐stratified HCC. (a) Expression levels of CHEK1 and BRD4 in the Genomic Data Commons (GDC) The Cancer Genome Atlas Liver Hepatocellular Carcinoma (TCGA‐LIHC) patient cohort when stratified into three molecular subtypes (iCluster1‐3), (b) and when stratified into MYCLo and MYCHi tumors. Statistical analyses between molecular subtypes of HCC were performed using Games‐Howell corrected Brown–Forsythe and Welch ANOVA, and Dunn's corrected Kruskal–Wallis test for CHEK1 and BRD4 expression levels, respectively. Statistical analyses between MYCLo and MYCHi samples were performed using one‐sample t‐test. (n.s.: not significant; **p < 0.01; ***p < 0.001). (c) (i) Kaplan–Meier survival curves of overall patient survival according to expression levels of MYC from the GDC TCGA‐LIHC data set. (MYCLo, n = 185; MYCHi, n = 183). Distribution of (ii) MYCLo and (iii) MYCHi samples according to their neoplasm histologic grade. (d) (i) Kaplan–Meier survival curves of overall patient survival according to expression levels of MYC, CHEK1 and BRD4. (MYCLo/CHK1Lo/BRD4Lo, n = 50; MYCHi/CHK1Hi/BRD4Hi, n = 44). Distribution of (ii) MYCLo/CHK1Lo/BRD4Lo and (iii) MYCHi/CHK1Hi/BRD4Hi samples according to their neoplasm histologic grade. (e) Kaplan–Meier survival curves of overall patient survival of MYCLo samples according to expression levels of CHEK1 and BRD4. (MYCLo/CHK1Lo/BRD4Lo, n = 50; MYCLo/CHK1Hi/BRD4Hi, n = 59). (f) Kaplan–Meier survival curves of overall patient survival of MYCHi samples according to expression levels of CHEK1 and BRD4. (MYCHi/CHK1Lo/BRD4Lo, n = 55; MYCHi/CHK1Hi/BRD4Hi, n = 44). Survival analyses were performed using Gehan–Breslow–Wilcoxon test.
FIGURE 5
FIGURE 5
Pharmacological inhibition of CHK1 and BRD4 is a synergistic combination against MYC‐driven HCC. (a) Fa‐combination indices plot and (b) Fa‐dose reduction indices plot of CHK1 inhibitor, AZD7762, and BRD4 inhibitor, OTX‐015 in MYCHi HCC‐PDXO‐1, HCC‐PDXO‐11, and MYCLo HCC‐PDXO‐17T2 as calculated based on the Chou‐Talalay method. Indices are represented as means of three biological repeats. Monotherapy versus combination therapy dose–response curves and IC50 analysis of (c) AZD7762 and (d) OTX‐015 in HCC‐PDXO‐1, HCC‐PDXO‐11, and HCC‐PDXO‐17T2. IC50 values are represented as means ± SD (n = 3). (e) Bliss‐independence validation of AZD7762 and OTX‐015 in HCC‐PDXOs as quantified by CTG. Expected viabilities of HCC‐PDXOs are the product of the singlet viabilities. Statistical analyses between treatment groups were performed using ordinary one‐way ANOVA and Dunnett's pairwise comparisons as recommended. Statistical analyses between observed and expected viabilities following combination therapy were performed using one‐sample t‐test. (n.s.: not significant; *p < 0.05; **p < 0.01; ***p < 0.001).
FIGURE 6
FIGURE 6
AZD7762 and OTX‐015 combination therapy disrupts organoid growth in HCC‐PDXOs in vitro. (a) Immunoblots of MYC and apoptosis markers in (i) HCC‐PDXO‐1 and (ii) HCC‐PDXO‐11 following treatment with AZD7762 and OTX‐015. (b) Immunofluorescence of MYC expression levels and brightfield images of (i) HCC‐PDXO‐1 and (ii) HCC‐PDXO‐11 after combination therapy of AZD7762 and OTX‐015 (scale bar, 200 μM). (c) Live/dead cell viability assay of HCC‐PDXO‐1 and HCC‐PDXO‐11. HCC‐PDXOs were stained with fluorescence markers calcein‐AM and propidium iodide (scale bar, 200 μM). Fluorescence and brightfield images were taken with the Operetta high‐content screening microscope and insert images were magnified by a factor of 2.5.

Similar articles

Cited by

References

    1. Lourenco C, Kalkat M, Houlahan KE, et al. Modelling the MYC‐driven normal‐to‐tumour switch in breast cancer. Dis Model Mech. 2019;12(7):dmm038083. doi:10.1242/dmm.038083 - DOI - PMC - PubMed
    1. Shachaf CM, Kopelman AM, Arvanitis C, et al. MYC inactivation uncovers pluripotent differentiation and tumour dormancy in hepatocellular cancer. Nature. 2004;431(7012):1112‐1117. doi:10.1038/nature03043 - DOI - PubMed
    1. Huang CH, Lujambio A, Zuber J, et al. CDK9‐mediated transcription elongation is required for MYC addiction in hepatocellular carcinoma. Genes Dev. 2014;28(16):1800‐1814. doi:10.1101/gad.244368.114 - DOI - PMC - PubMed
    1. Rochlitz CF, Herrmann R, de Kant E. Overexpression and amplification of c‐myc during progression of human colorectal cancer. Oncology. 1996;53(6):448‐454. doi:10.1159/000227619 - DOI - PubMed
    1. Shou Y, Martelli ML, Gabrea A, et al. Diverse karyotypic abnormalities of the c‐myc locus associated with c‐myc dysregulation and tumor progression in multiple myeloma. Proc Natl Acad Sci U S A. 2000;97(1):228‐233. doi:10.1073/pnas.97.1.228 - DOI - PMC - PubMed

LinkOut - more resources