

A high-throughput biomimetic bone-on-a-chip platform with artificial intelligence-assisted image analysis for osteoporosis drug testing
- PMID: 36684077
- PMCID: PMC9842054
- DOI: 10.1002/btm2.10313
A high-throughput biomimetic bone-on-a-chip platform with artificial intelligence-assisted image analysis for osteoporosis drug testing
Abstract
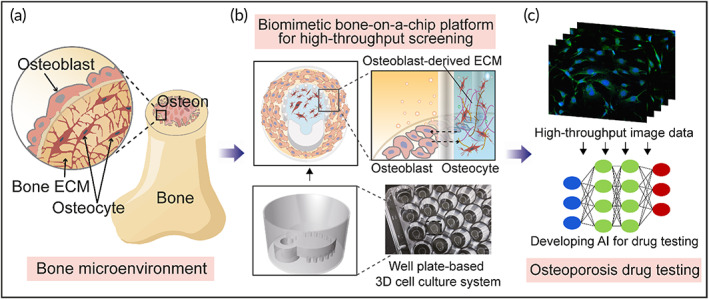
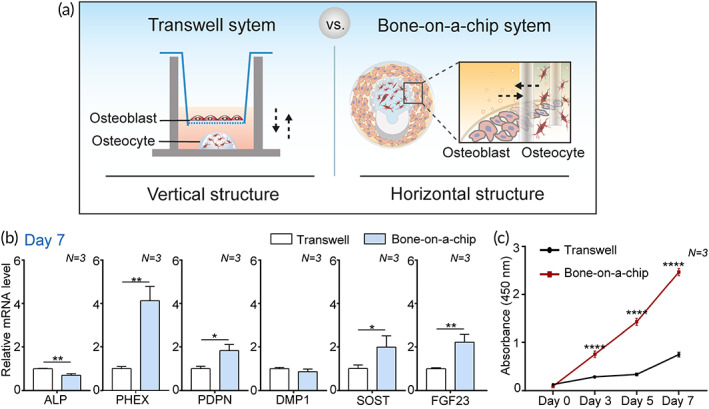
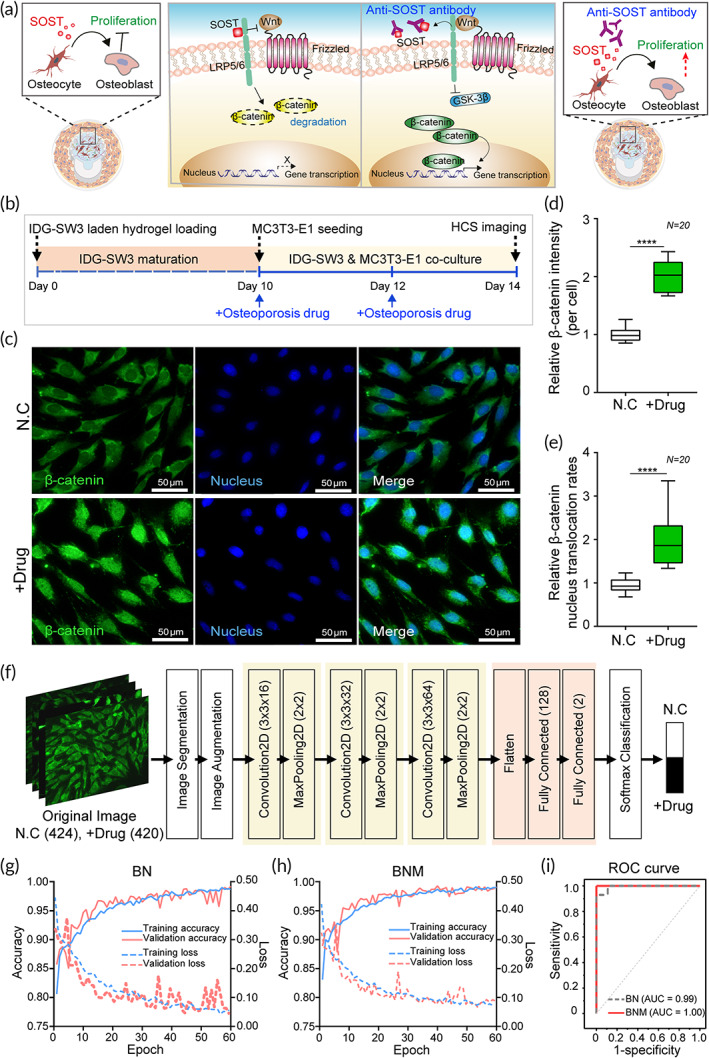
Although numerous organ-on-a-chips have been developed, bone-on-a-chip platforms have rarely been reported because of the high complexity of the bone microenvironment. With an increase in the elderly population, a high-risk group for bone-related diseases such as osteoporosis, it is essential to develop a precise bone-mimicking model for efficient drug screening and accurate evaluation in preclinical studies. Here, we developed a high-throughput biomimetic bone-on-a-chip platform combined with an artificial intelligence (AI)-based image analysis system. To recapitulate the key aspects of natural bone microenvironment, mouse osteocytes (IDG-SW3) and osteoblasts (MC3T3-E1) were cocultured within the osteoblast-derived decellularized extracellular matrix (OB-dECM) built in a well plate-based three-dimensional gel unit. This platform spatiotemporally and configurationally mimics the characteristics of the structural bone unit, known as the osteon. Combinations of native and bioactive ingredients obtained from the OB-dECM and coculture of two types of bone cells synergistically enhanced osteogenic functions such as osteocyte differentiation and osteoblast maturation. This platform provides a uniform and transparent imaging window that facilitates the observation of cell-cell interactions and features high-throughput bone units in a well plate that is compatible with a high-content screening system, enabling fast and easy drug tests. The drug efficacy of anti-SOST antibody, which is a newly developed osteoporosis drug for bone formation, was tested via β-catenin translocation analysis, and the performance of the platform was evaluated using AI-based deep learning analysis. This platform could be a cutting-edge translational tool for bone-related diseases and an efficient alternative to bone models for the development of promising drugs.
Keywords: bone formation; bone‐on‐a‐chip; deep learning; drug testing; high‐throughput analysis; osteoporosis.
© 2022 The Authors. Bioengineering & Translational Medicine published by Wiley Periodicals LLC on behalf of American Institute of Chemical Engineers.
Conflict of interest statement
The authors declare no conflicts of interest.
Figures
Similar articles
-
IDG-SW3 Osteocyte Differentiation and Bone Extracellular Matrix Deposition Are Enhanced in a 3D Matrix Metalloproteinase-Sensitive Hydrogel.ACS Appl Bio Mater. 2020 Mar 16;3(3):1666-1680. doi: 10.1021/acsabm.9b01227. Epub 2020 Feb 19. ACS Appl Bio Mater. 2020. PMID: 32719827 Free PMC article.
-
Bone on-a-chip: a 3D dendritic network in a screening platform for osteocyte-targeted drugs.Biofabrication. 2023 Sep 1;15(4). doi: 10.1088/1758-5090/acee23. Biofabrication. 2023. PMID: 37552982
-
Regulation of Osteoblast to Osteocyte Differentiation by Cyclin-Dependent Kinase-1.Adv Biol (Weinh). 2023 Dec;7(12):e2300136. doi: 10.1002/adbi.202300136. Epub 2023 Jul 10. Adv Biol (Weinh). 2023. PMID: 37424388
-
The Osteocyte as the New Discovery of Therapeutic Options in Rare Bone Diseases.Front Endocrinol (Lausanne). 2020 Jul 8;11:405. doi: 10.3389/fendo.2020.00405. eCollection 2020. Front Endocrinol (Lausanne). 2020. PMID: 32733380 Free PMC article. Review.
-
Mouse models for the evaluation of osteocyte functions.J Bone Metab. 2014 Feb;21(1):55-60. doi: 10.11005/jbm.2014.21.1.55. Epub 2014 Feb 28. J Bone Metab. 2014. PMID: 24707467 Free PMC article. Review.
Cited by
-
Prediction of anticancer drug resistance using a 3D microfluidic bladder cancer model combined with convolutional neural network-based image analysis.Front Bioeng Biotechnol. 2024 Jan 10;11:1302983. doi: 10.3389/fbioe.2023.1302983. eCollection 2023. Front Bioeng Biotechnol. 2024. PMID: 38268938 Free PMC article.
-
Three-Dimensional Bioprinting Applications for Bone Tissue Engineering.Cells. 2023 Apr 24;12(9):1230. doi: 10.3390/cells12091230. Cells. 2023. PMID: 37174630 Free PMC article. Review.
-
Microsystem Advances through Integration with Artificial Intelligence.Micromachines (Basel). 2023 Apr 8;14(4):826. doi: 10.3390/mi14040826. Micromachines (Basel). 2023. PMID: 37421059 Free PMC article. Review.
-
Bone-on-a-Chip Systems for Hematological Cancers.Biosensors (Basel). 2025 Mar 9;15(3):176. doi: 10.3390/bios15030176. Biosensors (Basel). 2025. PMID: 40136973 Free PMC article. Review.
-
Application of Artificial Intelligence at All Stages of Bone Tissue Engineering.Biomedicines. 2023 Dec 28;12(1):76. doi: 10.3390/biomedicines12010076. Biomedicines. 2023. PMID: 38255183 Free PMC article. Review.
References
-
- Porter JR, Ruckh TT, Popat KC. Bone tissue engineering: a review in bone biomimetics and drug delivery strategies. Biotechnol Prog. 2009;25(6):1539‐1560. - PubMed
LinkOut - more resources
Full Text Sources
Other Literature Sources
Miscellaneous
