Review
. 2022 Aug 3;8(1):e10367.
doi: 10.1002/btm2.10367. eCollection 2023 Jan.

Alzheimer's and Parkinson's disease therapies in the clinic

Affiliations
Review

Alzheimer's and Parkinson's disease therapies in the clinic

Puja Chopade et al. Bioeng Transl Med. .

Abstract

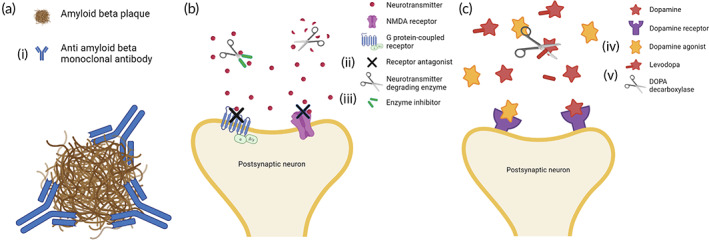
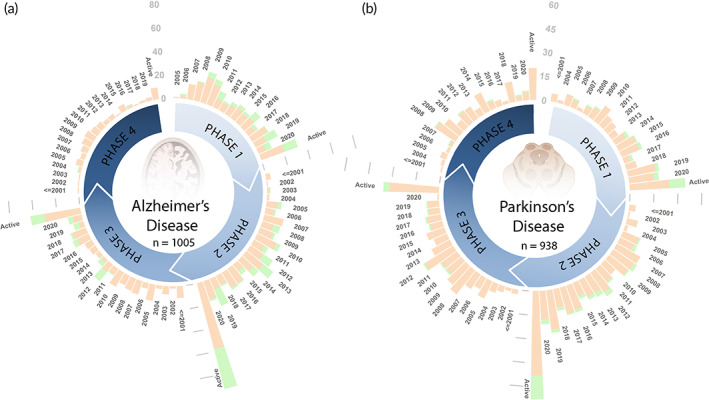
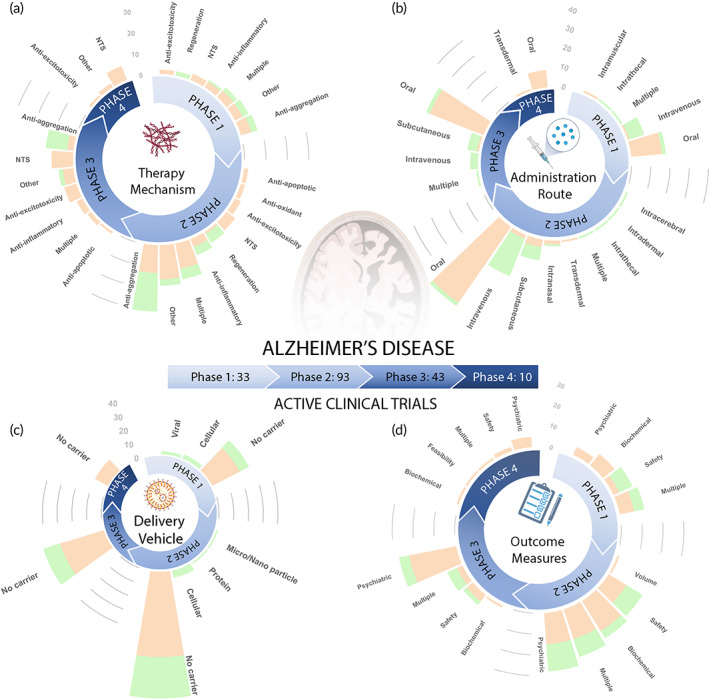
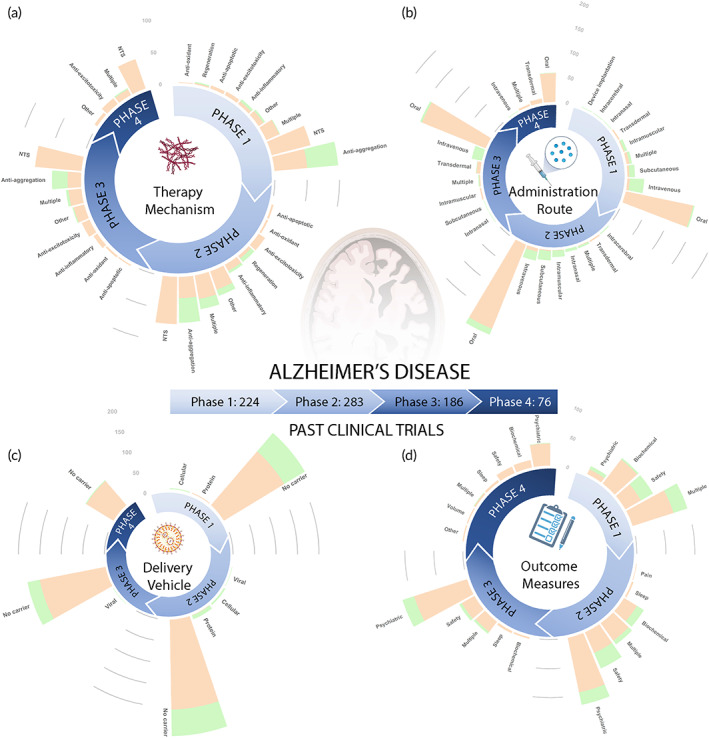
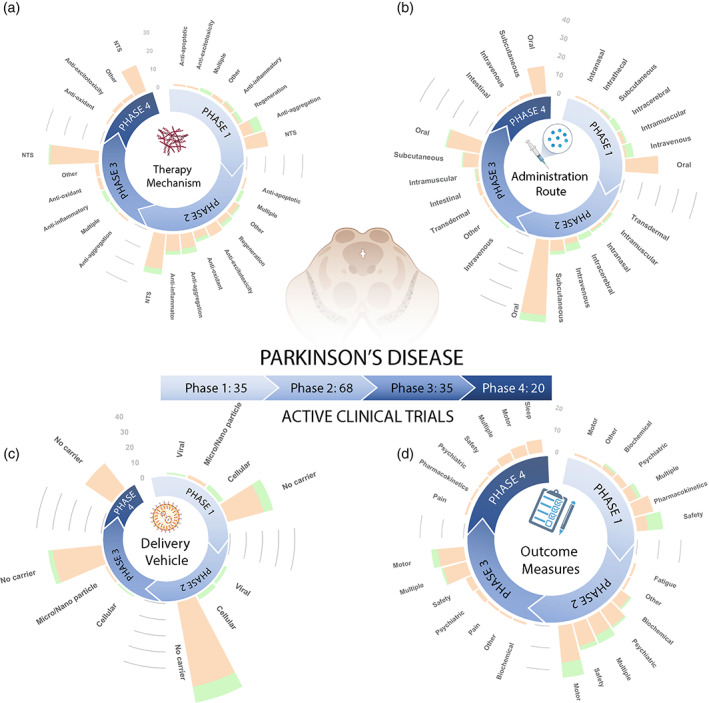
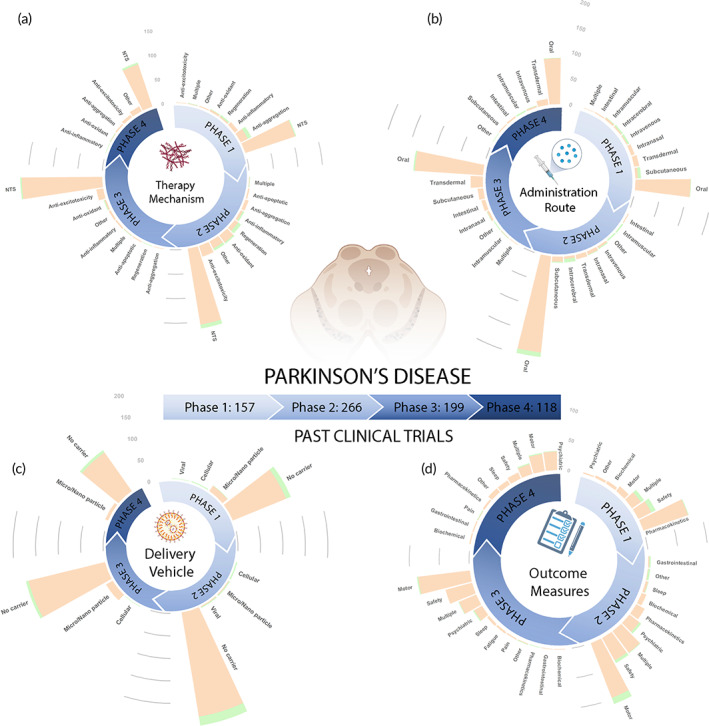
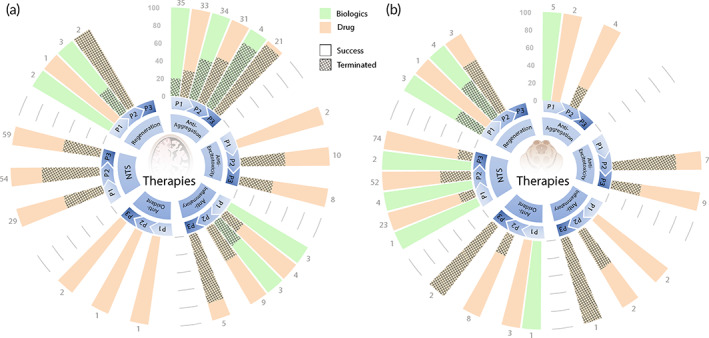
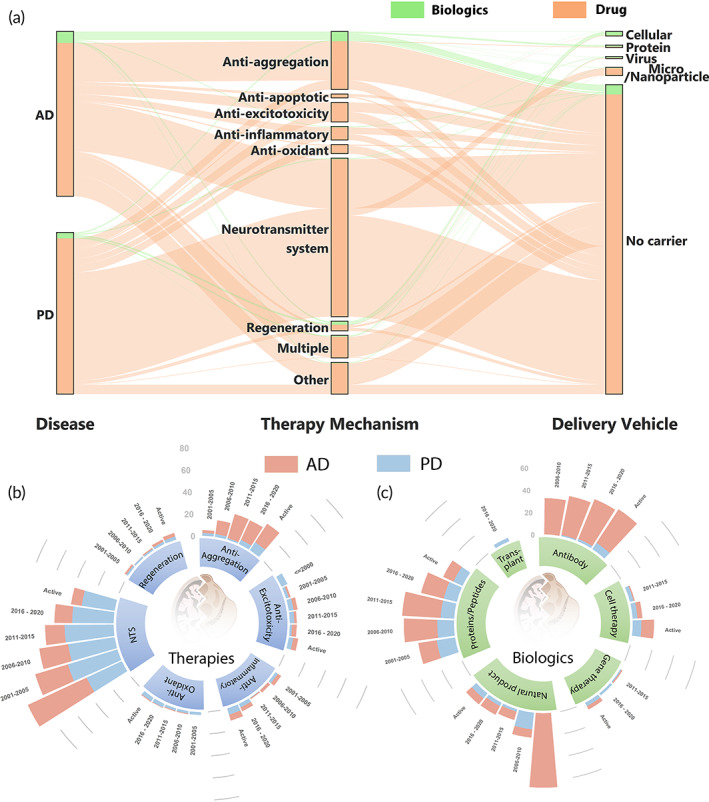
Alzheimer's disease (AD) and Parkinson's disease (PD) are the most prevalent neurodegenerative diseases, affecting millions and costing billions each year in the United States alone. Despite tremendous progress in developing therapeutics that manage the symptoms of these two diseases, the scientific community has yet to develop a treatment that effectively slows down, inhibits, or cures neurodegeneration. To gain a better understanding of the current therapeutic frontier for the treatment of AD and PD, we provide a review on past and present therapeutic strategies for these two major neurodegenerative disorders in the clinical trial process. We briefly recap currently US Food and Drug Administration-approved therapies, and then explore trends in clinical trials across the variables of therapy mechanism of disease intervention, administration route, use of delivery vehicle, and outcome measures, across the clinical phases over time for "Drug" and "Biologic" therapeutics. We then present the success rate of past clinical trials and analyze the intersections in therapeutic approaches for AD and PD, revealing the shift in clinical trials away from therapies targeting neurotransmitter systems that provide symptomatic relief, and towards anti-aggregation, anti-inflammatory, anti-oxidant, and regeneration strategies that aim to inhibit the root causes of disease progression. We also highlight the evolving distribution of the types of "Biologic" therapies investigated, and the slowly increasing yet still severe under-utilization of delivery vehicles for AD and PD therapeutics. We then briefly discuss novel preclinical strategies for treating AD and PD. Overall, this review aims to provide a succinct overview of the clinical landscape of AD and PD therapies to better understand the field's therapeutic strategy in the past and the field's evolution in approach to the present, to better inform how to effectively treat AD and PD in the future.

Keywords: Alzheimer's Disease; clinical trials; drug administration routes; outcome measures; therapy mechanisms; Parkinson's Disease; delivery vehicles.


Conflict of interest statement

The authors declare that they have no competing interests.

Figures

FIGURE 1
FIGURE 1
Schematic showing therapy mechanisms utilized by approved AD and PD drugs. a, b, and c, respectively, show therapy mechanisms specific to AD, common overlapping therapy mechanisms, and therapy mechanisms specific to PD. AD, Alzheimer's disease; PD, Parkinson's disease
FIGURE 2
FIGURE 2
All AD and PD interventional trials fitting the criteria detailed in Section 3. One thousand and five AD trials and 938 PD trials are plotted as a function of the clinical phase and completion year. In the stacked bars, orange color indicates “Drug” and green color indicates “Biologic” therapies. “Biologic” therapies are becoming more popular and are increasingly more successful through the clinical phases. AD, Alzheimer's disease; PD, Parkinson's disease
FIGURE 3
FIGURE 3
Summary of active AD clinical trials. (a) Therapy mechanism, (b) administration route, (c) delivery vehicle, and (d) outcome measures utilized by 179 active AD trials are plotted as a function of clinical phase. In the stacked bars, orange color indicates “Drug” and green color indicates “Biologic” therapies. The definition of key terms is available in Table A1. Note that liposomes‐based delivery vehicles are binned under micro/nanoparticle category in this article. AD, Alzheimer's disease
FIGURE 4
FIGURE 4
Summary of past AD clinical trials. (a) Therapy mechanism, (b) administration route, (c) delivery vehicle, and (d) outcome measures utilized by 769 past AD trials are plotted as a function of clinical phase. In the stacked bars, orange color indicates “Drug” and green color indicates “Biologic” therapies. The definition of key terms is available in Table A1. AD, Alzheimer's disease
FIGURE 5
FIGURE 5
Summary of active PD clinical trials. (a) Therapy mechanism, (b) administration route, (c) delivery vehicle, and (d) outcome measures utilized by 158 active PD trials are plotted as a function of clinical phase. In the stacked bars, orange color indicates “Drug” and green color indicates “Biologic” therapies. The definition of key terms is available in Table A1
FIGURE 6
FIGURE 6
Summary of past PD clinical trials. (a) Therapy mechanism, (b) administration route, (c) delivery vehicle, and (d) outcome measures utilized by 740 past PD trials are plotted as a function of clinical phase. In the stacked bars, orange color indicates “Drug” and green color indicates “Biologic” therapies. The definition of key terms is available in Table A1
FIGURE 7
FIGURE 7
Clinical outcomes based on therapy mechanism for “Drug” and “Biologic” trials. Success and termination percentiles for (a) AD and (b) PD clinical trials. A total of 375 out of 769 AD past trials have reported results (either through clinical trials.gov or via supported publications), whereas 213 out of 740 past PD trials have reported results. The numbers on top of the bars indicate the total number of trials represented by the bar. AD, Alzheimer's disease; PD, Parkinson's disease
FIGURE 8
FIGURE 8
Clinical intersections in the treatment of AD and PD. (a) Alluvial plot showing the intersections in the therapy mechanisms and drug delivery vehicles. Circular bar charts showing the distribution of clinical trials across the six most common (b) therapy mechanisms and (c) “Biologic” therapy types over 5‐year bins, encompassing all trials that were completed or terminated during that period of time. The radial axis denotes percentage of total number of AD and PD trials present in a 5‐year bin. Note that the completion year was used to date the trials. AD, Alzheimer's disease; PD, Parkinson's disease

Similar articles

Cited by

References

    1. Alzheimer's Association et al. 2010 Alzheimer's disease facts and figures. Alzheimers Dement. 2010;6(2):158‐194. - PubMed
    1. Yang W, Hamilton JL, Kopil C, et al. Current and projected future economic burden of Parkinson's disease in the US. NPJ Parkinsons Dis. 2020;6(1):1‐9. - PMC - PubMed
    1. Wong W. Economic burden of Alzheimer disease and managed care considerations. Am J Manag Care. 2020;26(8 Suppl):S177‐S183. - PubMed
    1. Rocca WA. The burden of Parkinson's disease: a worldwide perspective. Lancet Neurol. 2018;17(11):928‐929. - PubMed
    1. GBD 2019 Dementia Forecasting Collaborators et al. Estimation of the global prevalence of dementia in 2019 and forecasted prevalence in 2050: an analysis for the global burden of disease study 2019. Lancet Public Health. 2022;7(2):E105‐E125. - PMC - PubMed

LinkOut - more resources