

Engineering placenta-like organoids containing endogenous vascular cells from human-induced pluripotent stem cells
- PMID: 36684087
- PMCID: PMC9842056
- DOI: 10.1002/btm2.10390
Engineering placenta-like organoids containing endogenous vascular cells from human-induced pluripotent stem cells
Abstract
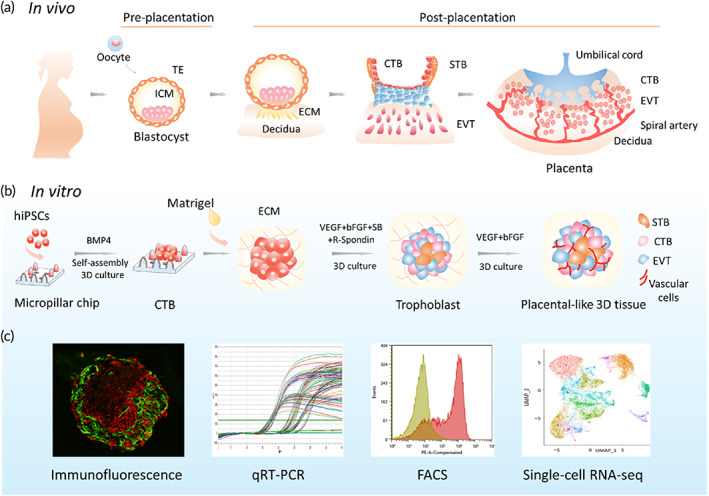
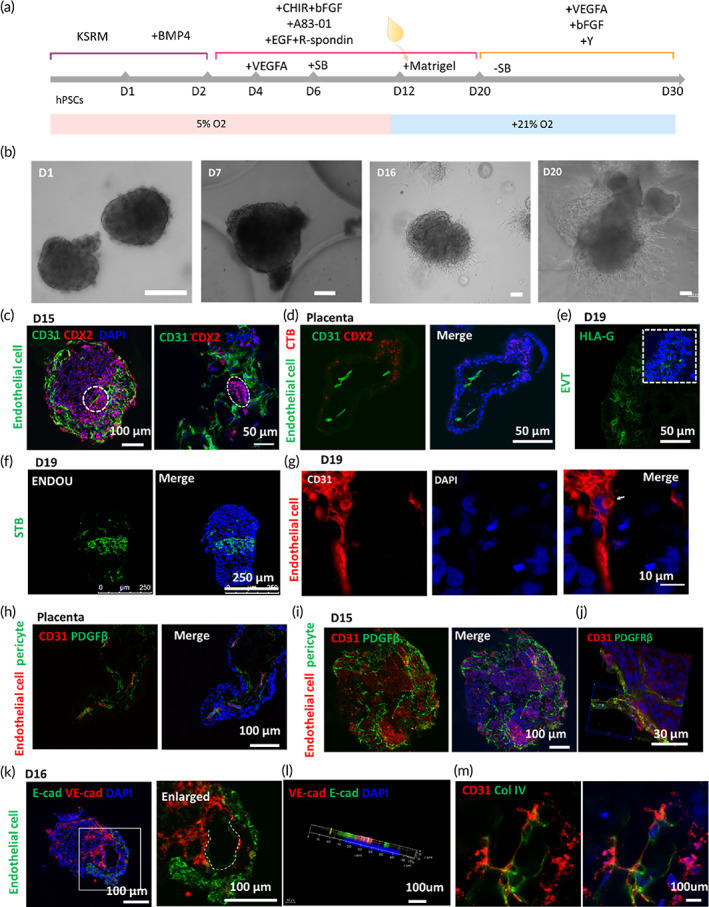
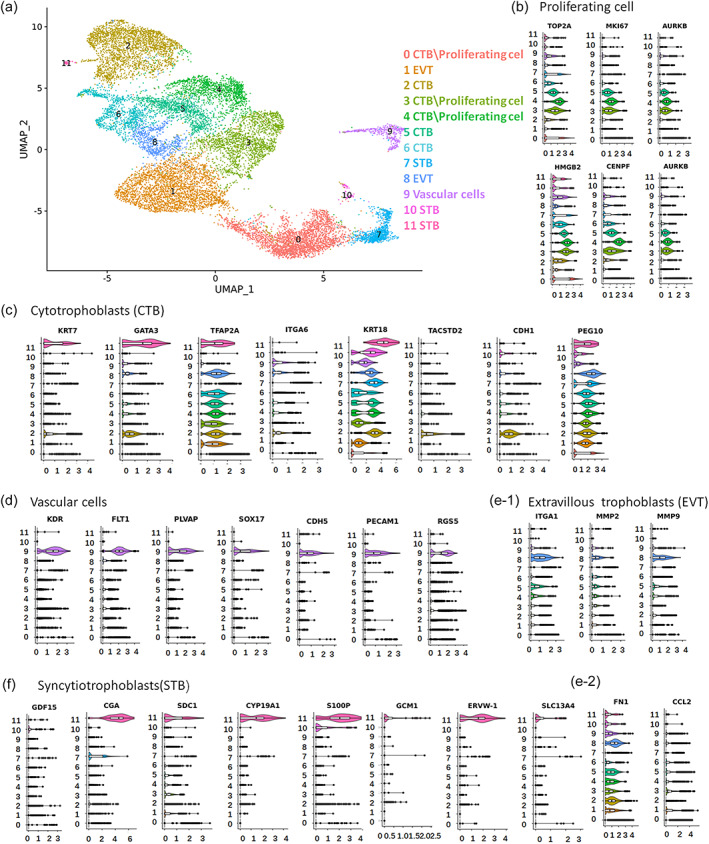
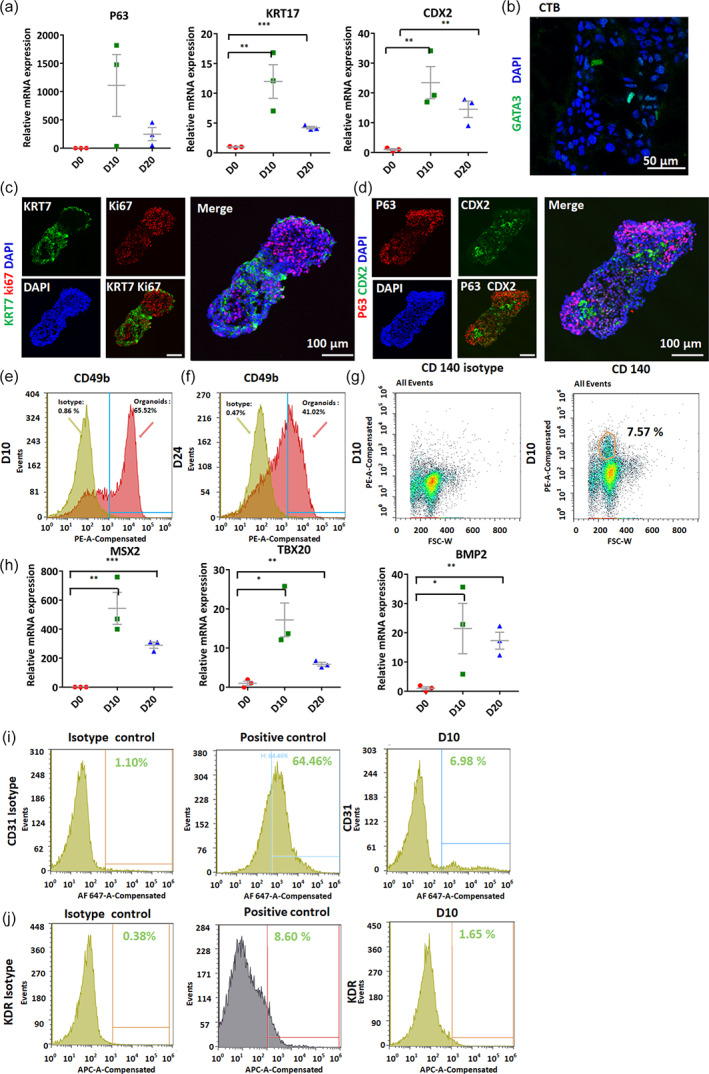
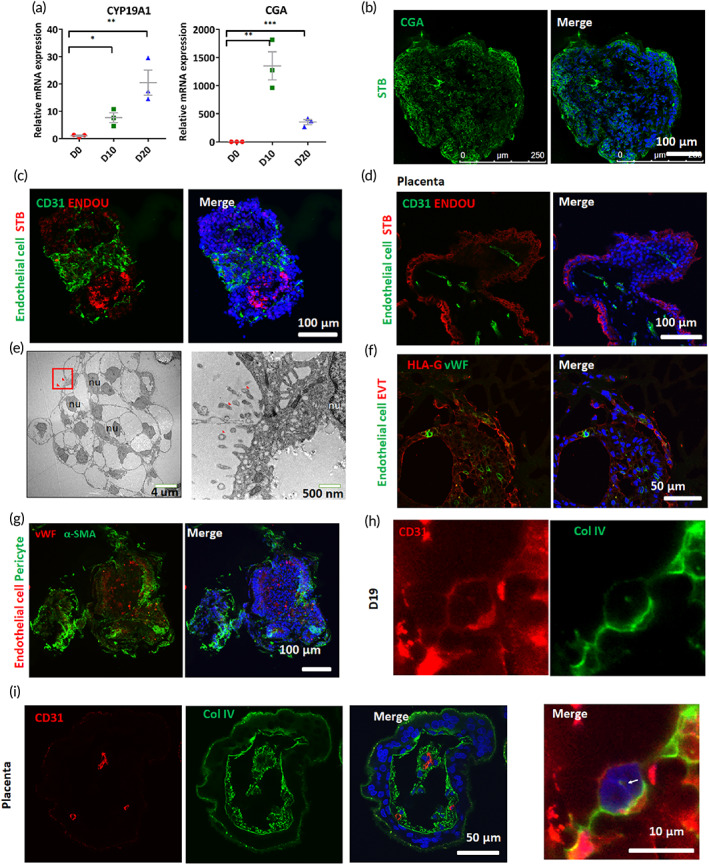
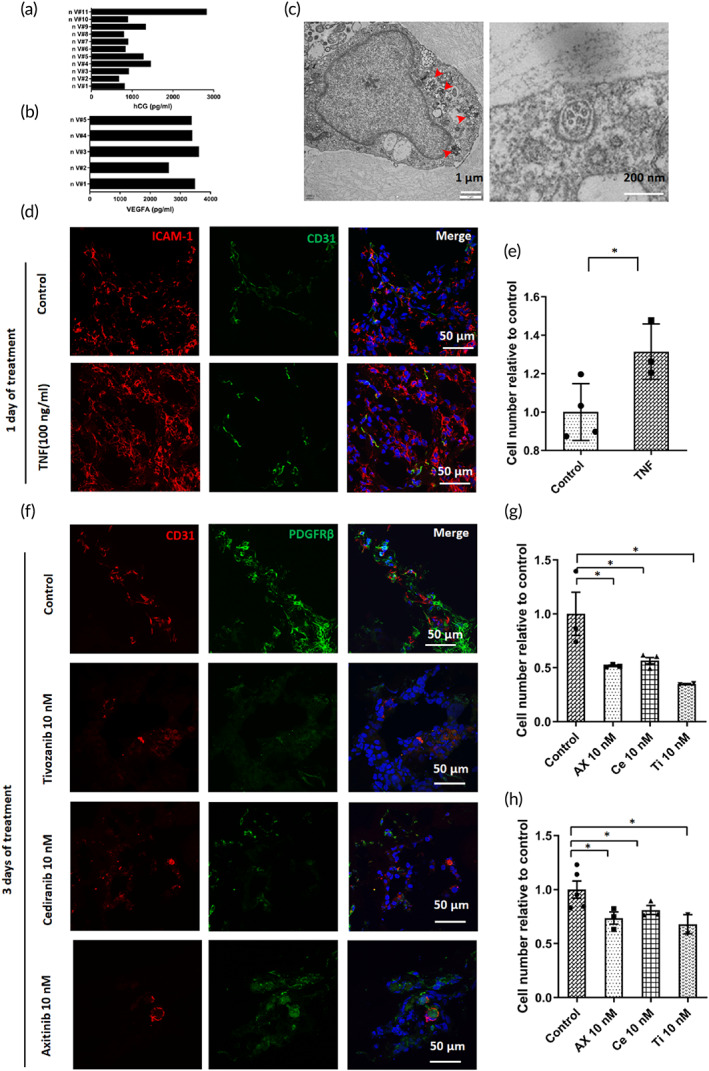
The placenta is an essential organ that maintains the health of both the fetus and its mother. Understanding the development of human placenta has been hindered by the limitations of existing animal models and monolayer cell cultures. Models that can recapitulate the essential aspects of human placental multicellular components and vasculature are still lacking. Herein, we presented a new strategy to establish placenta-like organoids with vascular-like structures from human-induced pluripotent stem cells in a defined three-dimensional (3D) culture system. The resulting placenta-like tissue resembles first-trimester human placental development in terms of complex placental components and secretory function. The multicellular tissue was characterized by the inclusion of trophoblasts (cytotrophoblasts, syncytiotrophoblasts, extravillous trophoblasts, and other endogenous vascular cells), which were identified by immunofluorescence, flow cytometry analyses, real-time quantitative reverse transcription polymerase chain reaction and single-cell RNA-seq. Moreover, the 3D tissue was able to secrete the placenta-specific hormone human chorionic gonadotropin β (hCG-β) and vascular endothelial growth factor A (VEGFA). The tissue responded to the inflammatory factor tumor necrosis factor-α (TNF-α) and VEGF receptor inhibitors. This new model system can represent the major features of placental cellular components, and function, which have not been realized in 2D monolayer cultures. The developed tissue system might open new avenues for studying normal early human placental development and its disease states.
Keywords: 3D culture; human‐induced pluripotent stem cells; in vitro model; placenta; trophoblasts; vasculature.
© 2022 The Authors. Bioengineering & Translational Medicine published by Wiley Periodicals LLC on behalf of American Institute of Chemical Engineers.
Conflict of interest statement
The authors declare no competing interests.
Figures
Similar articles
-
Establishment of Trophoblast-Like Tissue Model from Human Pluripotent Stem Cells in Three-Dimensional Culture System.Adv Sci (Weinh). 2022 Jan;9(3):e2100031. doi: 10.1002/advs.202100031. Epub 2021 Nov 23. Adv Sci (Weinh). 2022. PMID: 34813178 Free PMC article.
-
Three-Dimensional In Vitro Human Placental Organoids from Mononuclear Villous Trophoblasts or Trophoblast Stem Cells to Understand Trophoblast Dysfunction in Fetal Growth Restriction.Methods Mol Biol. 2024;2728:235-245. doi: 10.1007/978-1-0716-3495-0_19. Methods Mol Biol. 2024. PMID: 38019405
-
Purified first and third trimester placental trophoblasts differ in in vitro hormone secretion.J Clin Endocrinol Metab. 1990 Apr;70(4):1187-92. doi: 10.1210/jcem-70-4-1187. J Clin Endocrinol Metab. 1990. PMID: 2318939
-
Accessing the human trophoblast stem cell state from pluripotent and somatic cells.Cell Mol Life Sci. 2022 Nov 25;79(12):604. doi: 10.1007/s00018-022-04549-y. Cell Mol Life Sci. 2022. PMID: 36434136 Free PMC article. Review.
-
An integrated model of preeclampsia: a multifaceted syndrome of the maternal cardiovascular-placental-fetal array.Am J Obstet Gynecol. 2022 Feb;226(2S):S963-S972. doi: 10.1016/j.ajog.2020.10.023. Epub 2021 Mar 9. Am J Obstet Gynecol. 2022. PMID: 33712272 Review.
Cited by
-
Placental Origins of Preeclampsia: Insights from Multi-Omic Studies.Int J Mol Sci. 2024 Aug 28;25(17):9343. doi: 10.3390/ijms25179343. Int J Mol Sci. 2024. PMID: 39273292 Free PMC article. Review.
-
Human organoids-on-chips for biomedical research and applications.Theranostics. 2024 Jan 1;14(2):788-818. doi: 10.7150/thno.90492. eCollection 2024. Theranostics. 2024. PMID: 38169573 Free PMC article. Review.
-
Organoid-on-a-chip (OrgOC): Advancing cystic fibrosis research.Mater Today Bio. 2025 Jul 28;34:102148. doi: 10.1016/j.mtbio.2025.102148. eCollection 2025 Oct. Mater Today Bio. 2025. PMID: 40791795 Free PMC article. Review.
-
Ethical considerations for advancing research using organoid models derived from the placenta.Hum Reprod Update. 2025 Jul 1;31(4):392-401. doi: 10.1093/humupd/dmaf007. Hum Reprod Update. 2025. PMID: 40096642 Free PMC article. Review.
-
Establishment of the fetal-maternal interface: developmental events in human implantation and placentation.Front Cell Dev Biol. 2023 May 17;11:1200330. doi: 10.3389/fcell.2023.1200330. eCollection 2023. Front Cell Dev Biol. 2023. PMID: 37266451 Free PMC article. Review.
References
-
- Turco MY, Moffett A. Development of the human placenta. Development. 2019;146:dev163428. - PubMed
-
- Aplin JD, Myers JE, Timms K, Westwood M. Tracking placental development in health and disease. Nat Rev Endocrinol. 2020;16:479‐494. - PubMed
-
- Kotgirwar S, Ambiye M, Athavale S, Gupta V, Trivedi S. Study of gross and histological features of placenta in intrauterine growth retardation. J Anat Soc India. 2011;60:37‐40.
-
- Scurry J. Pathology of the human placenta (fourth edition). Aust N Z J Obstet Gynaecol. 2002;42(1):116.
-
- Mayhew TM, Wijesekara J, Baker PN, Ong SS. Morphometric evidence that villous development and fetoplacental angiogenesis are compromised by intrauterine growth restriction but not by pre‐eclampsia. Placenta. 2004;25:829‐833. - PubMed
LinkOut - more resources
Full Text Sources
