. 2022 Jul 30;8(1):e10377.
doi: 10.1002/btm2.10377. eCollection 2023 Jan.

Nanoalbumin-prodrug conjugates prepared via a thiolation-and-conjugation method improve cancer chemotherapy and immune checkpoint blockade therapy by promoting CD8+ T-cell infiltration

Affiliations

Nanoalbumin-prodrug conjugates prepared via a thiolation-and-conjugation method improve cancer chemotherapy and immune checkpoint blockade therapy by promoting CD8+ T-cell infiltration

Long Chen et al. Bioeng Transl Med. .

Abstract

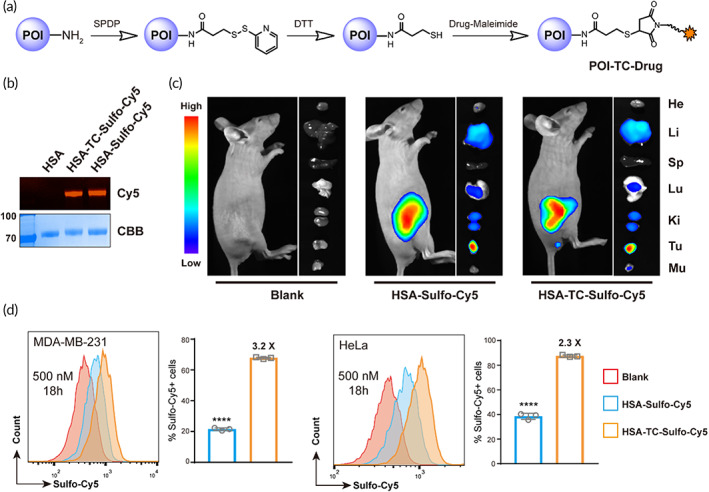
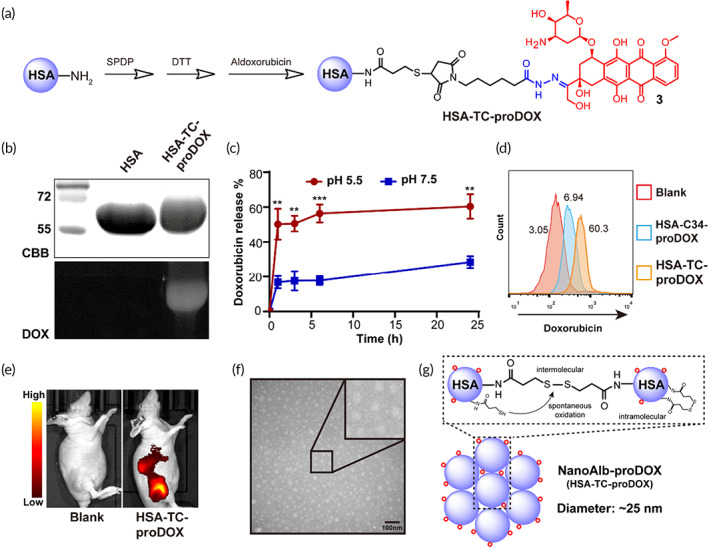
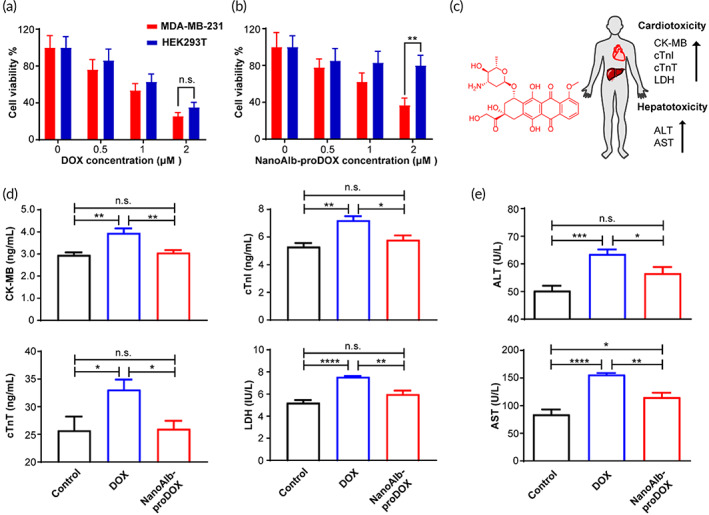
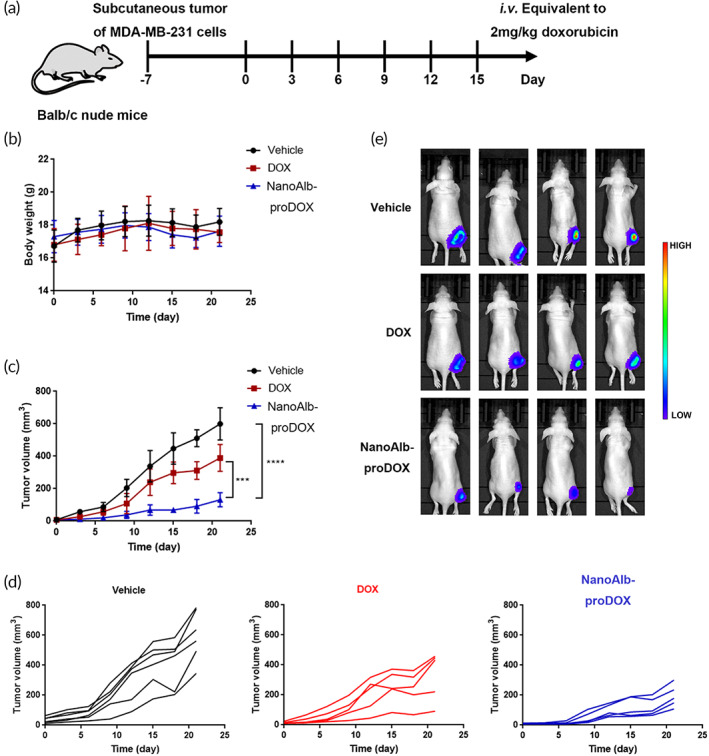
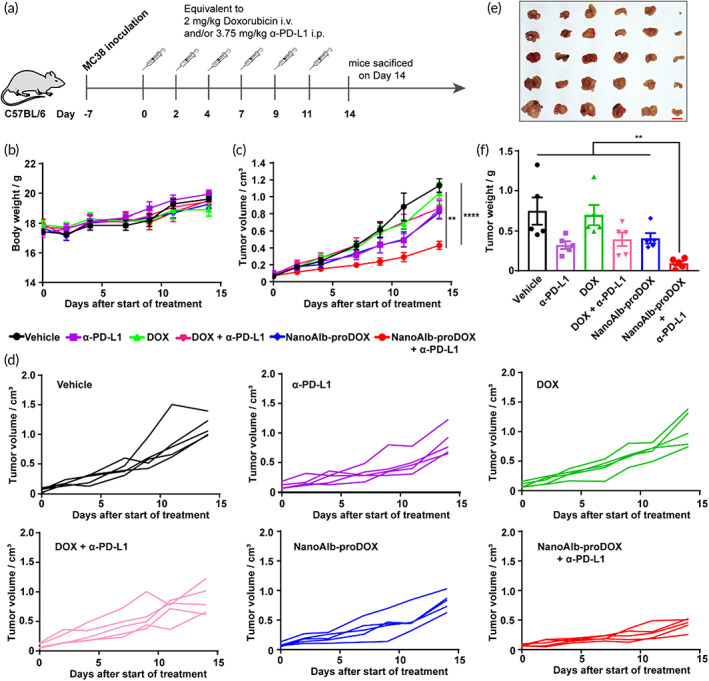
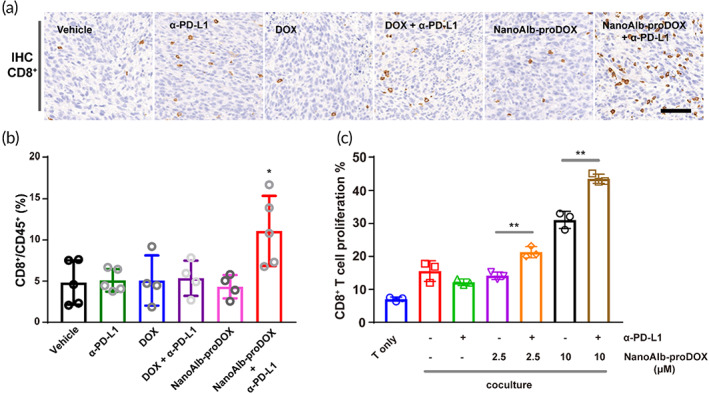
Protein-drug conjugates are emerging tools to combat cancers. Here, we adopted an indirect thiolation-and-conjugation method as a general strategy to prepare protein-drug conjugates. We found for the first time that this method led to the formation of nanometric conjugates, probably due to the formation of intermolecular disulfide bonds, which facilitated enhanced uptake by cancer cells. As a proof-of-concept application in cancer therapy, a nanometric albumin-doxorubicin prodrug conjugate (NanoAlb-proDOX) was prepared. The nanometric size promoted its uptake by cancer cells, and the prodrug characteristic defined its selective cytotoxicity toward cancer cells in vitro and reduced side effects in vivo. In multiple tumor xenograft models, nanometric NanoAlb-proDOX showed superior antitumor activity and synergy with immune checkpoint blockade, probably due to the synergistically enhanced tumor CD8+ T-cell infiltration and activation. Hence, the thiolation-and-conjugation strategy may serve as a generally applicable method for preparing drug conjugates, and the proof-of-concept nanometric albumin-doxorubicin conjugate may be a good choice for antitumor therapy with the ability to co-stimulate the efficacy of immune checkpoint blockade.

Keywords: CD8+ T cells; NanoAlb‐proDOX; immune checkpoint blockade; protein–drug conjugates; thiolation‐and‐conjugation.


Conflict of interest statement

The authors declare no competing financial interest.

Figures

FIGURE 1
FIGURE 1
Thiolation‐and‐conjugation do not alter the tumor targeting of the protein of interest but enhance cancer cellular uptake. (a) Schematic illustration of the synthesis of protein–drug conjugates via the thiolation‐and‐conjugation approach. POI, protein of interest. (b) SDS–PAGE analysis of albumin‐sulfo‐cy5 conjugate (HSA‐TC‐Sulfo‐Cy5). HSA‐Sulfo‐Cy5 was prepared through direct conjugation of Sulfo‐Cy5 to lysine residues on HSA. In gel Cy5 fluorescence indicated that HSA was successfully labeled with Sulfo‐Cy5 using two different methods. CBB, Commassie brilliant blue staining; Cy5, Sulfo‐Cy5 fluorescence. (c) In vivo and ex vivo imaging of the tumor targeting of HSA‐TC‐Sulfo‐Cy5. HSA‐Sulfo‐Cy5 or HSA‐TC‐Sulfo‐Cy5 was intravenously injected into mice bearing MDA‐MB‐231 subcutaneous tumors, and fluorescence imaging was performed 24 h post‐injection using a living animal imaging system. No obvious differences in tumor accumulation were observed between HSA‐Sulfo‐Cy5 or HSA‐TC‐Sulfo‐Cy5. (d) Enhanced cellular uptake of HSA‐TC‐Sulfo‐Cy5 by cancer cell lines. Two cancer cells were incubated with the indicated concentrations of protein–dye conjugates for 18 h, and flow cytometry analysis showed that the uptake of HSA‐TC‐Sulfo‐Cy5 was higher than that of HSA‐Sulfo‐Cy5 in both MDA‐MB‐231 and HeLa cells. The marked concentration represents the concentration of Sulfo‐Cy5 added to the cell culture. The percentages of Sulfo‐Cy5‐positive cells were gated, and fold changes between the two conjugates are marked. Data are presented as the mean ± SEM. n = 3 technical replicates. ****p < 0.0001
FIGURE 2
FIGURE 2
Synthesis and characterization of NanoAlb‐proDOX. (a) Schematic illustration of the synthesis of HSA‐TC‐proDOX. (b) SDS–PAGE analysis of HSA and HSA‐TC‐proDOX. In gel doxorubicin fluorescence of HSA‐TC‐proDOX indicated that HSA was successfully labeled with doxorubicin. CBB, Commassie brilliant blue staining; DOX, doxorubicin fluorescence. (c) pH‐dependent doxorubicin release from HSA‐TC‐proDOX. pH 7.5 and 4.5 were selected to simulate the environment of blood circulation or the tumor microenvironment, respectively. (d) Flow cytometry plots showing enhanced uptake of HSA‐TC‐proDOX by HeLa cancer cells. Conjugate with one micromolar doxorubicin was incubated with HeLa cells for 24 h and analyzed by flow cytometry. The percentages of positive cells are marked. (e) Accumulation of HSA‐TC‐proDOX in tumors. Cy5‐labeled HSA‐TC‐proDOX was intravenously injected into mice bearing MDA‐MB‐231 subcutaneous tumors, and fluorescence imaging of live animals was performed 24 h post‐injection. Accumulation of HSA‐TC‐proDOX in the tumor region was observed. (f) Transmission electron microscopy (TEM) image of HSA‐TC‐proDOX. Scale bar: 100 nm. (g) Proposed mechanism of the nanoparticle formation of HSA‐TC‐proDOX. The nanoparticle was speculated to assemble via the spontaneous oxidation of the excess sulfhydryl groups to form intermolecular disulfide bonds. Intracellular disulfide bonds and residual sulfhydryl groups may also exist. Red circles represent the proDOX molecules. HSA‐TC‐proDOX is hereafter named NanoAlb‐proDOX. Data are presented as the mean ± SEM. n = 3 technical replicates. **p < 0.01, ***p < 0.001
FIGURE 3
FIGURE 3
Analysis of in vitro cytotoxicity and in vivo cardiotoxicity and hepatotoxicity of NanoAlb‐proDOX. (a) Dose‐dependent cytotoxicity of doxorubicin toward MDA‐MB‐231 cancer cells and HEK293T noncancer cells. No significant cytotoxicity differences between the two cell lines were observed. n = 3 and represents three technical replicates. (b) Dose‐dependent cytotoxicity of NanoAlb‐proDOX to MDA‐MB‐231 cancer cells and HEK293T noncancer cells. Significantly higher cytotoxicity to MDA‐MB‐231 cancer cells was observed at higher concentrations. n = 3 and represents three technical replicates. Cells were treated with the indicated drugs for 24 h in (a) and (b) prior to the cell viability test. (c) Schematic representation of the cardiotoxicity and hepatotoxicity induced by doxorubicin and related upregulated protein markers. (d) Serum concentrations of cardiotoxicity markers. n = 5 mice. (e) Serum concentrations of hepatotoxicity markers. n = 5 mice. Serum markers were detected using ELISA. Doxorubicin induced higher concentrations of cardiotoxicity and hepatotoxicity markers, while NanoAlb‐proDOX showed no obvious cardiotoxicity or hepatotoxicity. Data are presented as the mean ± SEM. n.s. not significant, *p < 0.05, **p < 0.01, ***p < 0.001, ****p < 0.0001
FIGURE 4
FIGURE 4
Antitumor activity of NanoAlb‐proDOX in breast cancer xenografts. (a) Schematic representation of the design of animal experiments. Drugs were administered intravenously every 3 days for a total of six doses. (b) Body weight curves of the treated mice. Body weights were measured every 3 days. (c) Average tumor volume curves of the treated mice. Tumor volumes were measured every 3 days. Significantly reduced tumor proliferation was observed in mice treated with NanoAlb‐proDOX. (d) Individual tumor growth curves of the mice treated with Vehicle, DOX or NanoAlb‐proDOX. (e) Representative bioluminescence images of the mice posttreatment. Images were taken at Day 21. The weakest bioluminescence signal was observed in mice treated with NanoAlb‐proDOX. Data are presented as the mean ± SEM. n = 6 mice for the vehicle group and n = 5 mice for the DOX and NanoAlb‐proDOX groups. ***p < 0.001, ****p < 0.0001
FIGURE 5
FIGURE 5
NanoAlb‐proDOX synergized with immune checkpoint blockade. (a) Schematic representation of the design of animal experiments. Drugs were administered on the indicated days intravenously or intraperitoneally and sacrificed on Day 14. (b) Body weight curves. (c) Average tumor volume curves. Mice were randomly divided into six groups. Body weights and tumor volumes were measured every 2 or 3 days from Day 0 to Day 14. (d) Individual tumor growth curves of the six groups of mice. (e) Images of the tumor tissues. Scale bar: 1 cm. (f) Weights of the collected tumor tissues; (e) and (f) used the same group labels. Data are presented as the mean ± SEM. n = 5 mice for each group. **p < 0.01, ****p < 0.0001
FIGURE 6
FIGURE 6
(a) Immunohistochemical (IHC) staining of infiltrated CD8+ T cells in tumor tissues. Scale bar: 100 μm. (b) Quantitative analysis of CD8+ T cells in tumor tissues from flow cytometry data. Tumor tissues were digested and resuspended. Single and viable cells were gated using flow cytometry. The CD8+ cell population in the CD45+ cell population was assessed. n = 4 or 5 mice. Asterisks indicate significance for the NanoAlb‐proDOX plus α‐PD‐L1 group against all other groups. (c) In vitro coculture assay to validate the proliferation of CD8+ T cells. CD8+ T cells were labeled with CFSE to monitor the proliferation of T cells. n = 3 and represents three technical replicate cell culture wells. Data are presented as the mean ± SEM. *p < 0.05, **p < 0.01

Similar articles

Cited by

References

    1. Bray F, Ferlay J, Soerjomataram I, Siegel RL, Torre LA, Jemal A. Global cancer statistics 2018: GLOBOCAN estimates of incidence and mortality worldwide for 36 cancers in 185 countries. CA Cancer J Clin. 2018;68(6):394‐424. - PubMed
    1. Yang Y. Cancer immunotherapy: harnessing the immune system to battle cancer. J Clin Invest. 2015;125(9):3335‐3337. - PMC - PubMed
    1. Eifel PJ. Concurrent chemotherapy and radiation therapy as the standard of care for cervical cancer. Nat Clin Pract Oncol. 2006;3(5):248‐255. - PubMed
    1. Mazhar D, Waxman J. Early chemotherapy in prostate cancer. Nat Clin Pract Urol. 2008;5(9):486‐493. - PubMed
    1. Kroon J, Kooijman S, Cho NJ, Storm G, van der Pluijm G. Improving taxane‐based chemotherapy in castration‐resistant prostate cancer. Trends Pharmacol Sci. 2016;37(6):451‐462. - PubMed