. 2023;12(1):1.
doi: 10.1140/epjds/s13688-022-00375-1. Epub 2023 Jan 16.

Has Covid-19 permanently changed online purchasing behavior?

Affiliations

Has Covid-19 permanently changed online purchasing behavior?

Hiroyasu Inoue et al. EPJ Data Sci. 2023.

Abstract

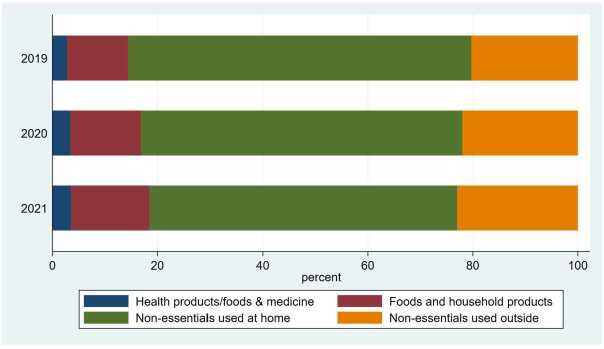
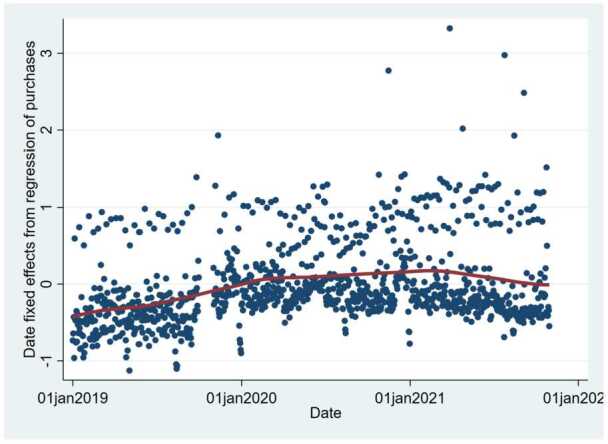
This study examines how the COVID-19 pandemic has affected online purchasing behavior using data from a major online shopping platform in Japan. We focus on the effect of two measures of the pandemic, i.e., the number of positive COVID-19 cases and state declarations of emergency to mitigate the pandemic. We find that both measures promoted online purchases at the beginning of the pandemic, but in later periods, their effect faded. In addition, online purchases returned to normal after states of emergency ended, and the overall time trend in online purchases excluding the effects of the two measures was stable during the first two years of the pandemic. These results suggest that the effect of the pandemic on online purchasing behavior is temporary and will not persist after the pandemic.

Supplementary information: The online version contains supplementary material available at 10.1140/epjds/s13688-022-00375-1.

Keywords: BtoC; Consumer behavior; Covid-19; Online purchasing; Online shopping; State of emergency; Stay at home.


Conflict of interest statement

Competing interestsThe authors declare that they have no competing interests.

Figures

Figure 1
Figure 1
Annual Sales of the Top Three Online Platforms. The top three online platforms in Japan are Rakuten Group, Inc., Amazon Japan G.K., and Z Holdings (the parent company of Yahoo! Japan). We used all of the Amazon Japan sales since Amazon Japan does not publish online shopping sales alone. Data source: [–32]
Figure 2
Figure 2
Changes in COVID-19 Cases and Online Purchases and Buyers over Time from January 1, 2019, to October 30, 2021. This figure shows the total number of daily positive COVID-19 cases in Japan averaged over one week (the red line), the number of prefectures in a state of emergency (SoE) due to COVID-19 (the shaded area), and the total number of daily purchases on the online shopping platform in Japan (the blue line). Data source: Ministry of Health, Labor and Welfare [33] and Cabinet Secretariat of Japan [34]
Figure 3
Figure 3
Share of the Purchase Amount in Each Year by Category. This figure shows the share of each of the four categories of the total purchase amount on the online shopping site in each year
Figure 4
Figure 4
State of Emergency by Prefecture and Week. In this figure, a red cell indicates that the prefecture shown in the first column is in a state of emergency (SoE) in the week shown in the first row, running from the week of April 12, 2020, to that of October 3, 2021, whereas an orange cell indicates that it is in a semi-SoE. The weeks before April 12, 2020, and after October 3, 2021, are omitted because these periods had no SoE or semi-SoE. Data source: [34]
Figure 5
Figure 5
Effects of the Number of COVID-19 Cases and the Declaration of a State of Emergency on the Purchase Amount, the Number of Buyers, and the Purchase Amount per Buyer. This figure illustrates the results from the regressions of the purchase amount, the number of buyers, and the purchase amount per buyer in logs at the city-date level. The left panel shows the point estimates and 95% confidence intervals of the effect of the number of COVID-19 cases per 1000 persons averaged over one week on the purchase amount (blue), the number of buyers (red), and the purchase amount per buyer (green) in the five waves of COVID-19 in the sample period. The right panel shows the coefficients and 95% confidence intervals of the declaration of a state of emergency (SoE), separated into the months of the sample period and a semi-SoE, which is less restrictive than an SoE. The number of COVID-19 cases and the declaration of an SoE are given at the prefecture–date level. We take a log of the number of COVID-19 cases per 1000 persons plus 0.001 to incorporate possible nonlinear relationships. In all the regressions, the other independent variables are the number of neighboring prefectures in an SoE; the dummy variables for 1-4 weeks before and after the declaration of an SoE and a semi-SoE; and the city, date, and day-of-the-week fixed effects. The standard errors are clustered at the city level. N = 1,091,171
Figure 6
Figure 6
Pre- and Posttreatment Effects of the Declaration of a State of Emergency on the Purchase Amount, the Number of Buyers, and the Purchase Amount per Buyer. This figure illustrates the results from the regressions of the purchase amount, the number of buyers, and the purchase amount per buyer in logs at the city–date level. The left panel shows the point estimates and 95% confidence intervals of the dummies for 1-4 weeks before the declaration of a state of emergency (SoE) on the purchase amount (blue), the number of buyers (red), and the purchase amount per buyer (green). The right panel shows those of the dummies for 1-4 weeks after the end of an SoE. The dummies for before and after an SoE are given at the prefecture–date level. For example, “4 wk/2020” on the x-axis of the left panel means 4 weeks before an SoE in 2020, whereas “1wk/2020” in the right panel means 1 week after an SoE in 2020. In all the regressions, the other independent variables are the number of COVID-19 cases per 1000 persons; the dummies for an SoE; the number of neighboring prefectures in an SoE; and the city, date, and day-of-the-week fixed effects. The standard errors are clustered at the city level. N = 1,091,171
Figure 7
Figure 7
Date Fixed Effects from the Regression of the Purchase Amount. In this figure, the blue dots represent the date fixed effects estimated from the regressions of the purchase amount at the city level for each date, and the red line represents the fitted relationship between date fixed effects and the dates using a nonparametric local–linear kernel regression. The independent variables are the number of COVID-19 cases per 1000 persons, the declaration of a state of emergency (SoE); the number of neighboring prefectures in an SoE; the dummy variables for 1-4 weeks before and after the declaration of an SoE and a semi-SoE; and the city, date, and day-of-the-week fixed effects. The standard errors are clustered at the city level. N = 1,091,171
Figure 8
Figure 8
Effects of the Declaration of a State of Emergency in Neighboring Prefectures on the Purchase Amount, the Number of Buyers, and the Purchase Amount per Buyer. This figure illustrates the point estimates and 95% confidence intervals of the effect of the number of prefectures that were in a state of emergency (SoE) and shared any border with the focal prefecture in different months on the purchase amount (blue), the number of unique buyers (red), and the purchase amount per unique buyer (green) in logs. In all the regressions, the other independent variables are the dummies for an SoE; the dummies for before an SoE; the number of COVID-19 cases per 1000 persons; the number of neighboring prefectures in an SoE; and the prefecture, product, date, and day-of-the-week fixed effects. The standard errors are clustered at the city level. N = 1,091,171
Figure 9
Figure 9
Effects of the Number of COVID-19 Cases on the Purchase Amount, the Number of Buyers, and the Purchase Amount per Buyer by Product Category. This figure illustrates the results from the regressions of the purchase amount, the number of buyers, and the purchase amount per buyer in logs at the prefecture–product–date level by the product category. The dots and lines indicate the coefficients and 95% confidence intervals of the effect of the dummies for 1-4 weeks after a state of emergency (SoE) in different months on the purchase amount (blue), the number of buyers (red), and the purchase amount per buyer (green). In all the regressions, the other independent variables are the dummies for an SoE; the dummies for before an SoE; the number of COVID-19 cases per 1000 persons; the number of neighboring prefectures in an SoE; and the prefecture, product, date, and day-of-the-week fixed effects. The standard errors are clustered at the prefecture and date levels. N = 188,437
Figure 10
Figure 10
Effects of a State of Emergency on the Purchase Amount, the Number of Buyers, and the Purchase Amount per Buyer by Product Category. This figure illustrates the results from the regressions of the purchase amount, the number of buyers, and the purchase amount per buyer in logs at the prefecture–product–date level by the product category. The dots and lines indicate the coefficients and 95% confidence intervals of the effect of the dummies for 1-4 weeks after a state of emergency (SoE) in different months on the purchase amount (blue), the number of buyers (red), and the purchase amount per buyer (green). In all the regressions, the other independent variables are the dummies for an SoE; the dummies for before an SoE; the number of COVID-19 cases per 1000 persons; the number of neighboring prefectures in an SoE; and the prefecture, product, date, and day-of-the-week fixed effects. The standard errors are clustered at the prefecture and date levels. N = 188,437
Figure 11
Figure 11
Posttreatment Effects of a State of Emergency on the Purchase Amount Purchases, the Number of Buyers, and the Purchase Amount per Buyer by Product Category. This figure illustrates the results from the regressions of the purchase amount, the number of buyers, and the purchase amount per buyer in logs at the prefecture–product–date level by the product category. The dots and lines indicate the coefficients and 95% confidence intervals of the effect of the dummies for 1-4 weeks after a state of emergency (SoE) in different months on the purchase amount (blue), the number of buyers (red), and the purchase amount per buyer (green). “1wk/2020” on the x-axis means 1 week after an SoE in 2020. In all the regressions, the other independent variables are the dummies for an SoE; the dummies for before an SoE; the number of COVID-19 cases per 1000 persons; the number of neighboring prefectures in an SoE; and the prefecture, product, date, and day-of-the-week fixed effects. The standard errors are clustered at the prefecture and date levels. N = 188,437

References

    1. Baker SR, Farrokhnia RA, Meyer S, Pagel M, Yannelis C. How does household spending respond to an epidemic? Consumption during the 2020 Covid-19 pandemic. Rev Asset Pricing Stud. 2020;10(4):834–862. doi: 10.1093/rapstu/raaa009. - DOI
    1. Chen H, Qian W, Wen Q. The impact of the Covid-19 pandemic on consumption: learning from high-frequency transaction data. AEA Papers and Proceedings. 2021;111:307–311. doi: 10.1257/pandp.20211003. - DOI
    1. Chronopoulos DK, Lukas M, Wilson JO (2020) Consumer spending responses to the COVID-19 pandemic: an assessment of Great Britain. Available at SSRN 3586723
    1. Coibion O, Gorodnichenko Y, Weber M (2020) The cost of the COVID-19 crisis: lockdowns, macroeconomic expectations, and consumer spending. National Bureau of Economic Research. NBER Working Paper, No. 27141
    1. Cruz-Cárdenas J, Zabelina E, Guadalupe-Lanas J, Palacio-Fierro A, Ramos-Galarza C. Covid-19, consumer behavior, technology, and society: a literature review and bibliometric analysis. Technol Forecast Soc Change. 2021;173:121179. doi: 10.1016/j.techfore.2021.121179. - DOI - PMC - PubMed

LinkOut - more resources