. 2023 Jan 4:10:1027334.
doi: 10.3389/fcell.2022.1027334. eCollection 2022.

Interplay between integrins and cadherins to control bone differentiation upon BMP-2 stimulation

Affiliations

Interplay between integrins and cadherins to control bone differentiation upon BMP-2 stimulation

Anne Valat et al. Front Cell Dev Biol. .

Abstract

Introduction: Upon BMP-2 stimulation, the osteoblastic lineage commitment in C2C12 myoblasts is associated with a microenvironmental change that occurs over several days. How does BMP-2 operate a switch in adhesive machinery to adapt to the new microenvironment and to drive bone cell fate is not well understood. Here, we addressed this question for BMP-2 delivered either in solution or physically bound of a biomimetic film, to mimic its presentation to cells via the extracellular matrix (ECM). Methods: Biommetics films were prepared using a recently developed automated method that enable high content studies of cellular processes. Comparative gene expressions were done using RNA sequencing from the encyclopedia of the regulatory elements (ENCODE). Gene expressions of transcription factors, beta chain (1, 3, 5) integrins and cadherins (M, N, and Cad11) were studied using quantitative PCR. ECM proteins and adhesion receptor expressions were also quantified by Western blots and dot blots. Their spatial organization in and around cells was studied using immuno-stainings. The individual effect of each receptor on osteogenic transcription factors and alkaline phosphatase expression were studied using silencing RNA of each integrin and cadherin receptor. The organization of fibronectin was studied using immuno-staining and quantitative microscopic analysis. Results: Our findings highlight a switch of integrin and cadherin expression during muscle to bone transdifferentiation upon BMP-2 stimulation. This switch occurs no matter the presentation mode, for BMP-2 presented in solution or via the biomimetic film. While C2C12 muscle cells express M-cadherin and Laminin-specific integrins, the BMP-2-induced transdifferentiation into bone cells is associated with an increase in the expression of cadherin-11 and collagen-specific integrins. Biomimetic films presenting matrix-bound BMP-2 enable the revelation of specific roles of the adhesive receptors depending on the transcription factor. Discussion: While β3 integrin and cadherin-11 work in concert to control early pSMAD1,5,9 signaling, β1 integrin and Cadherin-11 control RunX2, ALP activity and fibronectin organization around the cells. In contrast, while β1 integrin is also important for osterix transcriptional activity, Cadherin-11 and β5 integrin act as negative osterix regulators. In addition, β5 integrin negatively regulates RunX2. Our results show that biomimetic films can be used to delinate the specific events associated with BMP-2-mediated muscle to bone transdifferentiation. Our study reveals how integrins and cadherins work together, while exerting distinct functions to drive osteogenic programming. Different sets of integrins and cadherins have complementary mechanical roles during the time window of this transdifferentiation.

Keywords: BMP-2 (bone morphogenetic protein-2); adhesion receptors; cadherins; extracellular matrix (ECM); integrins; osteoblast differentation.


Conflict of interest statement

The authors declare that the research was conducted in the absence of any commercial or financial relationships that could be construed as a potential conflict of interest.

Figures

FIGURE 1
FIGURE 1
sBMP-2 and bBMP-2 drive the muscle to osteoblast transdifferentiation of C2C12 cells. Myogenic (blue) and osteogenic (green) differentiation of C2C12 cells assessed in the presence or absence of BMP-2. Cells were cultured on TCPS in the presence of soluble BMP-2 (sBMP-2). (A) Schematics indicating the different time points of the kinetic analysis and biological assays performed. C2C12 cells were seeded on TCPS as control with or without sBMP-2. 1 day after seeding in GM (D0), when cells were confluent, the medium was changed to DM. The medium was renewed at D3 and D5. (B–E) The kinetics of cell differentiation was assessed by measuring the gene expression of (B) MyoD and (C) myogenin for myogenic differentiation, and (D) Osterix and (E) Osteocalcin for osteogenic differentiation. The transcription factors (B′) Myo D, (C′) Myogenin, and (D′) Osterix were analyzed by immunofluorescence. Images correspond to D0. Nuclei were highlighted with white circle (B′,C′,D′). Corresponding quantifications of the percentage of positive cells i.e., with a nuclear intensity of protein inside the nucleus above the threshold. Data are represented as box plots of three independent experiments (B'',C'',D''). (E′) Alizarin red staining of calcium aggregates in the case of sBMP-2 for cells on TCPS and bBMP-2 for cells on films. (E'') SEM observation of the typical shape of calcium aggregates on bBMP-2-loaded films. Scale bar fluorescent images is 50 µm. Scale bar of alizarin red-stained samples is 400 µm. Scale bar of SEM image is 50 µm. Data are mean ± SD of three independent experiments. Statistical tests were done using non-parametric Kruskal–Wallis ANOVA (*p < 0.05; **p < 0.01).
FIGURE 2
FIGURE 2
bBMP-2 and sBMP-2 induce the gene expression, secretion and remodeling of fibronectin and collagen I in C2C12 cells. (A,B) Gene expression of FN and COLL1 were followed up to D5 in the presence (green) or absence (blue) of sBMP-2 on TCPS. At D5 for cells grown on films with bBMP-2 or on TCPS with sBMP-2 (A′) FN and (B′) COLL1 were stained using immunofluorescence and quantified by dot blot (A'',B'' respectively), by taking actin as a control. Scale bars are 150 µm. Data are mean ± SEM of three independent experiments.
FIGURE 3
FIGURE 3
Identification using the ENCODE database of muscle and osteoblast-specific integrins and cadherins. (A) Pie chart of the percentage of expression of ITGB1, three and five chains (A) and M-, N- and cadherin and cadherin-11 in muscle and osteoblast cells. Data were obtained by analyzing RNA sequencing data made for the ENCODE public research project i.e., charts illustrate the predominance of certain adhesion receptors in each cell type. (B) Summary table highlighting the adhesion receptor repertoire for myogenic and osteogenic differentiation and the receptors that are important for both tissues. The underlined adhesion receptors are the most studied in the literature in the context of myogenic and bone differentiation.
FIGURE 4
FIGURE 4
bBMP-2 and sBMP-2 induce the expression switch towards specific integrins and cadherin 11 in C2C12 cells. Kinetics of gene expression of (A) ITGB chains (B) cadherins quantified by RT-qPCR for cells cultured on TCPS without (blue) or with (green) sBMP-2 in solution. (A′,B′) Western blots and (A'',B'') corresponding analysis of kinetics of protein expression. Actin was taken as control for intensity normalization. Data are mean ± SD of three independent experiments.
FIGURE 5
FIGURE 5
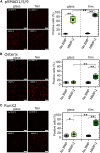
Quantification of the nuclear localization of selected transcription factors in response to soluble and matrix-bound BMP-2. Selected transcription factors that are representative of bone differentiation, i.e., (A) pSMAD1/5/9, (B) osterix, and (C) RunX2, were quantified for C2C12 myoblasts grown on glass in the presence or absence of sBMP-2 and for cells cultured on biomimetic films with or without matrix-bound BMP-2. Representative immuno-fluorescence images of cells cultured in the different conditions are shown. Scale bar of fluorescent images is 100 µm. The corresponding quantifications of the nuclear location of the transcription factors based on the immuno-fluorescence are given for cells in the presence of sBMP-2, bBMP-2 and in the absence of BMP-2. The % of positive cells is given for each condition. Data are represented as box plots for three independent experiments.
FIGURE 6
FIGURE 6
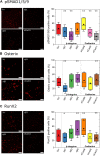
Role of β chain integrins and cadherins on the nuclear localization of transcription factors involved in osteoblast differentiation. Using RNA interference, silencing of the major integrins (β1, 3, 5 subunits) and cadherins (M-cad, N-cad, cad11) was done to assess their individual role on the nuclear localization of (A) pSMAD1,5,9, (B) Osterix and (C) Runx2, for cells cultured on films with bBMP-2. Representative images are shown for selected conditions that have the strongest effects on the nuclear localization of the transcription factor. Scale bar of fluorescent images is 100 µm. Data are represented as box plots for three independent experiments. Statistical tests were done using non-parametric Kruskal–Wallis ANOVA (*p < 0.05; **p < 0.01).
FIGURE 7
FIGURE 7
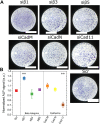
Role of β chain integrins and cadherins in ALP expression. ALP expression was quantified after silencing of the three major β chain integrins and cadherins (same conditions as in Figure 6) (A) Representative images of a single well of a 96-well plate are shown for each silencing condition. (B) Quantification of alkaline phosphatase activity (ALP) after 4 days of C2C12 cell culture (24H in GM and 72 H in DM) on films with matrix-bound BMP-2, after RNA silencing of each β chain integrin and cadherin receptor. In each experiment, data were normalized to the scramble condition. Data are mean ± SEM of three independent experiments. Statistical tests were done using non-parametric Kruskal–Wallis ANOVA (*p < 0.05; **p < 0.01).
FIGURE 8
FIGURE 8
BMP-2-induced fibronectin remodeling depends on ITGB1 and cad-11. (A) Microscopic observations of fibronectin network after silencing using RNA of ITGB1, 3, 5 and M-cad, N-cad, cad-11 (same as in Figures 6, 7). Fibronectin (green) and actin (blue) were stained by immunofluorescence after 4 days (24 h in GM and 3 days in DM) of C2C12 cell cultured on films with matrix-bound BMP-2. (A) Representative image of each of the silencing condition. Scale bar are 50 µm. (B) Zoom on two conditions: silencing of β1 integrins and cadherin 11. Scale bar is 20 µm. (C) Quantification of the areal fraction of diffuse and fibrous fibronectin given: the total is set to 100 and the fraction represents the importance of each population. Data are mean ± SD of three independent experiments. Statistical tests were done using non-parametric Kruskal–Wallis ANOVA (*p < 0.05; **p < 0.01).

Similar articles

Cited by

References

    1. Abou-Khalil R., Yang F., Lieu S., Julien A., Perry J., Pereira C., et al. (2015). Role of muscle stem cells during skeletal regeneration. Stem cells 33 (5), 1501–1511. 10.1002/stem.1945 - DOI - PubMed
    1. Abou-Khalil R., Yang F., Mortreux M., Lieu S., Yu Y. Y., Wurmser M., et al. (2014). Delayed bone regeneration is linked to chronic inflammation in murine muscular dystrophy. J. Bone Min. Res. 29 (2), 304–315. 10.1002/jbmr.2038 - DOI - PMC - PubMed
    1. Akiyama S., Katagiri T., Namiki M., Yamaji N., Yamamoto N., Miyama K., et al. (1997). Constitutively active BMP type I receptors transduce BMP-2 signals without the ligand in C2C12 myoblasts. Exp. Cell Res. 235 (2), 362–369. 10.1006/excr.1997.3680 - DOI - PubMed
    1. Alimperti S., You H., George T., Agarwal S. K., Andreadis S. T. (2014). Cadherin-11 regulates both mesenchymal stem cell differentiation into smooth muscle cells and the development of contractile function in vivo . J. Cell Sci. 127 (12), 2627–2638. 10.1242/jcs.134833 - DOI - PMC - PubMed
    1. Asakura A., Komaki M., Rudnicki M. (2001). Muscle satellite cells are multipotential stem cells that exhibit myogenic, osteogenic, and adipogenic differentiation. Differentiation. 68 (4-5), 245–253. 10.1046/j.1432-0436.2001.680412.x - DOI - PubMed

LinkOut - more resources